Download to read offline
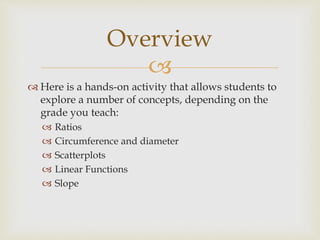
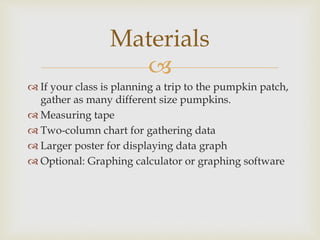
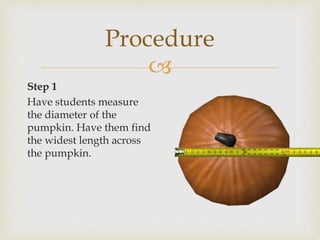
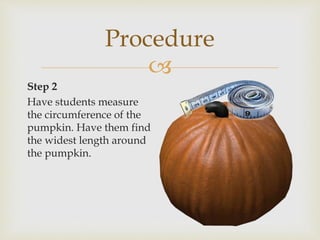
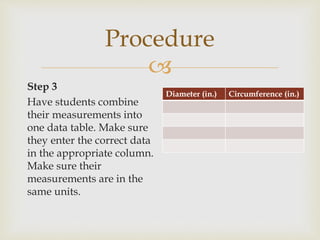
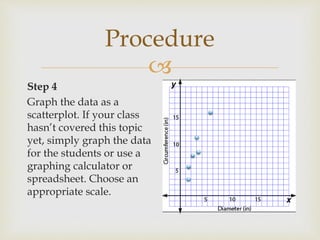
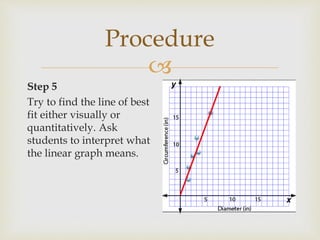
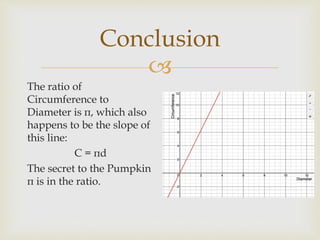

This document outlines a multi-grade math activity involving pumpkins that teaches concepts such as ratios, circumference, scatterplots, and linear functions. It includes step-by-step procedures for measuring and graphing the data, culminating in understanding the relationship between circumference and diameter, represented by the ratio π. An optional component suggests celebrating the activity with pumpkin pie for the students.


