Download to read offline


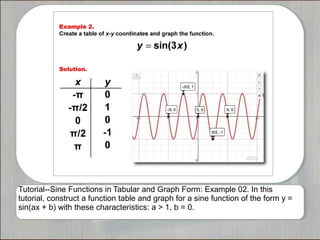
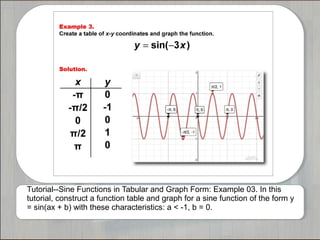
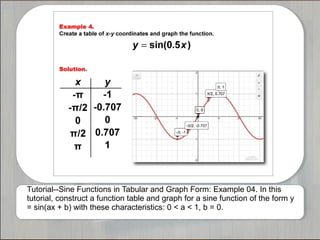
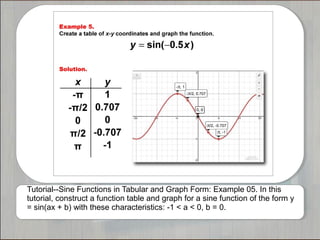
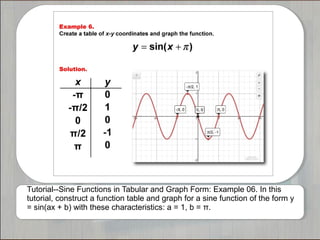
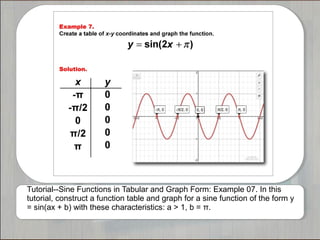
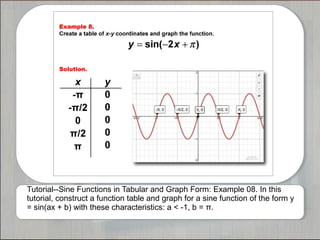


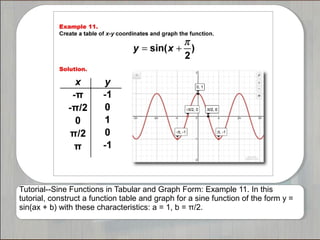

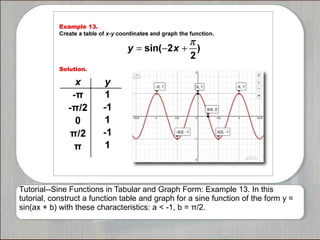
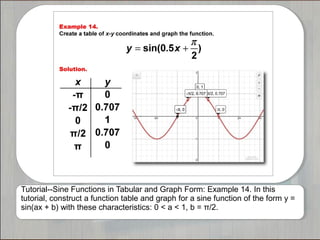
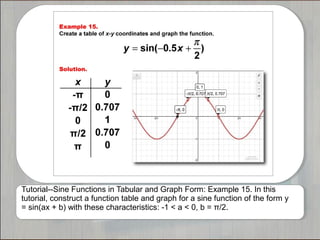
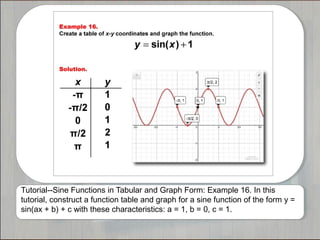
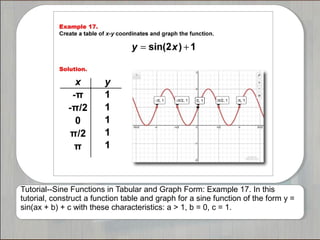

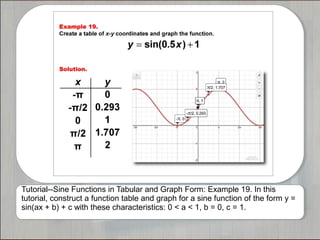
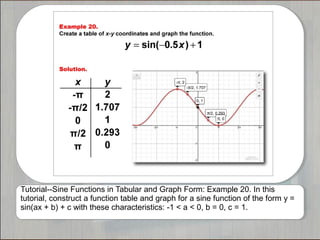
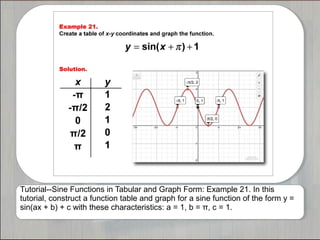
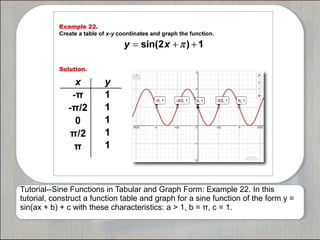

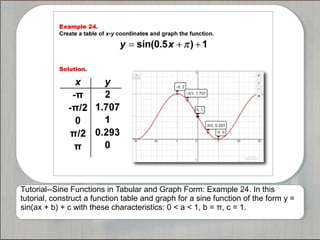
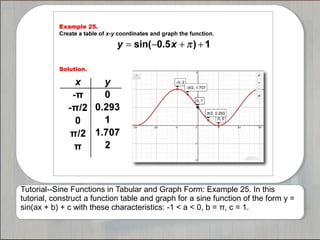

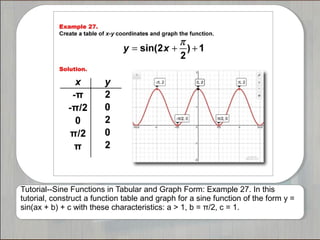


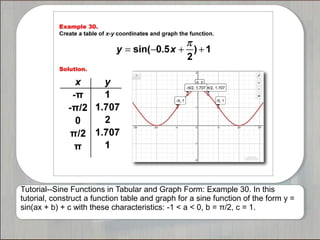
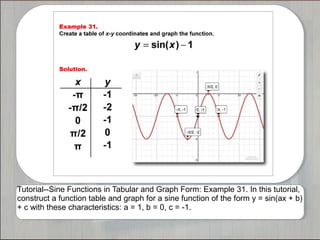
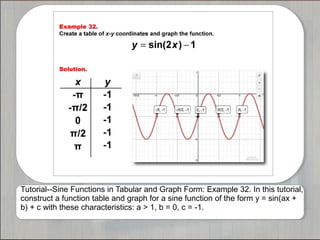

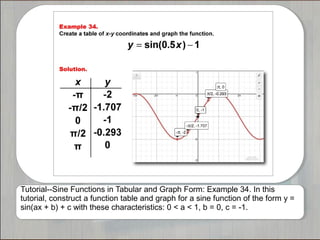
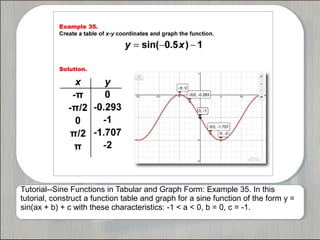
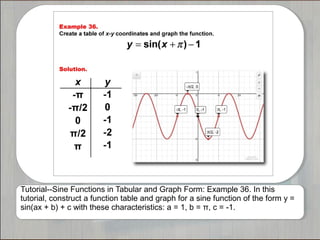


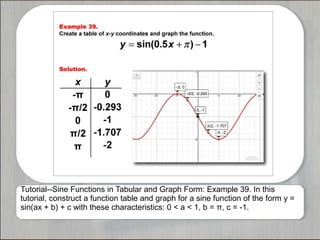
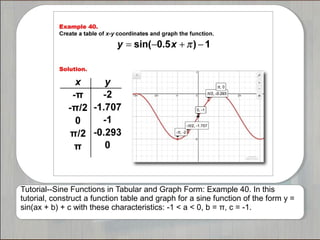


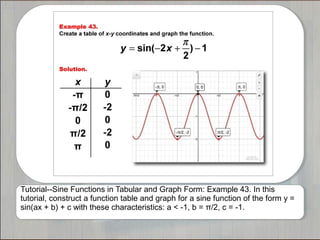

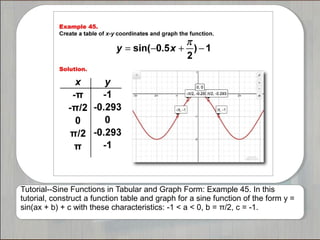


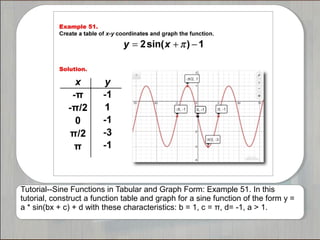

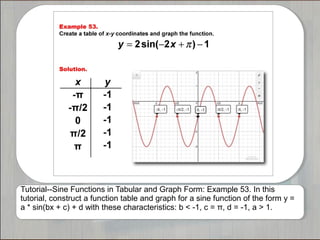
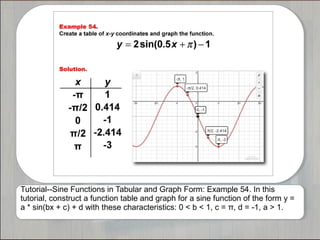

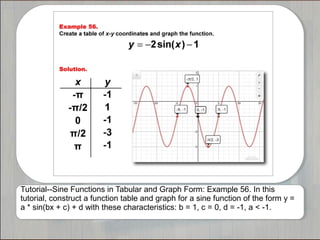

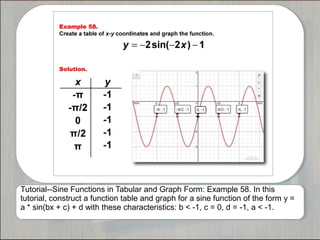
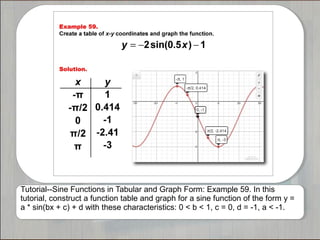


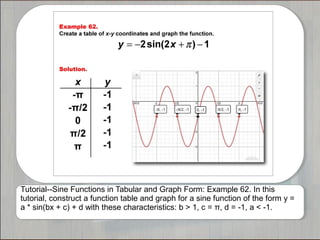

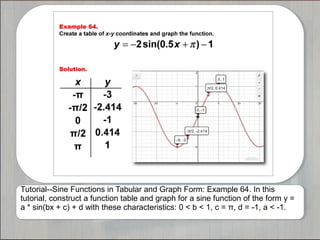


This document describes 65 tutorials that provide examples of constructing tables and graphs for sine functions of the form y = a*sin(bx + c) + d, with varying values for the coefficients a, b, c, and d. Each tutorial works through an example with different coefficient values to demonstrate how to represent sine functions in tabular and graphical form for different periodic behaviors and vertical and horizontal shifts.