Downloaded 366 times
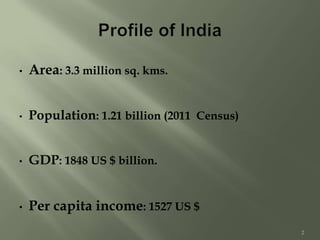
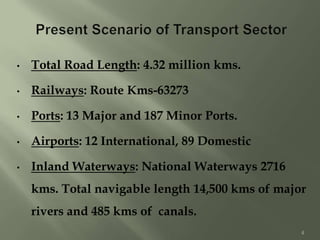
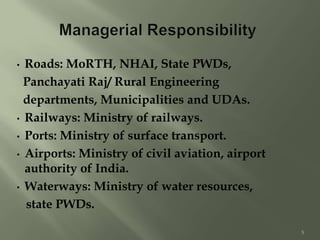
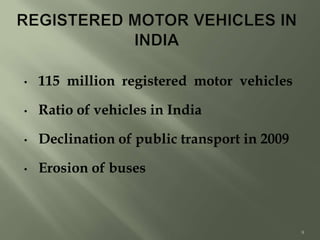
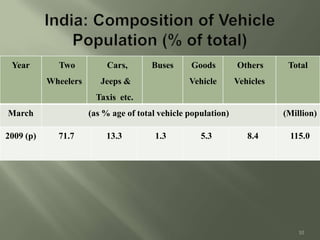


Transportation plays an important role in India's sustained economic growth. India has a total road length of 4.32 million km, 63,273 km of railways, 13 major and 187 minor ports, 12 international and 89 domestic airports, and 2716 km of inland waterways. The major modes of transportation are overseen by different government ministries, with the Planning Commission responsible for coordination. India had approximately 115 million registered motor vehicles as of 2009, with two-wheelers making up over 71% of total vehicles. Public transportation has declined in recent years.