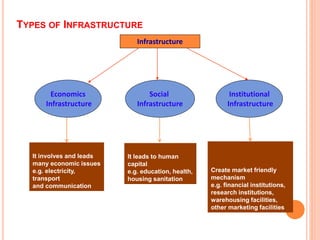
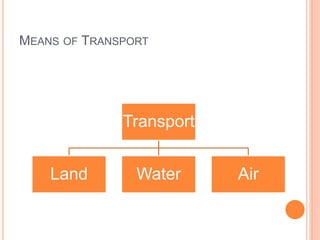
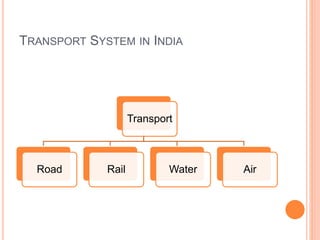
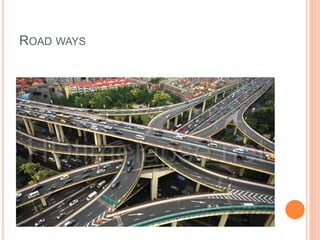
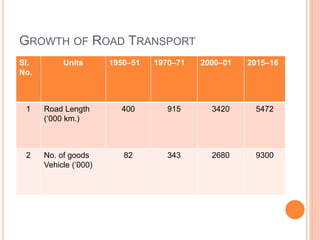
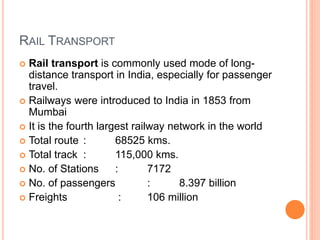
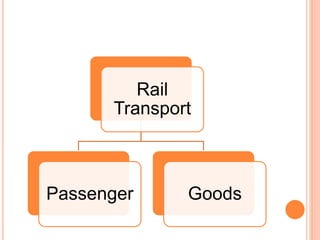
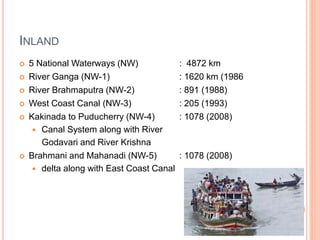
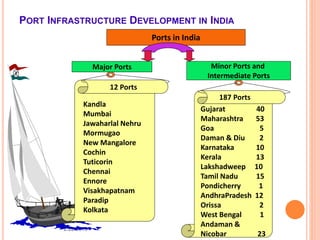
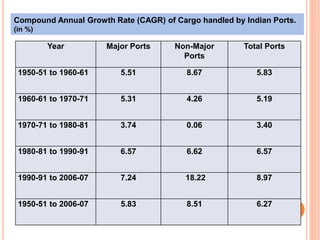
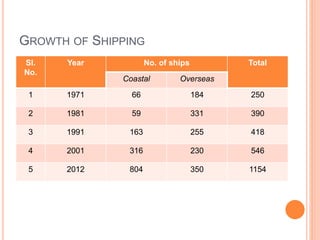
INFRASTRUCTURE IN INDIA
M. SABESH MANIKANDAN
Assistant Professor of Economics
Ayya Nadar Janaki Ammal College
Sivakasi
INFRASTRUCTURE
 the installations that form the basis for any
operation or system
 the word infrastructure has been used in English
since 1887 and in French since 1875
 the word was imported from French, where it
means subgrade,
 In latin
 prefix "infra", meaning "below", and "structure".
ECONOMICS
 In Keyenesian economics, the
word infrastructure was exclusively used to
describe public assets that facilitate production, but
not private assets of the same purpose.
 In post-Keynesian times, however, the word has
grown in popularity. It has been applied with
increasing generality to suggest the internal
framework discernible in any technology system or
business organisation.
TYPES OF INFRASTRUCTURE
Infrastructure
Economics
Infrastructure
Social
Infrastructure
Institutional
Infrastructure
It involves and leads
many economic issues
e.g. electricity,
transport
and communication
It leads to human
capital
e.g. education, health,
housing sanitation
Create market friendly
mechanism
e.g. financial institutions,
research institutions,
warehousing facilities,
other marketing facilities
MEANS OF TRANSPORT
Transport
Land Water Air
TRANSPORT SYSTEM IN INDIA
Transport
Road Rail Water Air
ROAD WAYS
ROAD WAYS
 India has 5,472,144 kilometres (as on 31 March
2015)
 The second largest in the world.
 India has less than 3.8 kilometres of roads per 1000
people, including all its paved and unpaved roads.
 In 4 or more lane highways, India has less than
0.07 kilometres of highways per 1000 people
(2010).
LENGTH OF ROADS
Road
classification
Authority responsible Length (km) % of
network
length
National Highway Ministry of Road Transport and Highways 97,991 1.79
State Highway Public Works Department of State/Union 167,109 3.05
Other PWD Public Works Department of State/Union 1,101,178 20.12
Rural roads Panchayats, JRY and PMGSY 3,337,255 61
Urban roads Local governments and municipalities 467,106 8.54
Project roads Various State/Union territory government
departments, and SAIL, NMDC and BRO
301,505 5.50
Total 5,472,144 100
EXPRESS WAY
 Total length : 1208kms.
 Major Express Way
 Agra-Lucknow Expressway : 302 km
 Uttar PradeshYamuna Expressway :165 km
 Uttar PradeshHyderabad Telangana :158 km
NATIONAL HIGHWAY
Lanes Length (in Km) %
Double lane 36031 51%
Single Lane /
Intermediate lane
18,350 26%
Four Lane/Six
lane/Eight Lane
16,553 23%
Total 70934 100
NATIONAL HIGHWAY (4 LANE)
 North–South and East-West : 6,310 kms.
 Golden Quadrilateral Highway: 5,846 kms.
 Inter – Capital : 4,553 kms.
 Bypass and Other
National Highways : 961 kms.
 Port Connectivity : 353 kms.
STATE HIGHWAY
 Total length : 37712 km
 Major State
 Andhra Pradesh : 10,518 (single: 2,092; intermediate :1,001;
Double: 6,902; multi: 236)
 Rajasthan : 11,716
 Gujarat : 19,761
 Karnataka : 20,738
 Tamil Nadu : 26,985 (single: 1,743; intermediate: 6,586;
double: 15,267, multi: 3,389)
 Maharashtra : 33,705
RURAL ROADS
 Total length : 3.1 million
PROBLEMS OF ROAD TRANSPORT
 Faulty Planning of Transport System
 Lack of Rail Road Co-ordination
 Worn out and Obsolete Assets
 Improved technology
GROWTH OF ROAD TRANSPORT
Sl.
No.
Units 1950–51 1970–71 2000–01 2015–16
1 Road Length
(‘000 km.)
400 915 3420 5472
2 No. of goods
Vehicle (‘000)
82 343 2680 9300
RAIL TRANSPORT
RAIL TRANSPORT
 Rail transport is commonly used mode of long-
distance transport in India, especially for passenger
travel.
 Railways were introduced to India in 1853 from
Mumbai
 It is the fourth largest railway network in the world
 Total route : 68525 kms.
 Total track : 115,000 kms.
 No. of Stations : 7172
 No. of passengers : 8.397 billion
 Freights : 106 million
Rail
Transport
Passenger Goods
MODE OF RAILWAYS
Trams
Sub-urban
Metro
Mono
Toy
Luxury
Goods
TRAMS
 Tramways are known
as streetcar, trolley or
trolley car.
 Tramway is operate in
Calcutta, the only
operating tram network
in India
 the oldest operating
electric tram in Asia.
SUB-URBAN
 Railway system
consists of rapid transit
on exclusive inner
suburban railway lines.
 India –
 Mumbai Suburban
 Chennai Suburban and
 Kolkata Suburban.
METRO
 Metro Rail are known
as Rapid transit
consists of bus.
 the first rapid transit
system in India was the
Kolkata Metro and
 Delhi Metro was India’s
first modern metro and
MONO RAIL
 a single rail track
typically elevated also
called an elevated
railway system.
 Mumbai Monorail is
part of a major
expansion of public
transport in the city and
the first monorail in
India
TOY TRAINS
 The Toy Trains or Hill
Trains of Mountain
Railways of India.
 Darjeeling Himalayan
 Nilgiri Mountain
 Kalka–Shimla
 Kangra Valley and
 Matheran Hill
PASSENGER
 Local
 Intercity
 Express
 Super Fast
 Mail
 Semi-High speed
GOODS
INDIAN RAILWAYS (2008-09)
Particulars BG
(1676mm)
MG (1000
mm)
NG
(762/610)
Total
Route 52808
(82.5 %)
8473
(13.2 %)
2734
(4.3 %)
64015
(100
%)
No. of
Passenger
Trains
10106 431 136 10673
Route Electrification 30 per cent
AIR WAYS
AIRWAYS IN INDIA
Particulars Numbers
Airports 127
International Airports 13
Customs Airports 7
Civil Enclaves 28
Domestic Airports 80
JV Airports 2
Passenger traffic annual growth of
domestic
1999-00 6.90 %
2005-06 27.90 %
Passenger traffic annual growth of
International
1999-00 2.90 %
2005-06 15.45 %
• Airports with Customs Checking and Clearance
Facilities handling international flights but not
elevated to International Airport status.
Customs
• Indian Armed Forces Handled AirportDefence
• Handles domestic flightsDomestic
• Proposed or Under ConstructionFuture
• Handles International FlightsInternational
• Private airport for specific purposesPrivate
PASSENGER
 All operational airports
handled a total of 223.6
million passengers in 2015
– 16.
 Domestic : 168.9 mn
 International : 54.7 mn
 The total number of aircraft
movements amounted to
1.79 million
 the fifth largest civil aviation
market in the world (behind
the USA, China, Japan and
the UK) based on the 254
million passengers handled
at all the airports.
CARGO
 The total number of air
freight movements
reached 2.53 million
tons during 2015-16.
DOMESTIC
 In 2016,
 998.88 lakh passenger
travelled as against
810.91 lakh during the
2015
 registering a growth of
23.18%
INTERNATIONAL
 There are 88 scheduled
international carriers
 5 Indian carriers and
 83 Foreign carriers
 India has air connectivity
with 55 countries through
more than 300 routes.
 All operational airports
handled a total of 54.7
million international
passengers during 2015-
16.
MARKET SHARE (%) OF INTERNATIONAL
PASSENGERS CARRIED
Year Foreign Carriers Indian Carriers
2004-05 71.1 28.9
2009-10 65.5 34.5
2010-11 63.8 36.2
2011-12 64.1 35.9
2012-13 66.2 33.8
2013-14 61.7 38.3
2014-15 63.0 37.0
2015-16 63.4 36.6
PROPORTION OF INTERNATIONAL CARGO
CARRIED
Year Indian Carriers Foreign Carriers
2004-05 13.6 86.4
2009-10 16.1 83.9
2010-11 20.3 79.7
2011-12 21.1 78.9
2012-13 17.7 82.3
2013-14 18.3 81.7
2014-15 17.8 82.2
2015-16 16.9 83.1
WATER TRANSPORT
INLAND
 5 National Waterways (NW) : 4872 km
 River Ganga (NW-1) : 1620 km (1986
 River Brahmaputra (NW-2) : 891 (1988)
 West Coast Canal (NW-3) : 205 (1993)
 Kakinada to Puducherry (NW-4) : 1078 (2008)
 Canal System along with River
Godavari and River Krishna
 Brahmani and Mahanadi (NW-5) : 1078 (2008)
 delta along with East Coast Canal
PASSENGER
CARGO
2/22/2019
PORT INFRASTRUCTURE DEVELOPMENT IN INDIA
Ports in India
Major Ports Minor Ports and
Intermediate Ports
Kandla
Mumbai
Jawaharlal Nehru
Mormugao
New Mangalore
Cochin
Tuticorin
Chennai
Ennore
Visakhapatnam
Paradip
Kolkata
12 Ports
187 Ports
Gujarat 40
Maharashtra 53
Goa 5
Daman & Diu 2
Karnataka 10
Kerala 13
Lakshadweep 10
Tamil Nadu 15
Pondicherry 1
AndhraPradesh 12
Orissa 2
West Bengal 1
Andaman &
Nicobar 23
Year Major Ports Non-Major
Ports
Total Ports
1950-51 to 1960-61 5.51 8.67 5.83
1960-61 to 1970-71 5.31 4.26 5.19
1970-71 to 1980-81 3.74 0.06 3.40
1980-81 to 1990-91 6.57 6.62 6.57
1990-91 to 2006-07 7.24 18.22 8.97
1950-51 to 2006-07 5.83 8.51 6.27
Compound Annual Growth Rate (CAGR) of Cargo handled by Indian Ports.
(in %)
GROWTH OF SHIPPING
Sl.
No.
Year No. of ships Total
Coastal Overseas
1 1971 66 184 250
2 1981 59 331 390
3 1991 163 255 418
4 2001 316 230 546
5 2012 804 350 1154
GROWTH OF SHIPPING
Sl.
No.
Year Shipping Total
Coastal Overseas
1 1971 0.23 2.21 2.44
2 1981 0.25 5.49 5.74
3 1991 0.52 5.52 6.04
4 2001 0.70 6.12 6.82
5 2012 1.09 9.33 10.42
PROBLEMS OF PORT
 Old infrastructure
 Limited water depth
 Inefficient of cargo handling system
 Poor hinterland connectivity
 High traffic
 Poor quality of services
 Over staffing
 Lack of capacity
 Lack of extension possibilities
PROBLEMS OF SEA WAYS
 Overcapacity
 Freight rates
 High fuel prices
 Piracy
 Labour shortages
 Locally
INLAND WATER TRANSPORT
 In India, 14,500 km of river channels are navigable,
of which 3,700 km are usable by mechanised
boats.
 But actually, only 2000 km are used. Of the total
canal length of 4,300 km in India, 900 km is
navigable, but only 330 km is used.
PROBLEMS OF INLAND WATERWAYS
 There is a seasonal fall in water level in rivers especially
in the Rain-fed Rivers of the peninsula which become
nearly dry during summer.
 Reduced flow due to diversion of water for irrigation, for
instance, in the Ganga which makes it difficult even for
steamers to ply.
 There is reduced navigability due to siltation, as in the
Bhagirathi-Hooghly and in the Buckingham Canal.
 There are problems in smooth navigation because of
waterfalls and cataracts, as in Narmada and Tapti.
 Salinity, especially in the coastal stretches, affects
navigation.

E2 a02 unit_iv_infrastructure(1)

  • 1.
    INFRASTRUCTURE IN INDIA M.SABESH MANIKANDAN Assistant Professor of Economics Ayya Nadar Janaki Ammal College Sivakasi
  • 2.
    INFRASTRUCTURE  the installationsthat form the basis for any operation or system  the word infrastructure has been used in English since 1887 and in French since 1875  the word was imported from French, where it means subgrade,  In latin  prefix "infra", meaning "below", and "structure".
  • 3.
    ECONOMICS  In Keyenesianeconomics, the word infrastructure was exclusively used to describe public assets that facilitate production, but not private assets of the same purpose.  In post-Keynesian times, however, the word has grown in popularity. It has been applied with increasing generality to suggest the internal framework discernible in any technology system or business organisation.
  • 4.
    TYPES OF INFRASTRUCTURE Infrastructure Economics Infrastructure Social Infrastructure Institutional Infrastructure Itinvolves and leads many economic issues e.g. electricity, transport and communication It leads to human capital e.g. education, health, housing sanitation Create market friendly mechanism e.g. financial institutions, research institutions, warehousing facilities, other marketing facilities
  • 5.
  • 6.
    TRANSPORT SYSTEM ININDIA Transport Road Rail Water Air
  • 7.
  • 8.
    ROAD WAYS  Indiahas 5,472,144 kilometres (as on 31 March 2015)  The second largest in the world.  India has less than 3.8 kilometres of roads per 1000 people, including all its paved and unpaved roads.  In 4 or more lane highways, India has less than 0.07 kilometres of highways per 1000 people (2010).
  • 9.
    LENGTH OF ROADS Road classification Authorityresponsible Length (km) % of network length National Highway Ministry of Road Transport and Highways 97,991 1.79 State Highway Public Works Department of State/Union 167,109 3.05 Other PWD Public Works Department of State/Union 1,101,178 20.12 Rural roads Panchayats, JRY and PMGSY 3,337,255 61 Urban roads Local governments and municipalities 467,106 8.54 Project roads Various State/Union territory government departments, and SAIL, NMDC and BRO 301,505 5.50 Total 5,472,144 100
  • 10.
    EXPRESS WAY  Totallength : 1208kms.  Major Express Way  Agra-Lucknow Expressway : 302 km  Uttar PradeshYamuna Expressway :165 km  Uttar PradeshHyderabad Telangana :158 km
  • 11.
    NATIONAL HIGHWAY Lanes Length(in Km) % Double lane 36031 51% Single Lane / Intermediate lane 18,350 26% Four Lane/Six lane/Eight Lane 16,553 23% Total 70934 100
  • 12.
    NATIONAL HIGHWAY (4LANE)  North–South and East-West : 6,310 kms.  Golden Quadrilateral Highway: 5,846 kms.  Inter – Capital : 4,553 kms.  Bypass and Other National Highways : 961 kms.  Port Connectivity : 353 kms.
  • 13.
    STATE HIGHWAY  Totallength : 37712 km  Major State  Andhra Pradesh : 10,518 (single: 2,092; intermediate :1,001; Double: 6,902; multi: 236)  Rajasthan : 11,716  Gujarat : 19,761  Karnataka : 20,738  Tamil Nadu : 26,985 (single: 1,743; intermediate: 6,586; double: 15,267, multi: 3,389)  Maharashtra : 33,705
  • 14.
    RURAL ROADS  Totallength : 3.1 million
  • 15.
    PROBLEMS OF ROADTRANSPORT  Faulty Planning of Transport System  Lack of Rail Road Co-ordination  Worn out and Obsolete Assets  Improved technology
  • 16.
    GROWTH OF ROADTRANSPORT Sl. No. Units 1950–51 1970–71 2000–01 2015–16 1 Road Length (‘000 km.) 400 915 3420 5472 2 No. of goods Vehicle (‘000) 82 343 2680 9300
  • 17.
  • 18.
    RAIL TRANSPORT  Railtransport is commonly used mode of long- distance transport in India, especially for passenger travel.  Railways were introduced to India in 1853 from Mumbai  It is the fourth largest railway network in the world  Total route : 68525 kms.  Total track : 115,000 kms.  No. of Stations : 7172  No. of passengers : 8.397 billion  Freights : 106 million
  • 19.
  • 20.
  • 21.
    TRAMS  Tramways areknown as streetcar, trolley or trolley car.  Tramway is operate in Calcutta, the only operating tram network in India  the oldest operating electric tram in Asia.
  • 22.
    SUB-URBAN  Railway system consistsof rapid transit on exclusive inner suburban railway lines.  India –  Mumbai Suburban  Chennai Suburban and  Kolkata Suburban.
  • 23.
    METRO  Metro Railare known as Rapid transit consists of bus.  the first rapid transit system in India was the Kolkata Metro and  Delhi Metro was India’s first modern metro and
  • 24.
    MONO RAIL  asingle rail track typically elevated also called an elevated railway system.  Mumbai Monorail is part of a major expansion of public transport in the city and the first monorail in India
  • 25.
    TOY TRAINS  TheToy Trains or Hill Trains of Mountain Railways of India.  Darjeeling Himalayan  Nilgiri Mountain  Kalka–Shimla  Kangra Valley and  Matheran Hill
  • 26.
    PASSENGER  Local  Intercity Express  Super Fast  Mail  Semi-High speed
  • 27.
  • 28.
    INDIAN RAILWAYS (2008-09) ParticularsBG (1676mm) MG (1000 mm) NG (762/610) Total Route 52808 (82.5 %) 8473 (13.2 %) 2734 (4.3 %) 64015 (100 %) No. of Passenger Trains 10106 431 136 10673 Route Electrification 30 per cent
  • 29.
  • 30.
    AIRWAYS IN INDIA ParticularsNumbers Airports 127 International Airports 13 Customs Airports 7 Civil Enclaves 28 Domestic Airports 80 JV Airports 2 Passenger traffic annual growth of domestic 1999-00 6.90 % 2005-06 27.90 % Passenger traffic annual growth of International 1999-00 2.90 % 2005-06 15.45 %
  • 31.
    • Airports withCustoms Checking and Clearance Facilities handling international flights but not elevated to International Airport status. Customs • Indian Armed Forces Handled AirportDefence • Handles domestic flightsDomestic • Proposed or Under ConstructionFuture • Handles International FlightsInternational • Private airport for specific purposesPrivate
  • 32.
    PASSENGER  All operationalairports handled a total of 223.6 million passengers in 2015 – 16.  Domestic : 168.9 mn  International : 54.7 mn  The total number of aircraft movements amounted to 1.79 million  the fifth largest civil aviation market in the world (behind the USA, China, Japan and the UK) based on the 254 million passengers handled at all the airports.
  • 33.
    CARGO  The totalnumber of air freight movements reached 2.53 million tons during 2015-16.
  • 34.
    DOMESTIC  In 2016, 998.88 lakh passenger travelled as against 810.91 lakh during the 2015  registering a growth of 23.18%
  • 35.
    INTERNATIONAL  There are88 scheduled international carriers  5 Indian carriers and  83 Foreign carriers  India has air connectivity with 55 countries through more than 300 routes.  All operational airports handled a total of 54.7 million international passengers during 2015- 16.
  • 36.
    MARKET SHARE (%)OF INTERNATIONAL PASSENGERS CARRIED Year Foreign Carriers Indian Carriers 2004-05 71.1 28.9 2009-10 65.5 34.5 2010-11 63.8 36.2 2011-12 64.1 35.9 2012-13 66.2 33.8 2013-14 61.7 38.3 2014-15 63.0 37.0 2015-16 63.4 36.6
  • 37.
    PROPORTION OF INTERNATIONALCARGO CARRIED Year Indian Carriers Foreign Carriers 2004-05 13.6 86.4 2009-10 16.1 83.9 2010-11 20.3 79.7 2011-12 21.1 78.9 2012-13 17.7 82.3 2013-14 18.3 81.7 2014-15 17.8 82.2 2015-16 16.9 83.1
  • 38.
  • 39.
    INLAND  5 NationalWaterways (NW) : 4872 km  River Ganga (NW-1) : 1620 km (1986  River Brahmaputra (NW-2) : 891 (1988)  West Coast Canal (NW-3) : 205 (1993)  Kakinada to Puducherry (NW-4) : 1078 (2008)  Canal System along with River Godavari and River Krishna  Brahmani and Mahanadi (NW-5) : 1078 (2008)  delta along with East Coast Canal
  • 40.
  • 41.
  • 42.
    2/22/2019 PORT INFRASTRUCTURE DEVELOPMENTIN INDIA Ports in India Major Ports Minor Ports and Intermediate Ports Kandla Mumbai Jawaharlal Nehru Mormugao New Mangalore Cochin Tuticorin Chennai Ennore Visakhapatnam Paradip Kolkata 12 Ports 187 Ports Gujarat 40 Maharashtra 53 Goa 5 Daman & Diu 2 Karnataka 10 Kerala 13 Lakshadweep 10 Tamil Nadu 15 Pondicherry 1 AndhraPradesh 12 Orissa 2 West Bengal 1 Andaman & Nicobar 23
  • 43.
    Year Major PortsNon-Major Ports Total Ports 1950-51 to 1960-61 5.51 8.67 5.83 1960-61 to 1970-71 5.31 4.26 5.19 1970-71 to 1980-81 3.74 0.06 3.40 1980-81 to 1990-91 6.57 6.62 6.57 1990-91 to 2006-07 7.24 18.22 8.97 1950-51 to 2006-07 5.83 8.51 6.27 Compound Annual Growth Rate (CAGR) of Cargo handled by Indian Ports. (in %)
  • 44.
    GROWTH OF SHIPPING Sl. No. YearNo. of ships Total Coastal Overseas 1 1971 66 184 250 2 1981 59 331 390 3 1991 163 255 418 4 2001 316 230 546 5 2012 804 350 1154
  • 45.
    GROWTH OF SHIPPING Sl. No. YearShipping Total Coastal Overseas 1 1971 0.23 2.21 2.44 2 1981 0.25 5.49 5.74 3 1991 0.52 5.52 6.04 4 2001 0.70 6.12 6.82 5 2012 1.09 9.33 10.42
  • 46.
    PROBLEMS OF PORT Old infrastructure  Limited water depth  Inefficient of cargo handling system  Poor hinterland connectivity  High traffic  Poor quality of services  Over staffing  Lack of capacity  Lack of extension possibilities
  • 47.
    PROBLEMS OF SEAWAYS  Overcapacity  Freight rates  High fuel prices  Piracy  Labour shortages  Locally
  • 48.
    INLAND WATER TRANSPORT In India, 14,500 km of river channels are navigable, of which 3,700 km are usable by mechanised boats.  But actually, only 2000 km are used. Of the total canal length of 4,300 km in India, 900 km is navigable, but only 330 km is used.
  • 49.
    PROBLEMS OF INLANDWATERWAYS  There is a seasonal fall in water level in rivers especially in the Rain-fed Rivers of the peninsula which become nearly dry during summer.  Reduced flow due to diversion of water for irrigation, for instance, in the Ganga which makes it difficult even for steamers to ply.  There is reduced navigability due to siltation, as in the Bhagirathi-Hooghly and in the Buckingham Canal.  There are problems in smooth navigation because of waterfalls and cataracts, as in Narmada and Tapti.  Salinity, especially in the coastal stretches, affects navigation.