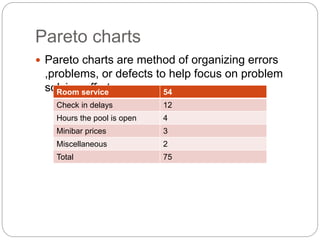
Total Quality Management
Definition
 TQM refers to a quality emphasis that
encompasses the entire organization, from
supplier to customer.
TQM in services
 The personal component of services is more difficult
to measure than the quality of tangible component.
 Operations manager plays a significant role in
addressing several major aspects of service
quality.
1. The tangible component of services
2. The process
3. Customer expectations
4. Exceptions
 Tools for the statistical quality control
1. Check sheets
2. Scatter diagrams
3. Cause and Effect diagrams
4. Pareto charts
5. Flow charts
6. Histograms
7. Control charts
Check sheets
A check sheet is a kind of form that is designed for recording data
Scatter diagrams
 Scatter diagrams shows relationship between the
two measurements
Cause and effect diagram
 It is another tool for identifying quality issues and
inspection points .
 It is also known as Ishikawa diagram or a fish
bone chart.
Pareto charts
 Pareto charts are method of organizing errors
,problems, or defects to help focus on problem
solving efforts.Room service 54
Check in delays 12
Hours the pool is open 4
Minibar prices 3
Miscellaneous 2
Total 75
Solution
Flow charts / Process diagrams
Histograms
 Histograms shows the range of values of
measurement and the frequency with which each
value occurs.
Control charts
 Control charts are graphic representation of data
over time that show lower limits for the process
we want to control as shown in the figure.

Tqm tools and techniques

  • 1.
  • 2.
    Definition  TQM refersto a quality emphasis that encompasses the entire organization, from supplier to customer.
  • 3.
    TQM in services The personal component of services is more difficult to measure than the quality of tangible component.
  • 4.
     Operations managerplays a significant role in addressing several major aspects of service quality. 1. The tangible component of services 2. The process 3. Customer expectations 4. Exceptions
  • 5.
     Tools forthe statistical quality control 1. Check sheets 2. Scatter diagrams 3. Cause and Effect diagrams 4. Pareto charts 5. Flow charts 6. Histograms 7. Control charts
  • 6.
    Check sheets A checksheet is a kind of form that is designed for recording data
  • 7.
    Scatter diagrams  Scatterdiagrams shows relationship between the two measurements
  • 8.
    Cause and effectdiagram  It is another tool for identifying quality issues and inspection points .  It is also known as Ishikawa diagram or a fish bone chart.
  • 9.
    Pareto charts  Paretocharts are method of organizing errors ,problems, or defects to help focus on problem solving efforts.Room service 54 Check in delays 12 Hours the pool is open 4 Minibar prices 3 Miscellaneous 2 Total 75
  • 10.
  • 11.
    Flow charts /Process diagrams
  • 12.
    Histograms  Histograms showsthe range of values of measurement and the frequency with which each value occurs.
  • 13.
    Control charts  Controlcharts are graphic representation of data over time that show lower limits for the process we want to control as shown in the figure.