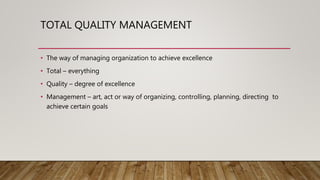
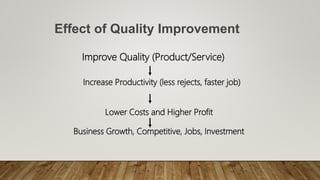
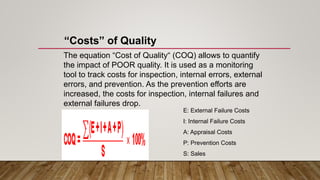
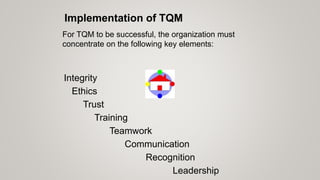
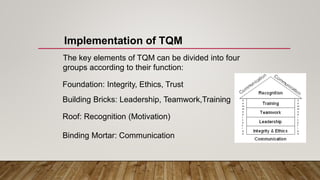
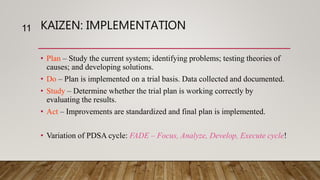
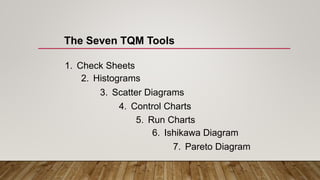
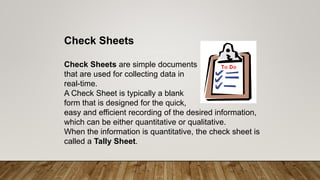
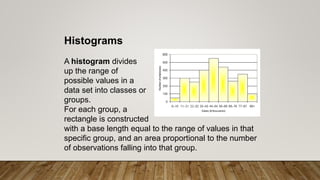
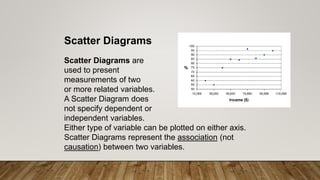
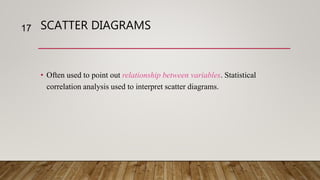
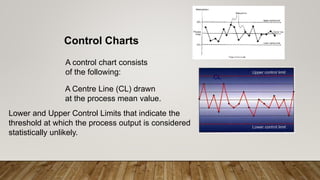
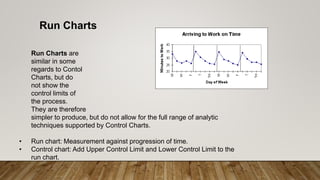
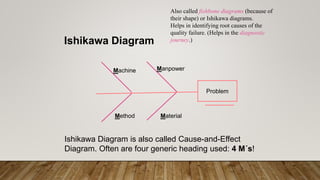
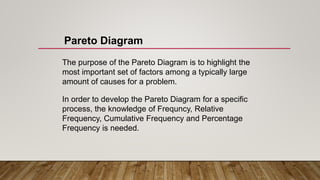
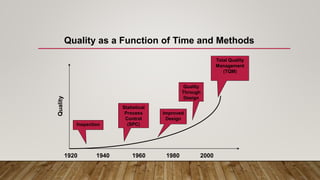
TOTAL QUALITY
MANAGEMENT
MUHAMMAD ADNAN 15103122-014
TALHA MUKHTAR 15103122-007
TOTAL QUALITY MANAGEMENT
• The way of managing organization to achieve excellence
• Total – everything
• Quality – degree of excellence
• Management – art, act or way of organizing, controlling, planning, directing to
achieve certain goals
Improve Quality (Product/Service)
Increase Productivity (less rejects, faster job)
Lower Costs and Higher Profit
Business Growth, Competitive, Jobs, Investment
Effect of Quality Improvement
THE COST OF QUALITY (JURAN’S MODEL)
Cost Category
Cost of prevention Costs associated with the development of
programs to prevent defectives from
occurring in the first place
Cost of detection/
appraisal
Costs associated with the test and
inspection of subassemblies and products
after they have been made.
Cost of failure Costs associated with the failure of a
defective product.
Internal failure costs—producing
defective products that are identified
before shipment.
External failure costs—producing
defective products that are delivered to
the customer.
The equation “Cost of Quality“ (COQ) allows to quantify
the impact of POOR quality. It is used as a monitoring
tool to track costs for inspection, internal errors, external
errors, and prevention. As the prevention efforts are
increased, the costs for inspection, internal failures and
external failures drop.
“Costs” of Quality
E: External Failure Costs
I: Internal Failure Costs
A: Appraisal Costs
P: Prevention Costs
S: Sales
MANUFACTURING QUALITY VS. SERVICE QUALITY
• Manufacturing quality focuses on tangible product features
• Conformance, performance, reliability, features
• Service organizations produce intangible products that must be experienced
• Quality often defined by perceptional factors like courtesy, friendliness, promptness,
waiting time, consistency
6
ELEMENTS OF TQM
• Leadership
• Top management vision, planning and support
• Employee involvement
• All employees assume responsibility for inspecting the quality of their work.
• Product/Process Excellence
• Involves product design quality and monitoring the process for continuous
improvement.
• Poka-yokes are devices that prevent defects from being produced.
ELEMENTS OF TQM (CONT’D)
• Continuous Improvement
• A concept that recognizes that quality improvement is a journey with no end
and that there is a need for continually looking for new approaches for
improving quality.
• Customer Focus (on “Fitness for Use”)
• Design quality
• Specific characteristics of a product that determine its value in the marketplace.
• Conformance quality
• The degree to which a product meets its design specifications.
Communication
For TQM to be successful, the organization must
concentrate on the following key elements:
Ethics
Integrity
Trust
Training
Teamwork
Leadership
Recognition
Implementation of TQM
Roof: Recognition (Motivation)
The key elements of TQM can be divided into four
groups according to their function:
Foundation: Integrity, Ethics, Trust
Building Bricks: Leadership, Teamwork,Training
Binding Mortar: Communication
Implementation of TQM
KAIZEN: IMPLEMENTATION
• Plan – Study the current system; identifying problems; testing theories of
causes; and developing solutions.
• Do – Plan is implemented on a trial basis. Data collected and documented.
• Study – Determine whether the trial plan is working correctly by
evaluating the results.
• Act – Improvements are standardized and final plan is implemented.
• Variation of PDSA cycle: FADE – Focus, Analyze, Develop, Execute cycle!
11
TALHA MUKHTAR 15103122-007
2. Histograms
1. Check Sheets
4. Control Charts
5. Run Charts
3. Scatter Diagrams
6. Ishikawa Diagram
7. Pareto Diagram
The Seven TQM Tools
Check Sheets are simple documents
that are used for collecting data in
real-time.
A Check Sheet is typically a blank
form that is designed for the quick,
easy and efficient recording of the desired information,
which can be either quantitative or qualitative.
When the information is quantitative, the check sheet is
called a Tally Sheet.
Check Sheets
A histogram divides
up the range of
possible values in a
data set into classes or
groups.
For each group, a
rectangle is constructed
with a base length equal to the range of values in that
specific group, and an area proportional to the number
of observations falling into that group.
Histograms
Scatter Diagrams are
used to present
measurements of two
or more related variables.
A Scatter Diagram does
not specify dependent or
independent variables.
Either type of variable can be plotted on either axis.
Scatter Diagrams represent the association (not
causation) between two variables.
Scatter Diagrams
SCATTER DIAGRAMS
• Often used to point out relationship between variables. Statistical
correlation analysis used to interpret scatter diagrams.
17
A control chart consists
of the following:
A Centre Line (CL) drawn
at the process mean value.
Lower and Upper Control Limits that indicate the
threshold at which the process output is considered
statistically unlikely.
Control Charts
CL
Run Charts are
similar in some
regards to Contol
Charts, but do
not show the
control limits of
the process.
They are therefore
simpler to produce, but do not allow for the full range of analytic
techniques supported by Control Charts.
• Run chart: Measurement against progression of time.
• Control chart: Add Upper Control Limit and Lower Control Limit to the
run chart.
Run Charts
Machine Manpower
Method Material
Problem
Ishikawa Diagram is also called Cause-and-Effect
Diagram. Often are four generic heading used: 4 M´s!
Ishikawa Diagram
Also called fishbone diagrams (because of
their shape) or Ishikawa diagrams.
Helps in identifying root causes of the
quality failure. (Helps in the diagnostic
journey.)
The purpose of the Pareto Diagram is to highlight the
most important set of factors among a typically large
amount of causes for a problem.
In order to develop the Pareto Diagram for a specific
process, the knowledge of Frequncy, Relative
Frequency, Cumulative Frequency and Percentage
Frequency is needed.
Pareto Diagram
It can be noted that the 3 defects of out-of-dimension,
poor surface finish and loose joints account for 75% of
the rejections.
Pareto Diagram
1920 1940 1960 1980 2000
Quality
Improved
Design
Total Quality
Management
(TQM)
Statistical
Process
Control
(SPC)Inspection
Quality
Through
Design
Quality as a Function of Time and Methods
OTHER TOOLS: FLOW CHARTS
• Process map identifies the sequence of activities or the flow in a process.
• Objectively provides a picture of the steps needed to accomplish a task.
• Helps all employees understand how they fit into the process and who are
their suppliers and customers.
• Can also pinpoint places where quality-related measurements should be
taken.
• Also called process mapping and analysis.
• Very successfully implemented in various organizations. e.g. Motorola
reduced manufacturing time for pagers using flow charts.
24

Total Quality Management in Engineering economics

  • 1.
    TOTAL QUALITY MANAGEMENT MUHAMMAD ADNAN15103122-014 TALHA MUKHTAR 15103122-007
  • 2.
    TOTAL QUALITY MANAGEMENT •The way of managing organization to achieve excellence • Total – everything • Quality – degree of excellence • Management – art, act or way of organizing, controlling, planning, directing to achieve certain goals
  • 3.
    Improve Quality (Product/Service) IncreaseProductivity (less rejects, faster job) Lower Costs and Higher Profit Business Growth, Competitive, Jobs, Investment Effect of Quality Improvement
  • 4.
    THE COST OFQUALITY (JURAN’S MODEL) Cost Category Cost of prevention Costs associated with the development of programs to prevent defectives from occurring in the first place Cost of detection/ appraisal Costs associated with the test and inspection of subassemblies and products after they have been made. Cost of failure Costs associated with the failure of a defective product. Internal failure costs—producing defective products that are identified before shipment. External failure costs—producing defective products that are delivered to the customer.
  • 5.
    The equation “Costof Quality“ (COQ) allows to quantify the impact of POOR quality. It is used as a monitoring tool to track costs for inspection, internal errors, external errors, and prevention. As the prevention efforts are increased, the costs for inspection, internal failures and external failures drop. “Costs” of Quality E: External Failure Costs I: Internal Failure Costs A: Appraisal Costs P: Prevention Costs S: Sales
  • 6.
    MANUFACTURING QUALITY VS.SERVICE QUALITY • Manufacturing quality focuses on tangible product features • Conformance, performance, reliability, features • Service organizations produce intangible products that must be experienced • Quality often defined by perceptional factors like courtesy, friendliness, promptness, waiting time, consistency 6
  • 7.
    ELEMENTS OF TQM •Leadership • Top management vision, planning and support • Employee involvement • All employees assume responsibility for inspecting the quality of their work. • Product/Process Excellence • Involves product design quality and monitoring the process for continuous improvement. • Poka-yokes are devices that prevent defects from being produced.
  • 8.
    ELEMENTS OF TQM(CONT’D) • Continuous Improvement • A concept that recognizes that quality improvement is a journey with no end and that there is a need for continually looking for new approaches for improving quality. • Customer Focus (on “Fitness for Use”) • Design quality • Specific characteristics of a product that determine its value in the marketplace. • Conformance quality • The degree to which a product meets its design specifications.
  • 9.
    Communication For TQM tobe successful, the organization must concentrate on the following key elements: Ethics Integrity Trust Training Teamwork Leadership Recognition Implementation of TQM
  • 10.
    Roof: Recognition (Motivation) Thekey elements of TQM can be divided into four groups according to their function: Foundation: Integrity, Ethics, Trust Building Bricks: Leadership, Teamwork,Training Binding Mortar: Communication Implementation of TQM
  • 11.
    KAIZEN: IMPLEMENTATION • Plan– Study the current system; identifying problems; testing theories of causes; and developing solutions. • Do – Plan is implemented on a trial basis. Data collected and documented. • Study – Determine whether the trial plan is working correctly by evaluating the results. • Act – Improvements are standardized and final plan is implemented. • Variation of PDSA cycle: FADE – Focus, Analyze, Develop, Execute cycle! 11
  • 12.
  • 13.
    2. Histograms 1. CheckSheets 4. Control Charts 5. Run Charts 3. Scatter Diagrams 6. Ishikawa Diagram 7. Pareto Diagram The Seven TQM Tools
  • 14.
    Check Sheets aresimple documents that are used for collecting data in real-time. A Check Sheet is typically a blank form that is designed for the quick, easy and efficient recording of the desired information, which can be either quantitative or qualitative. When the information is quantitative, the check sheet is called a Tally Sheet. Check Sheets
  • 15.
    A histogram divides upthe range of possible values in a data set into classes or groups. For each group, a rectangle is constructed with a base length equal to the range of values in that specific group, and an area proportional to the number of observations falling into that group. Histograms
  • 16.
    Scatter Diagrams are usedto present measurements of two or more related variables. A Scatter Diagram does not specify dependent or independent variables. Either type of variable can be plotted on either axis. Scatter Diagrams represent the association (not causation) between two variables. Scatter Diagrams
  • 17.
    SCATTER DIAGRAMS • Oftenused to point out relationship between variables. Statistical correlation analysis used to interpret scatter diagrams. 17
  • 18.
    A control chartconsists of the following: A Centre Line (CL) drawn at the process mean value. Lower and Upper Control Limits that indicate the threshold at which the process output is considered statistically unlikely. Control Charts CL
  • 19.
    Run Charts are similarin some regards to Contol Charts, but do not show the control limits of the process. They are therefore simpler to produce, but do not allow for the full range of analytic techniques supported by Control Charts. • Run chart: Measurement against progression of time. • Control chart: Add Upper Control Limit and Lower Control Limit to the run chart. Run Charts
  • 20.
    Machine Manpower Method Material Problem IshikawaDiagram is also called Cause-and-Effect Diagram. Often are four generic heading used: 4 M´s! Ishikawa Diagram Also called fishbone diagrams (because of their shape) or Ishikawa diagrams. Helps in identifying root causes of the quality failure. (Helps in the diagnostic journey.)
  • 21.
    The purpose ofthe Pareto Diagram is to highlight the most important set of factors among a typically large amount of causes for a problem. In order to develop the Pareto Diagram for a specific process, the knowledge of Frequncy, Relative Frequency, Cumulative Frequency and Percentage Frequency is needed. Pareto Diagram
  • 22.
    It can benoted that the 3 defects of out-of-dimension, poor surface finish and loose joints account for 75% of the rejections. Pareto Diagram
  • 23.
    1920 1940 19601980 2000 Quality Improved Design Total Quality Management (TQM) Statistical Process Control (SPC)Inspection Quality Through Design Quality as a Function of Time and Methods
  • 24.
    OTHER TOOLS: FLOWCHARTS • Process map identifies the sequence of activities or the flow in a process. • Objectively provides a picture of the steps needed to accomplish a task. • Helps all employees understand how they fit into the process and who are their suppliers and customers. • Can also pinpoint places where quality-related measurements should be taken. • Also called process mapping and analysis. • Very successfully implemented in various organizations. e.g. Motorola reduced manufacturing time for pagers using flow charts. 24