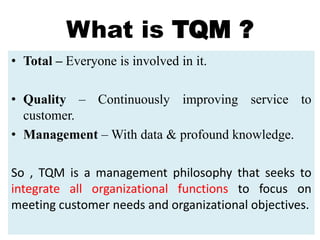
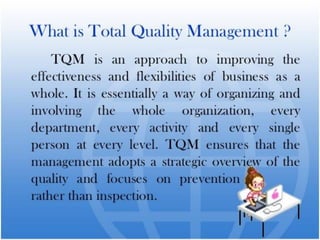
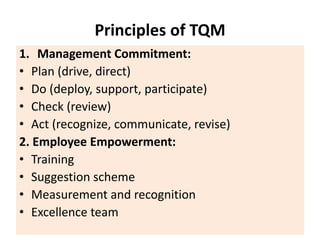
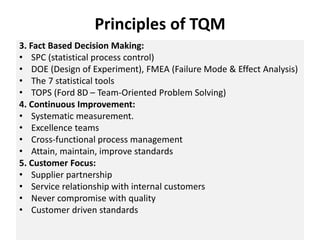
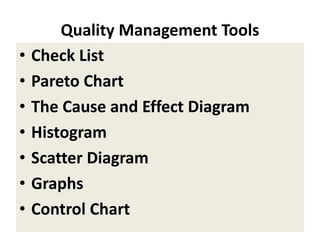
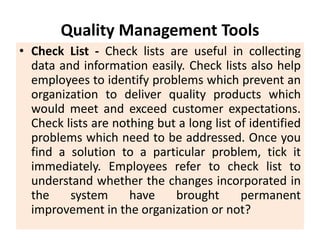
3. What is TQM ?
• Total – Everyone is involved in it.
• Quality – Continuously improving service to
customer.
• Management – With data & profound knowledge.
So , TQM is a management philosophy that seeks to
integrate all organizational functions to focus on
meeting customer needs and organizational objectives.
4.
5.
6. Importance of Total Quality
Management
• Quality management ensures superior quality
products and services.
• Quality management is essential for customer
satisfaction which eventually leads to
customer loyalty.
• Quality Management ensures increased
revenues and higher productivity for the
organization.
• Quality management helps organizations to
reduce waste and inventory.
7. Basic Tenets of TQM
1. The customer makes the ultimate determination of quality.
2. Top management must provide leadership and support for all
quality initiatives.
3. ‘Preventing variability’ is the key to producing high quality.
4. Quality goals are a moving target, thereby requiring a
commitment toward continuous improvement.
5. Improving quality requires the establishment of effective
metrics. We must speak with data and facts not just opinions.
8. Elements of Total Quality
Management
• The success of total quality management depends
on following eight elements which are further
classified into following four groups.
1. Foundation
2. Building Bricks
3. Binding Mortar
4. Roof
• Foundation: Integrity, Ethics, Trust
• Building Bricks: Leadership, Team-work, Training
• Binding Mortar: Communication
• Roof: Recognition (Motivation)
9. Principles of TQM
1. Management Commitment:
• Plan (drive, direct)
• Do (deploy, support, participate)
• Check (review)
• Act (recognize, communicate, revise)
2. Employee Empowerment:
• Training
• Suggestion scheme
• Measurement and recognition
• Excellence team
10. Principles of TQM
3. Fact Based Decision Making:
• SPC (statistical process control)
• DOE (Design of Experiment), FMEA (Failure Mode & Effect Analysis)
• The 7 statistical tools
• TOPS (Ford 8D – Team-Oriented Problem Solving)
4. Continuous Improvement:
• Systematic measurement.
• Excellence teams
• Cross-functional process management
• Attain, maintain, improve standards
5. Customer Focus:
• Supplier partnership
• Service relationship with internal customers
• Never compromise with quality
• Customer driven standards
11. Quality Management Tools
• Check List
• Pareto Chart
• The Cause and Effect Diagram
• Histogram
• Scatter Diagram
• Graphs
• Control Chart
12. Quality Management Tools
• Check List - Check lists are useful in collecting
data and information easily. Check lists also help
employees to identify problems which prevent an
organization to deliver quality products which
would meet and exceed customer expectations.
Check lists are nothing but a long list of identified
problems which need to be addressed. Once you
find a solution to a particular problem, tick it
immediately. Employees refer to check list to
understand whether the changes incorporated in
the system have brought permanent
improvement in the organization or not?
13. Quality Management Tools
• Pareto Chart - The credit for Pareto Chart goes to
Italian Economist - Wilfredo Pareto. Pareto Chart
helps employees to identify the problems,
prioritize them and also determine their
frequency in the system. Pareto Chart is often
represented by both bars and a line graph
identifies the most common causes of problems
and the most frequently occurring defects. Pareto
Chart records the reasons which lead to
maximum customer complaints and eventually
enables employees to formulate relevant
strategies to rectify the most common defects.
14. Quality Management Tools
• The Cause and Effect Diagram - Also referred
to as “Fishbone Chart” (because of its shape
which resembles the side view of a fish
skeleton) and as Ishikawa diagram after its
creator Kaoru Ishikawa, Cause and Effect
Diagram records causes of a particular and
specific problem. The cause and effect
diagram plays a crucial role in identifying the
root cause of a particular problem and also
potential factors which give rise to a common
problem in the workplace.
15. Quality Management Tools
• Histogram - Histogram, introduced by Karl
Pearson, is nothing but a graphical representation
showing intensity of a particular problem.
Histogram helps identify the cause of problems in
the system by the shape as well as width of the
distribution.
• Scatter Diagram - Scatter Diagram is a quality
management tool which helps to analyze the
relationship between two variables. In a scatter
chart, data is represented as points, where each
point denotes a value on the horizontal axis and
vertical axis.
• Scatter Diagram shows many points which show a
relation between two variables.
16. Quality Management Tools
• Graphs - Graphs are the simplest and
most commonly used quality
management tools. Graphs help to
identify whether processes and systems
are as per the expected level or not and
if not, also record the level of deviation
from the standard specifications.
17. Total Quality Management Models
• Deming Application Prize.
• Malcolm Baldrige Criteria for Performance
Excellence.
• European Foundation for Quality
Management.
• ISO quality management standards.