Download to read offline
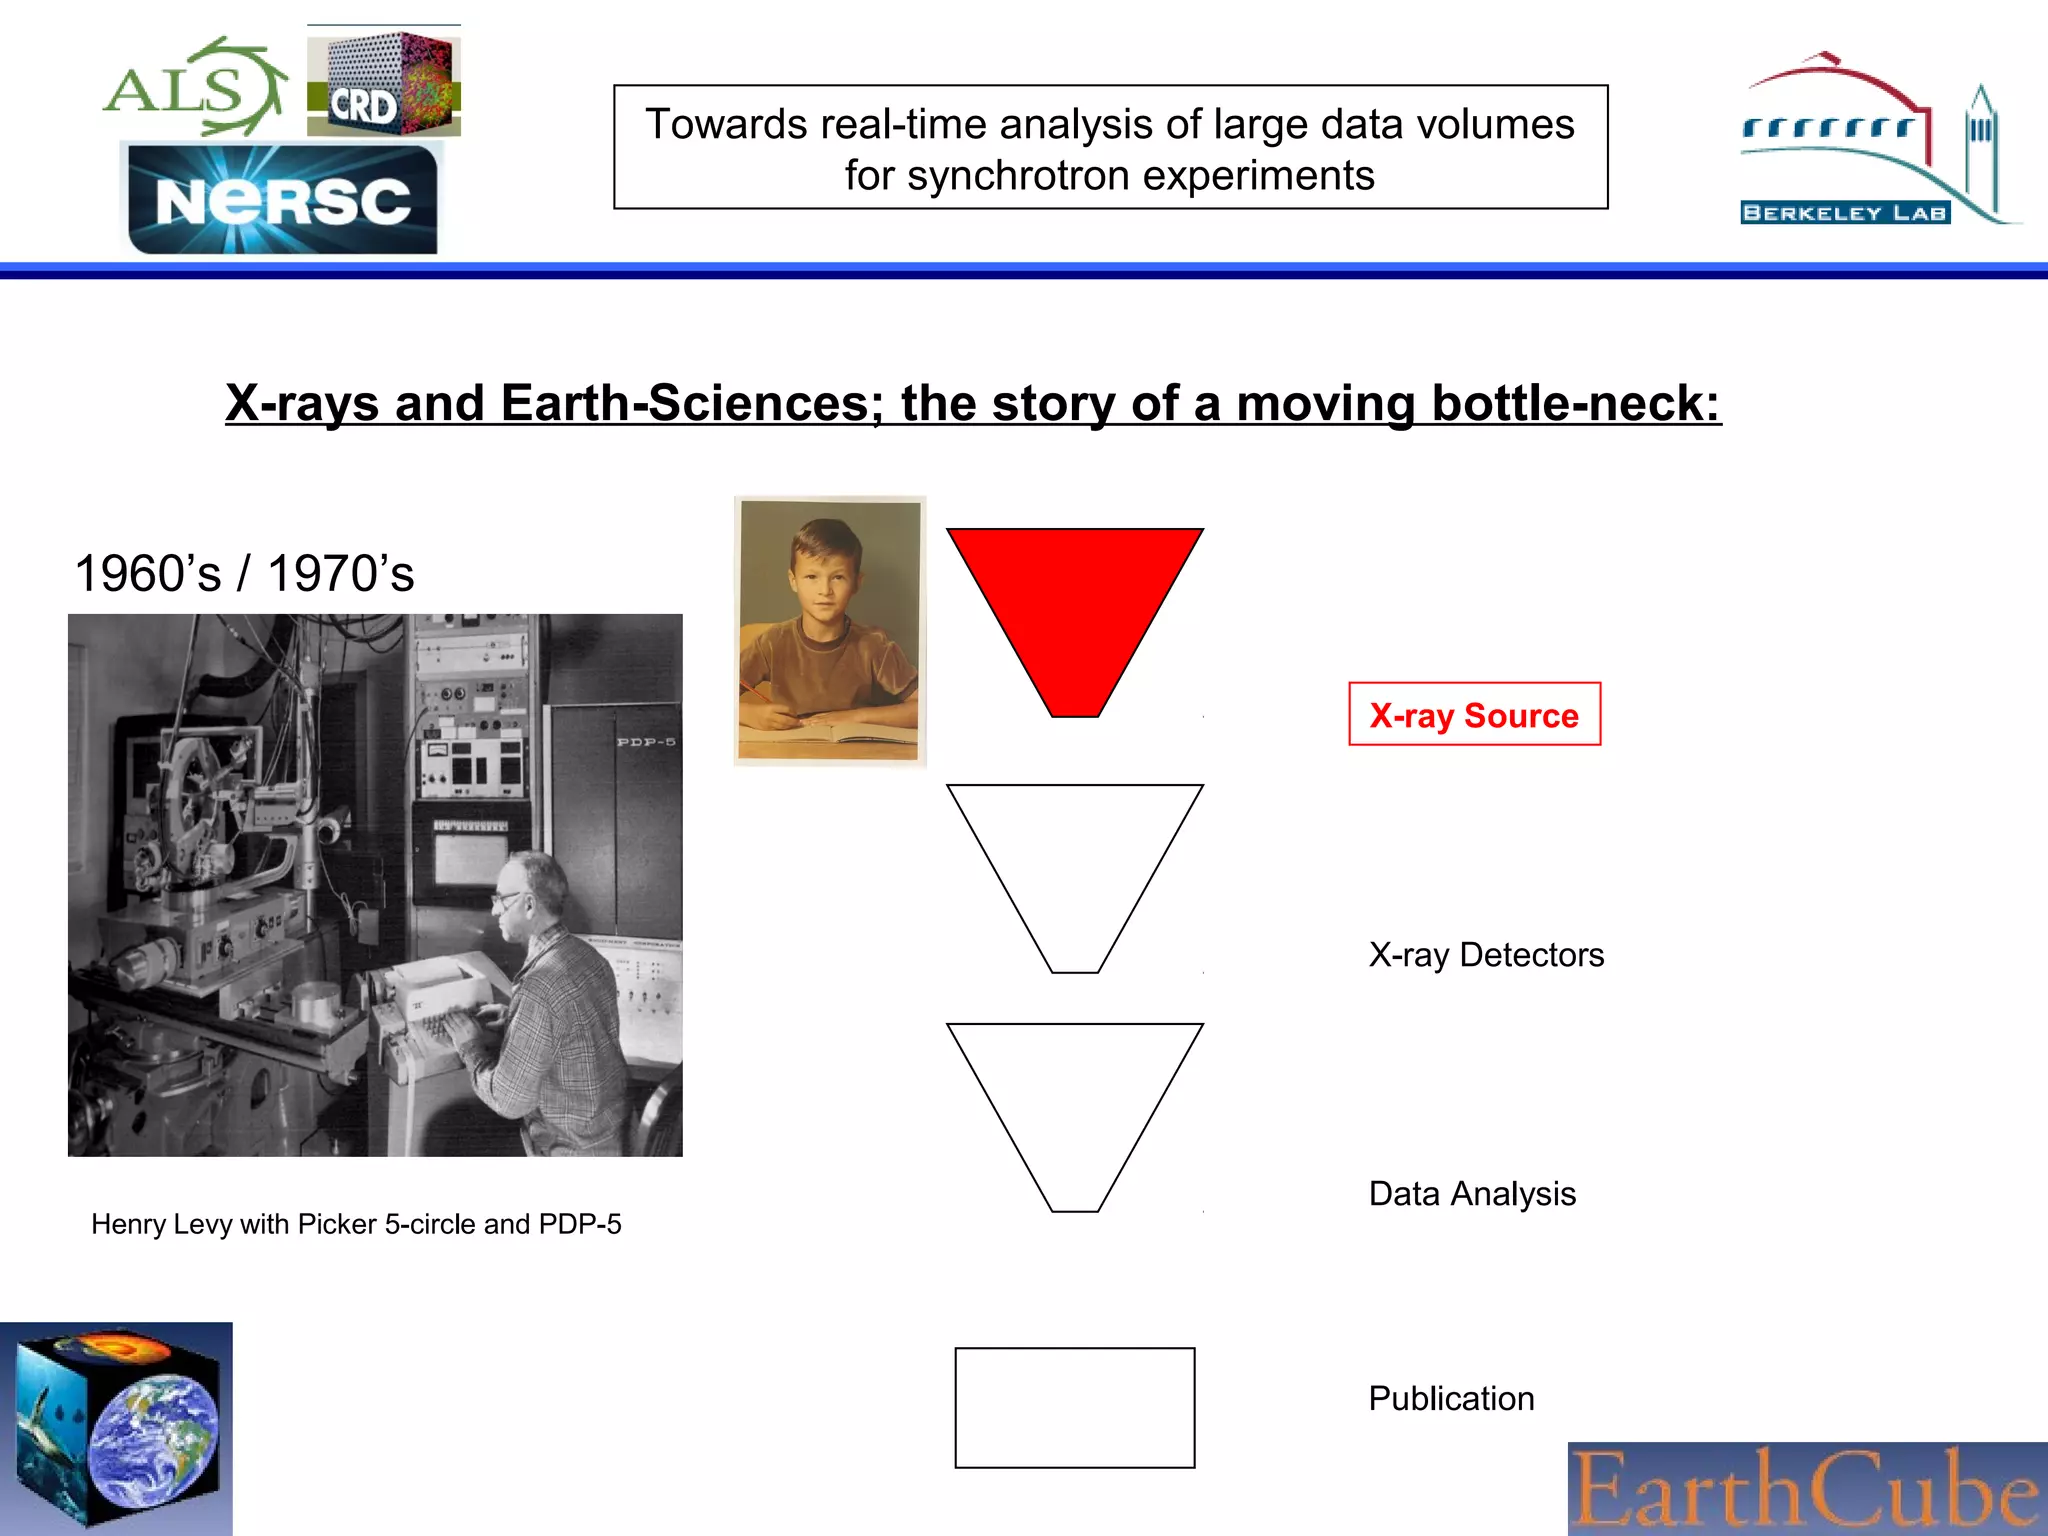
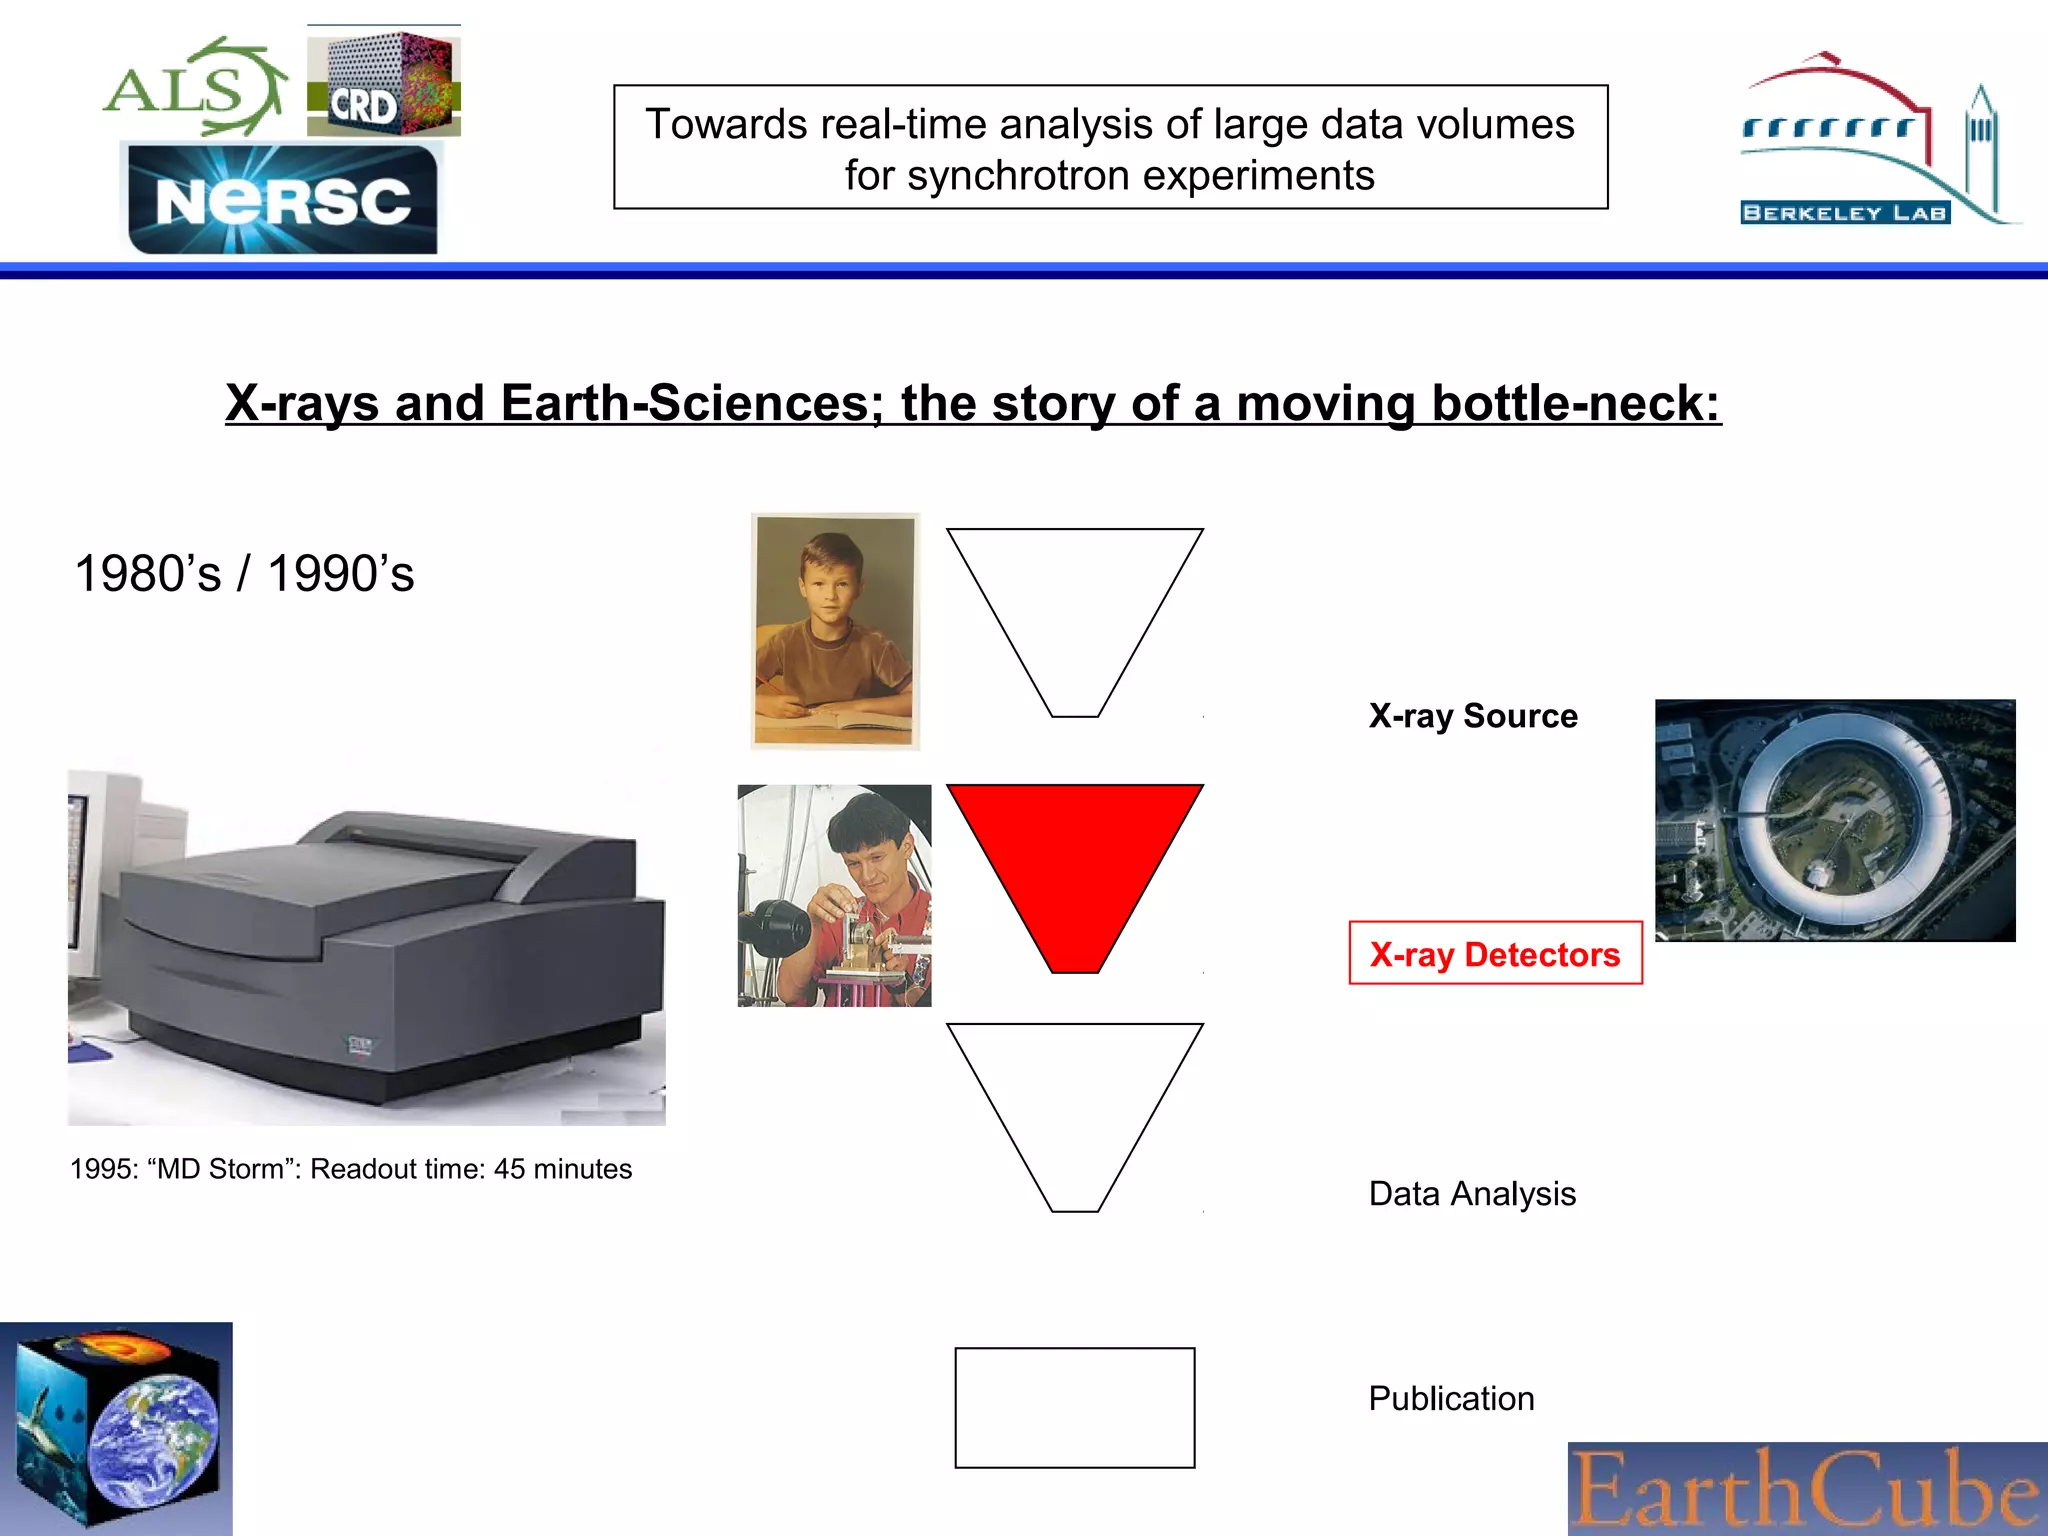
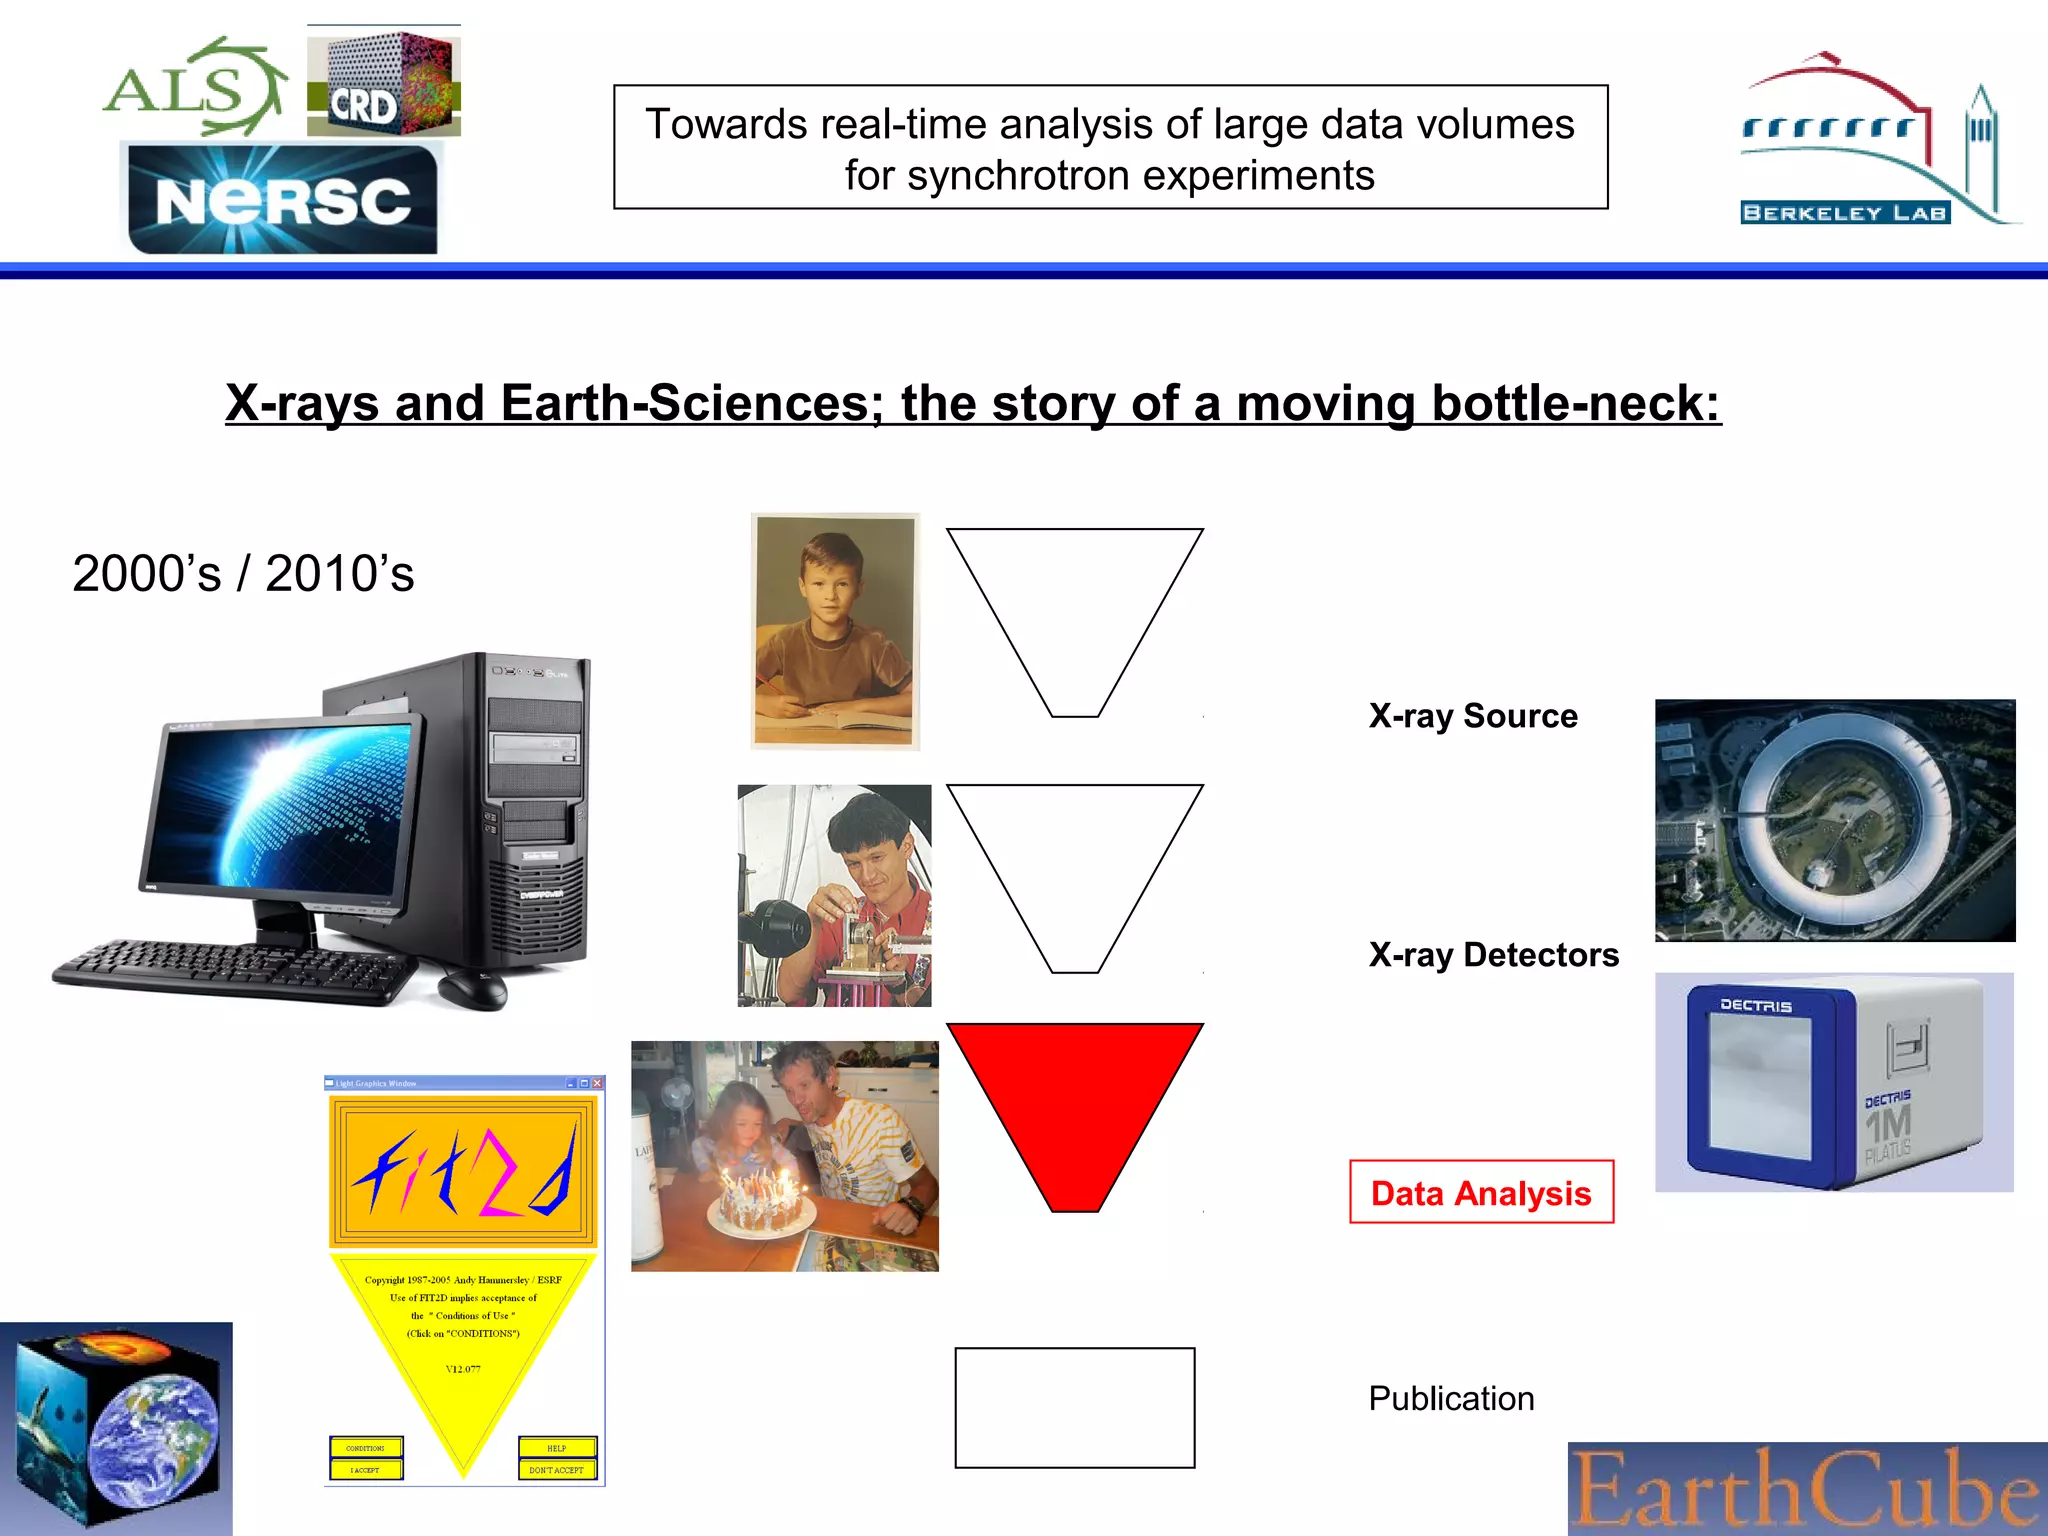
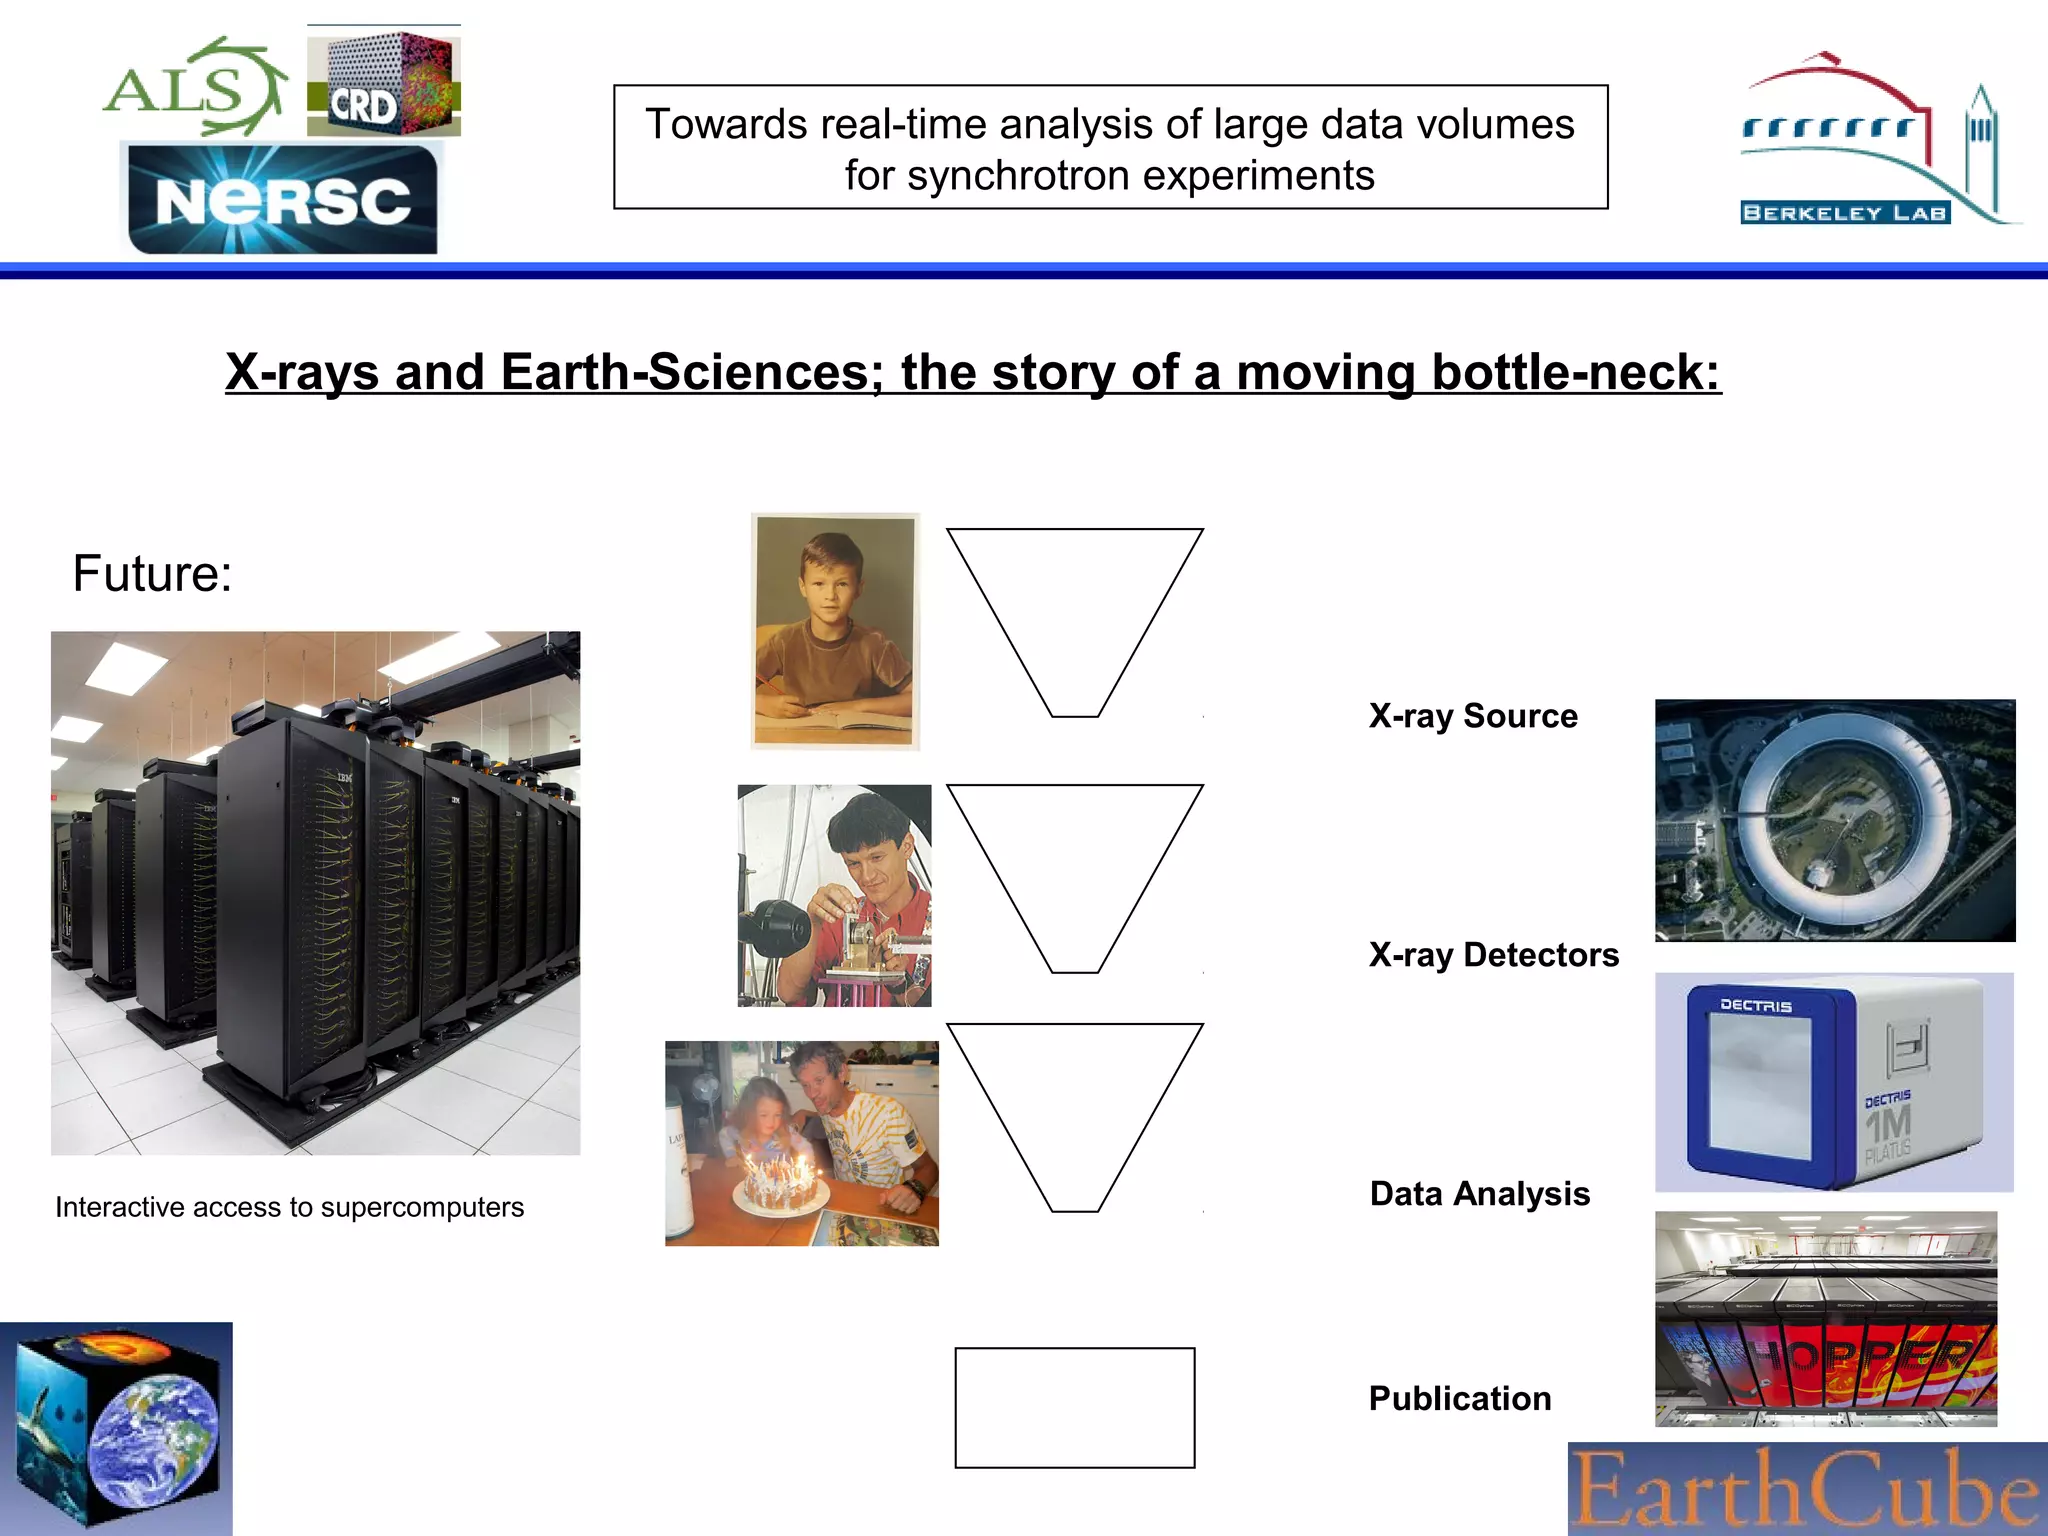
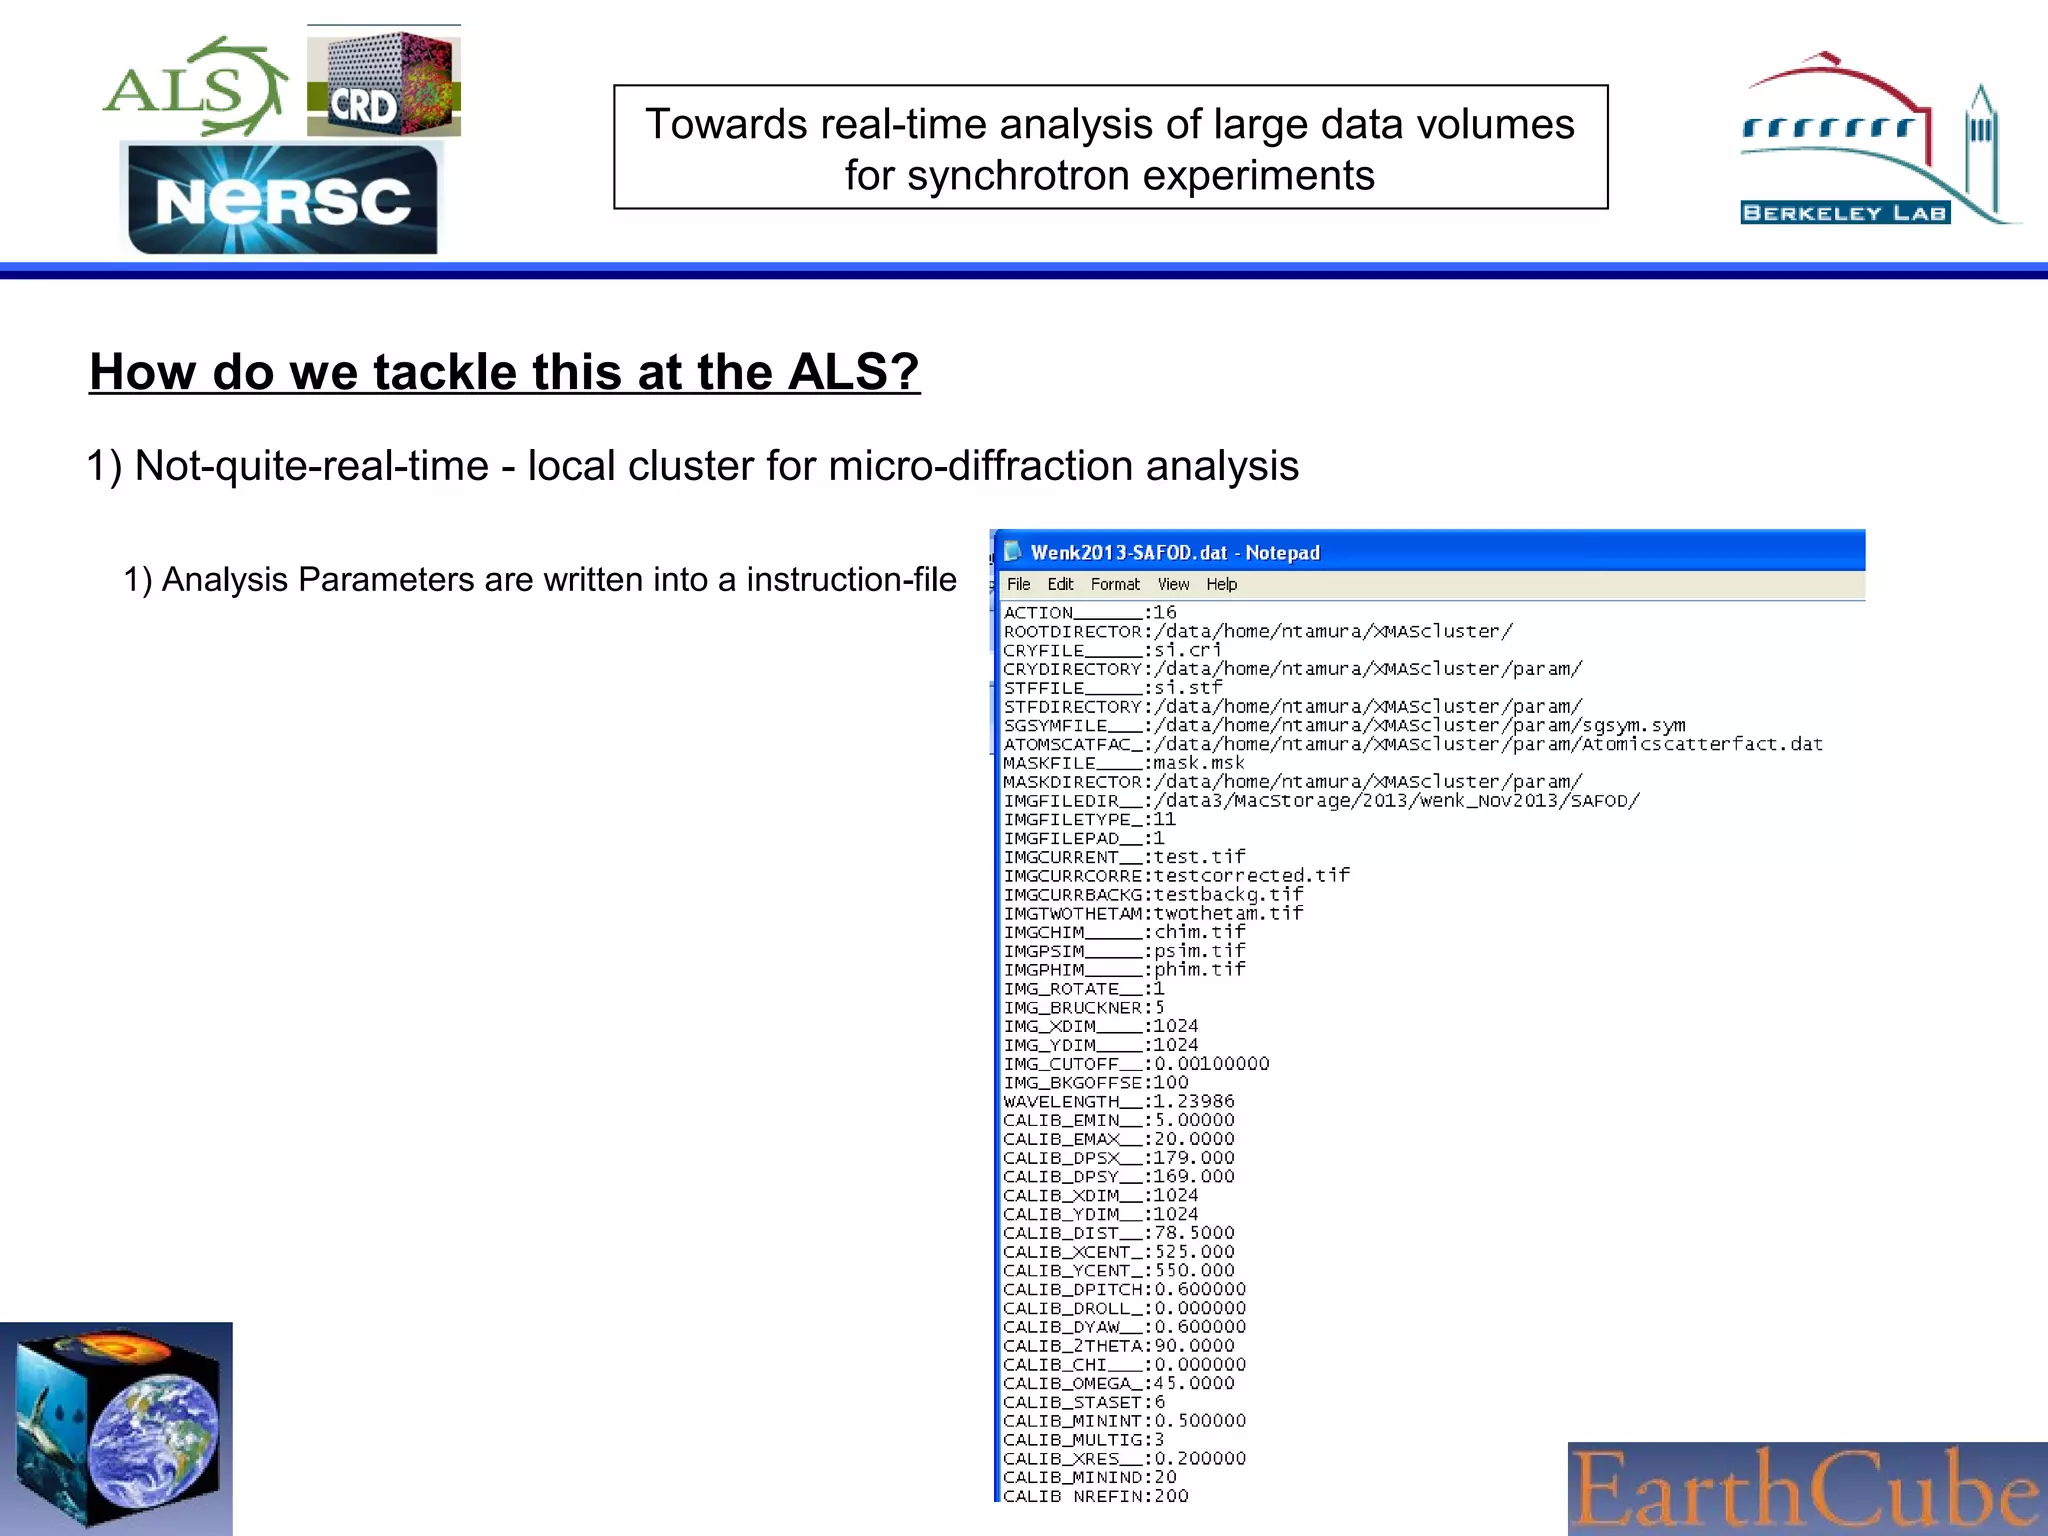
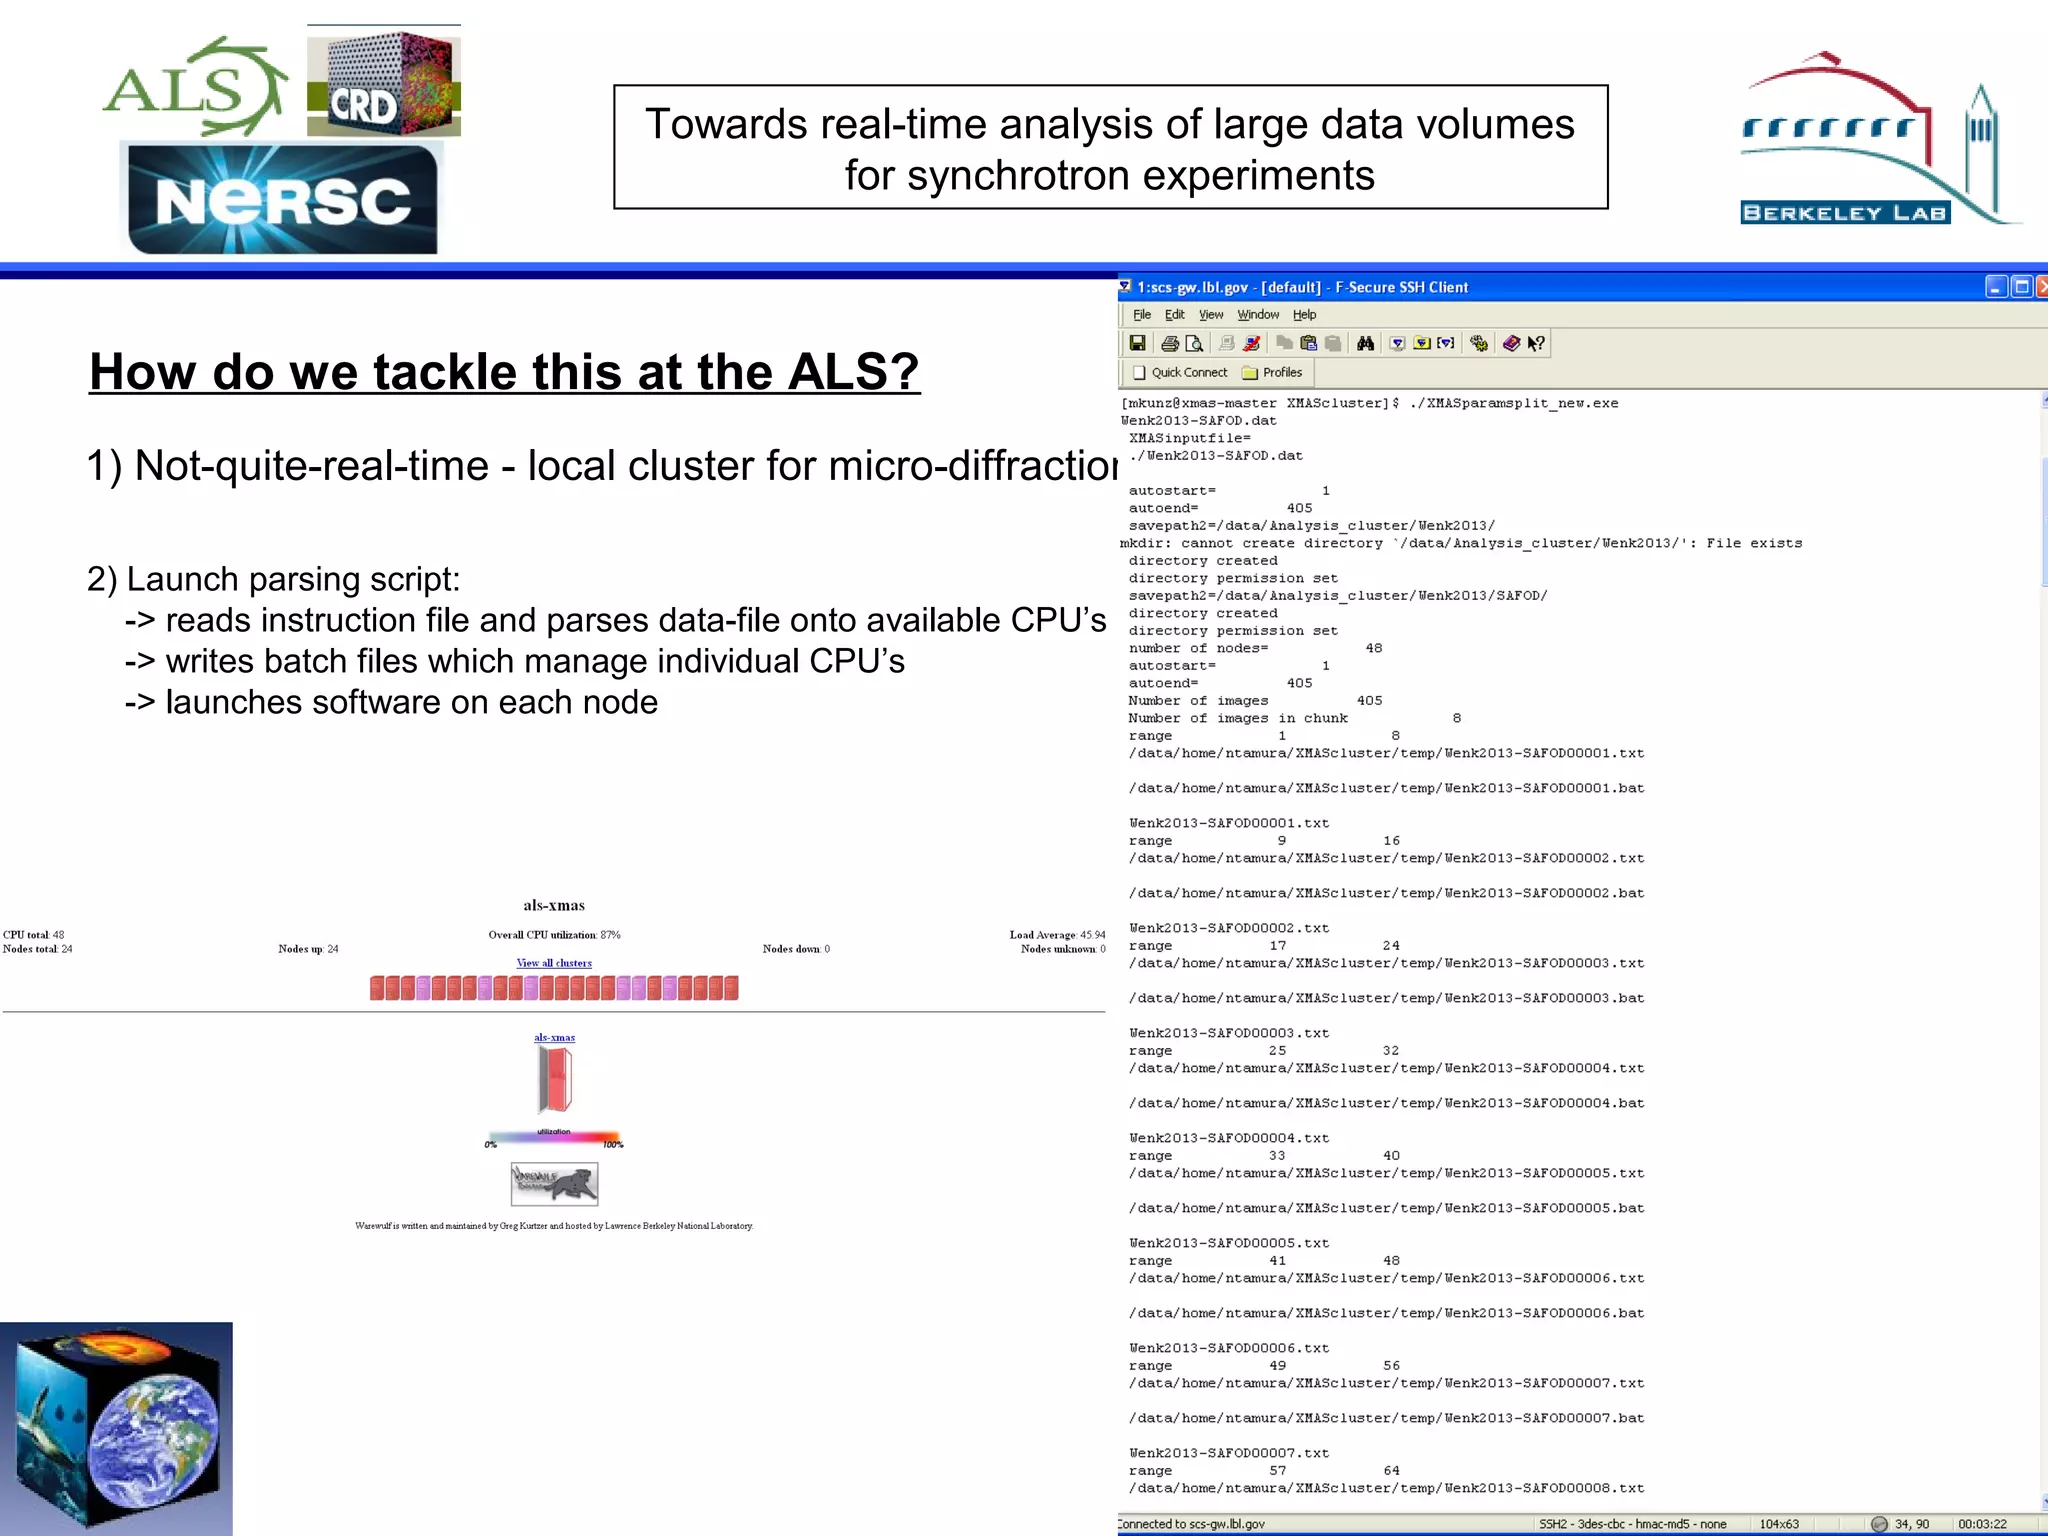
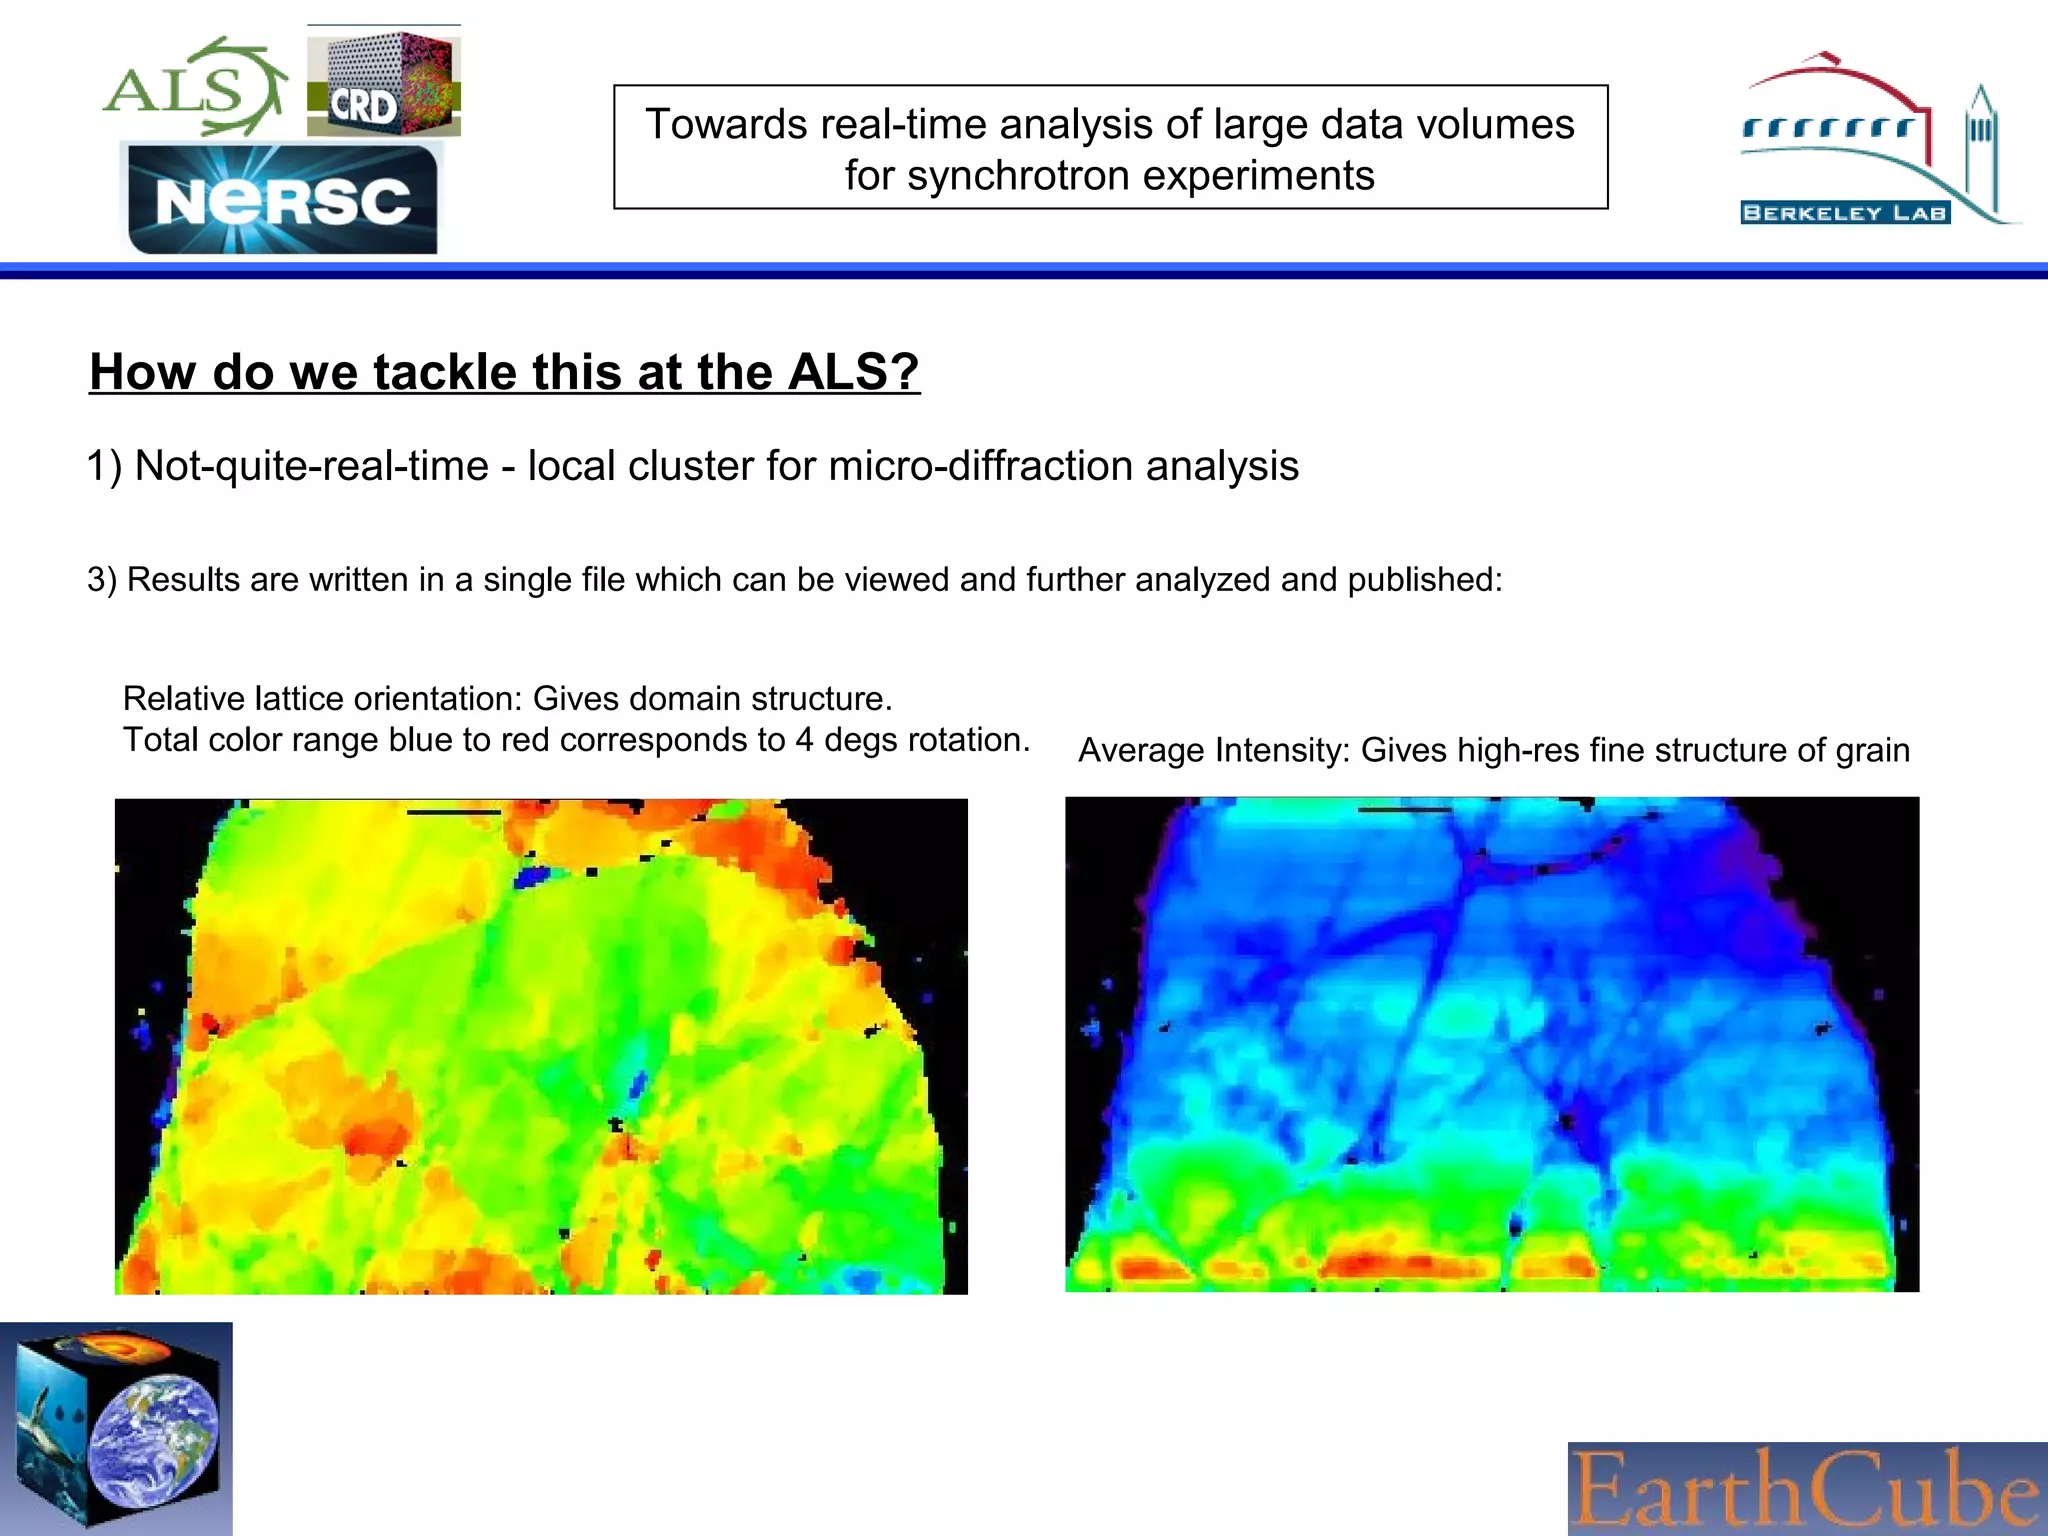
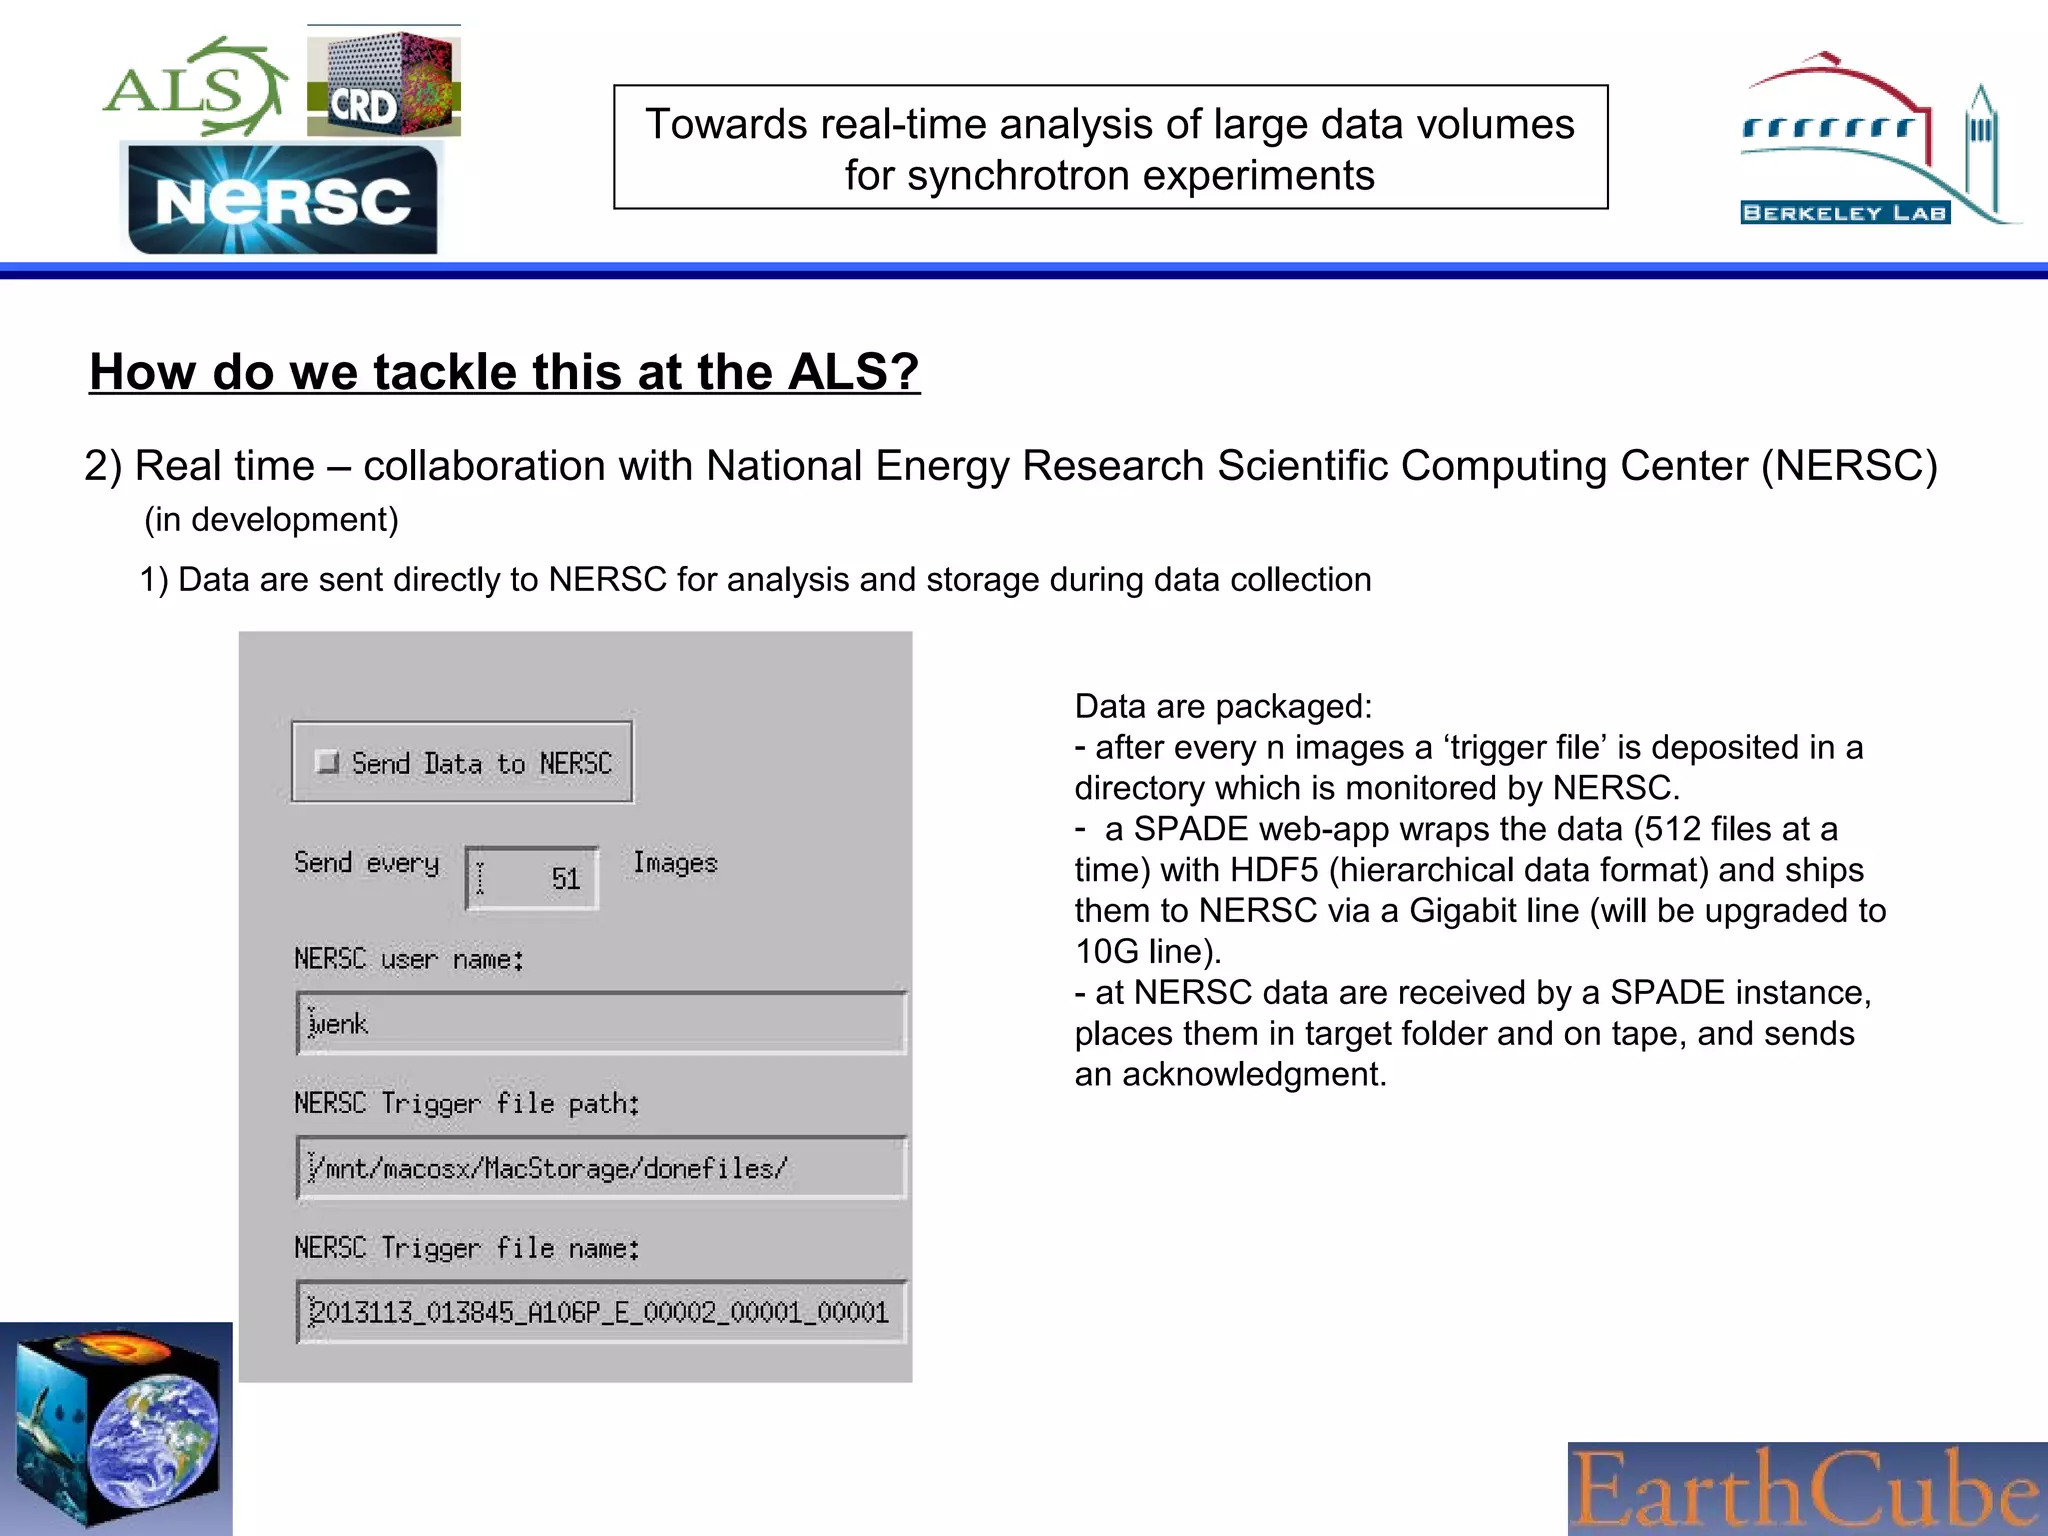
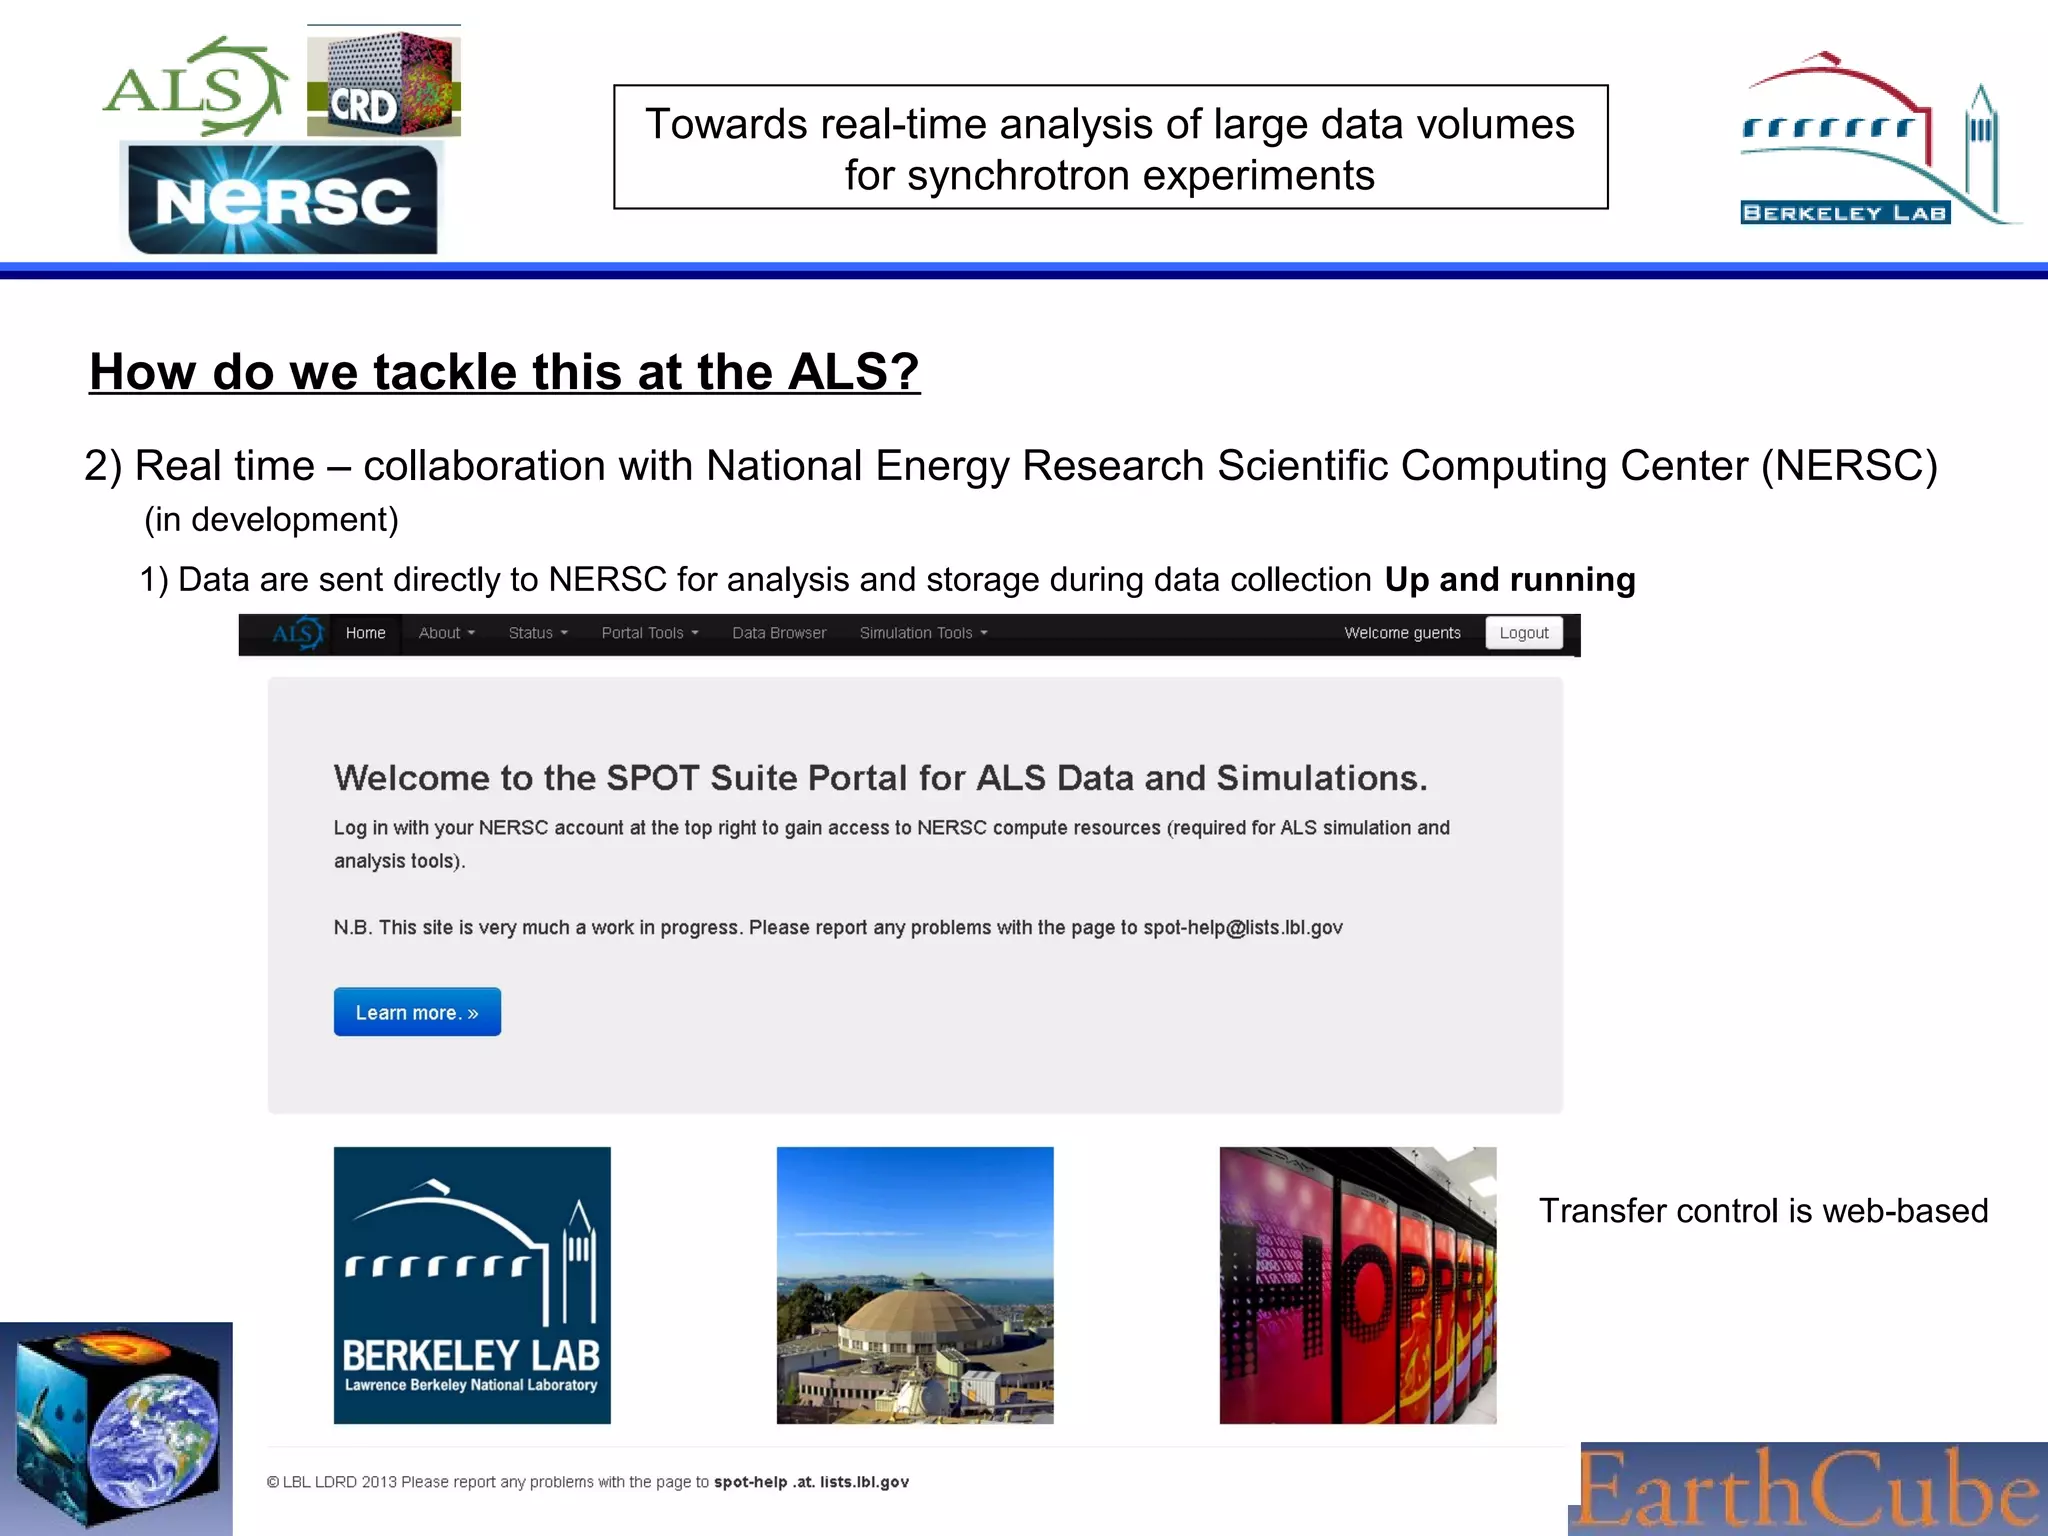
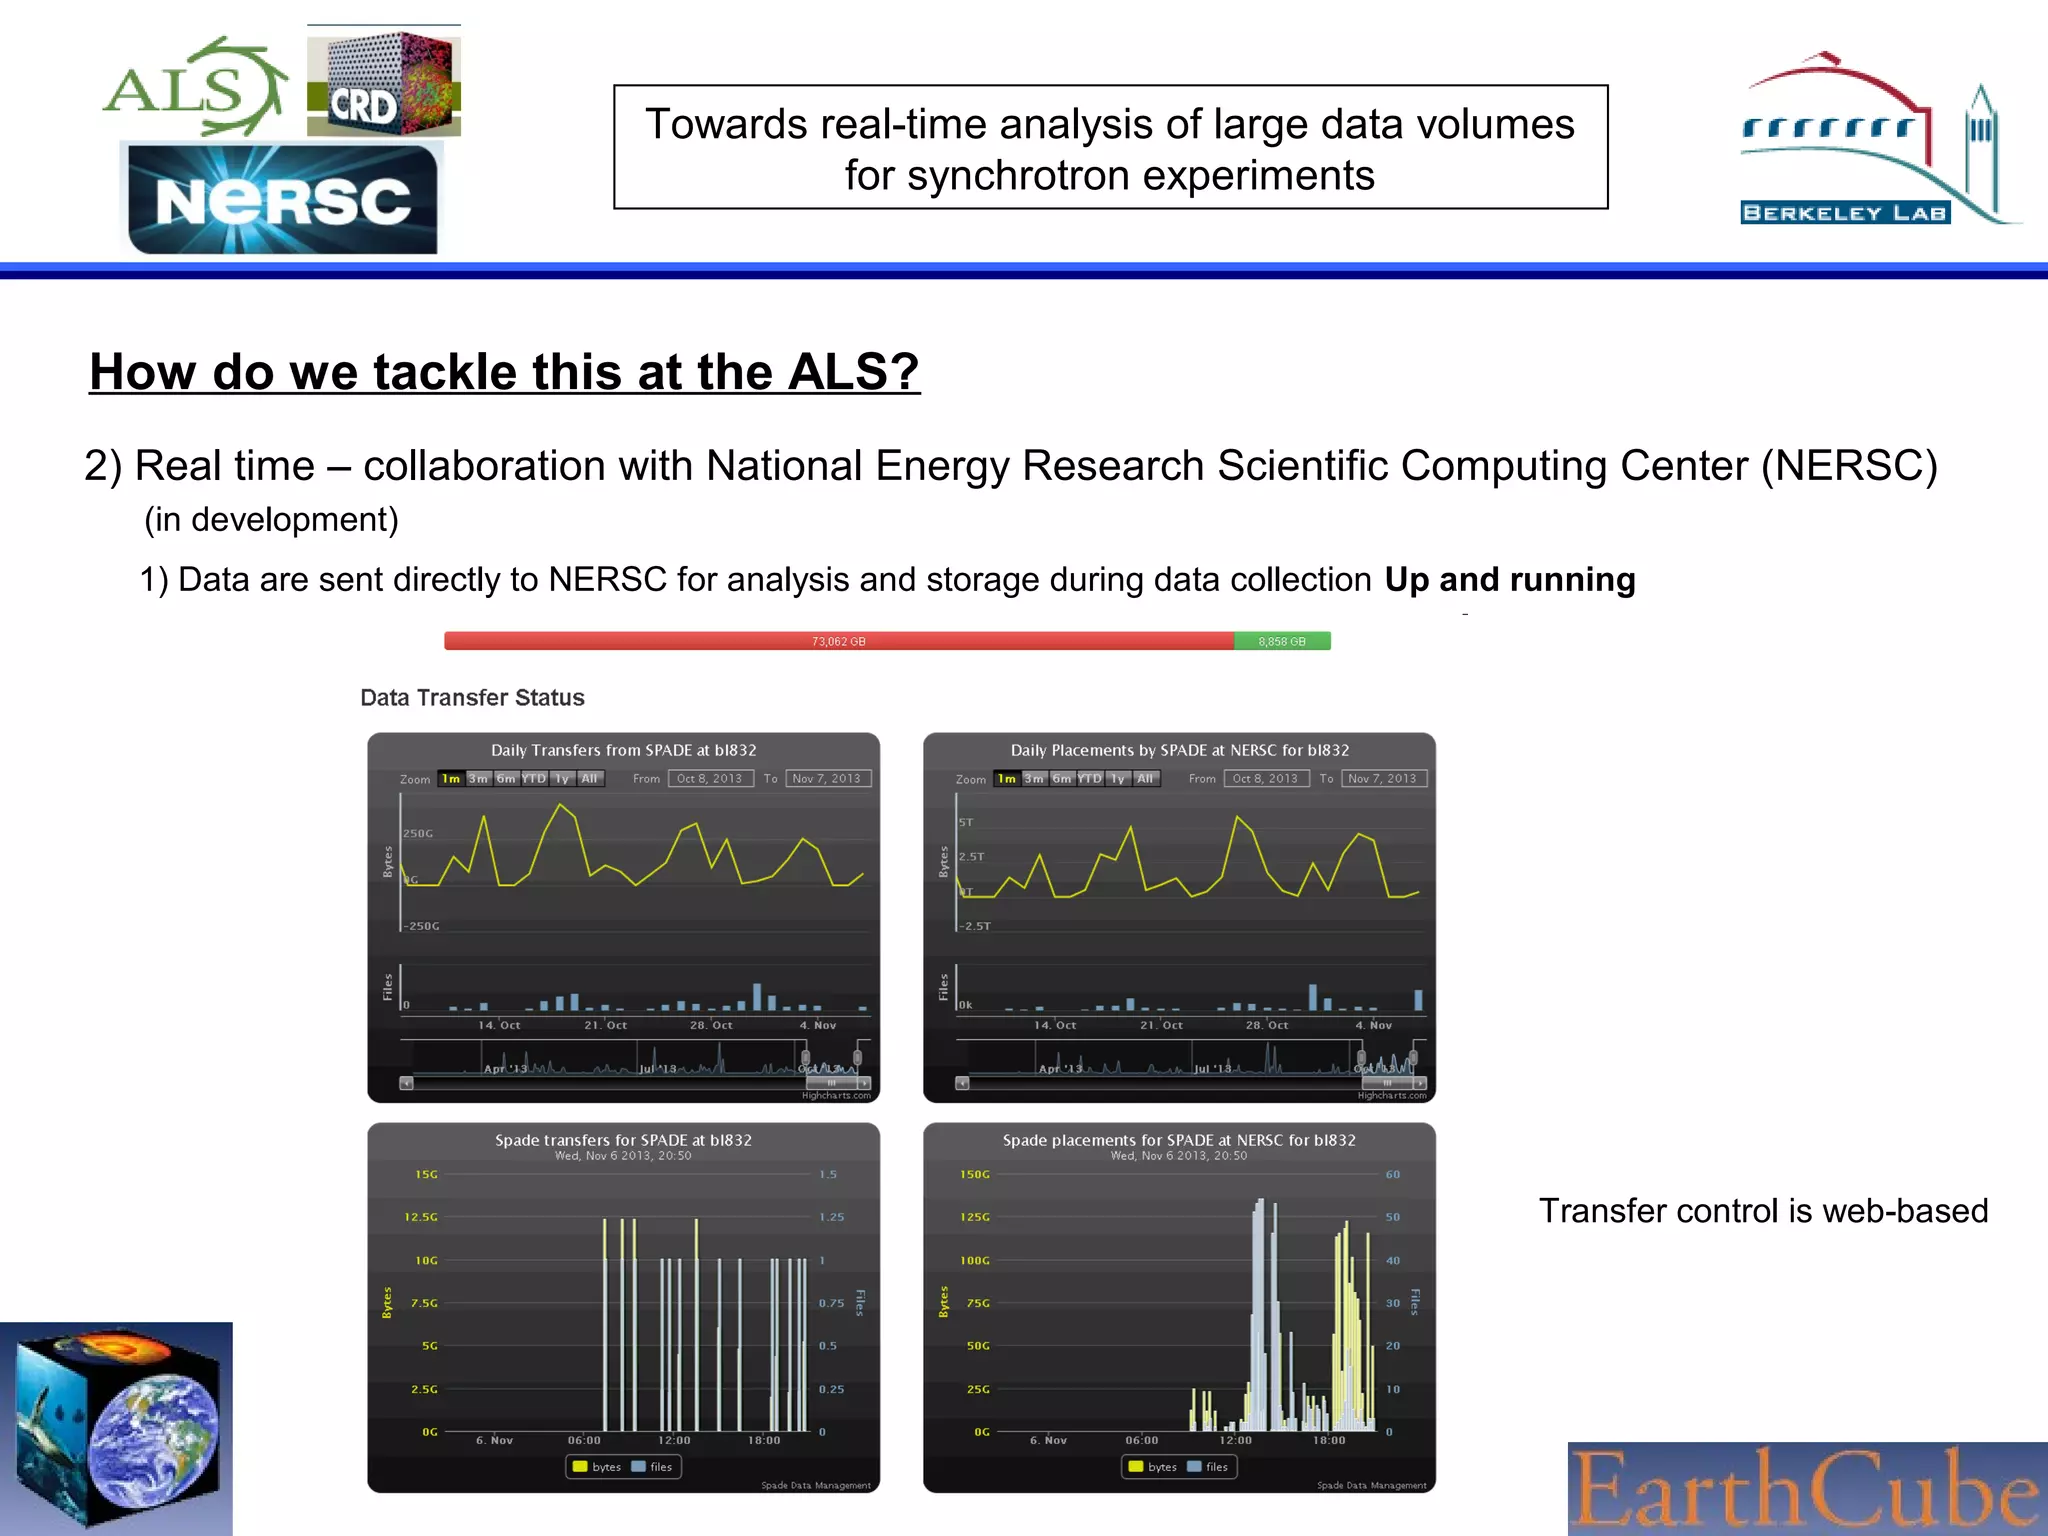
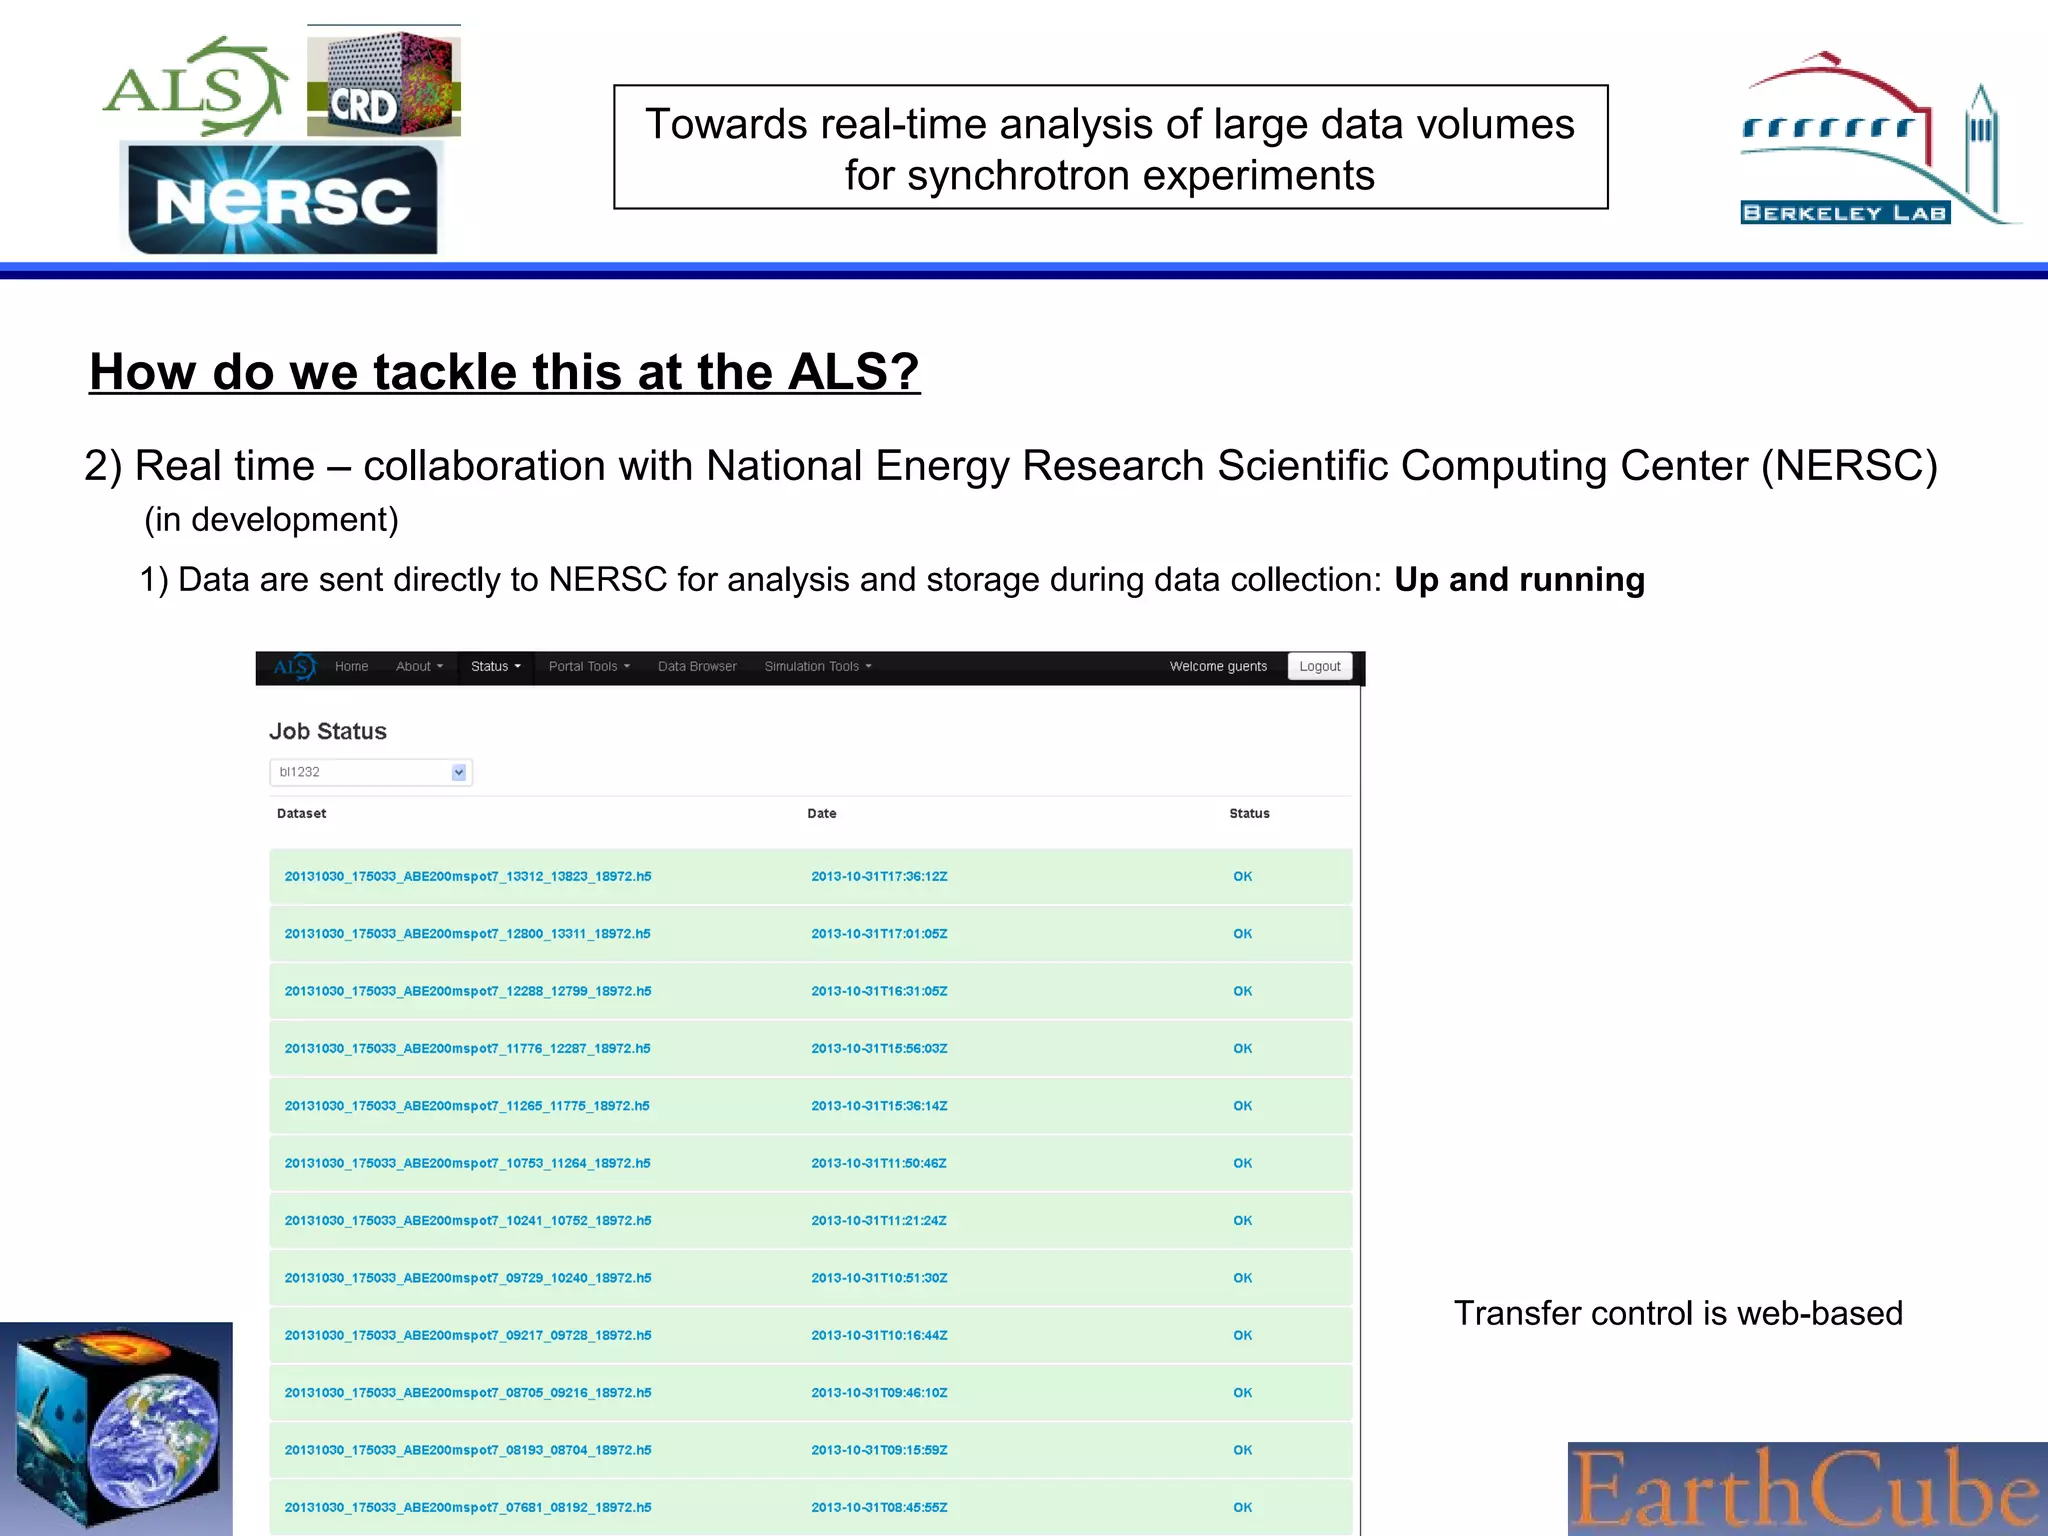
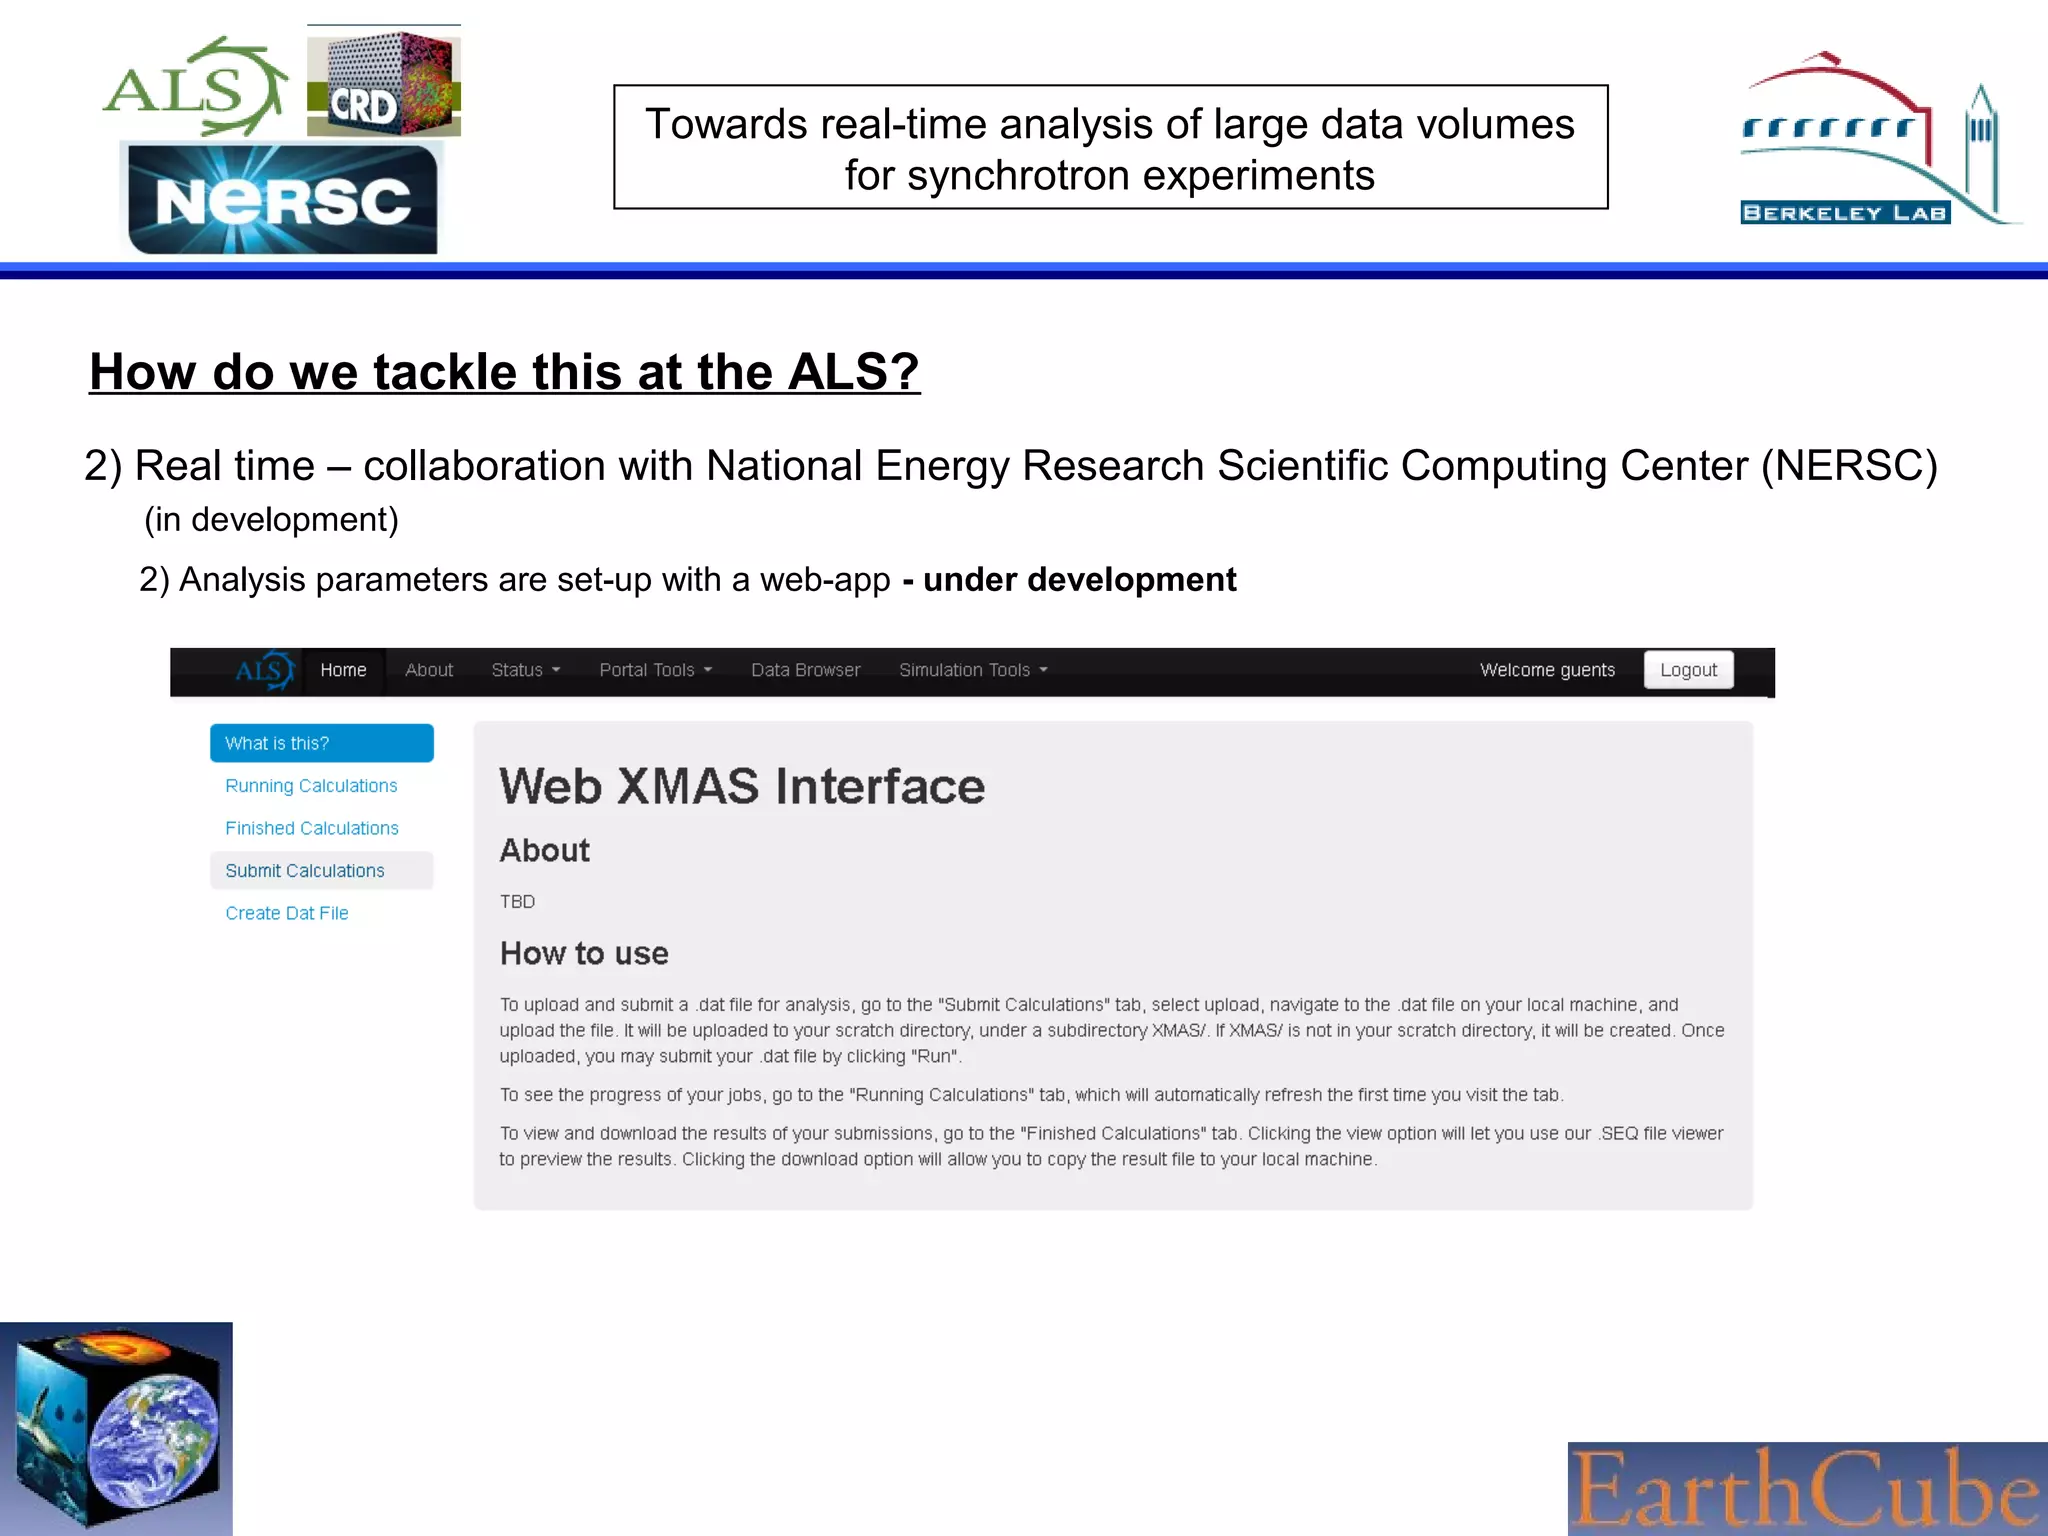
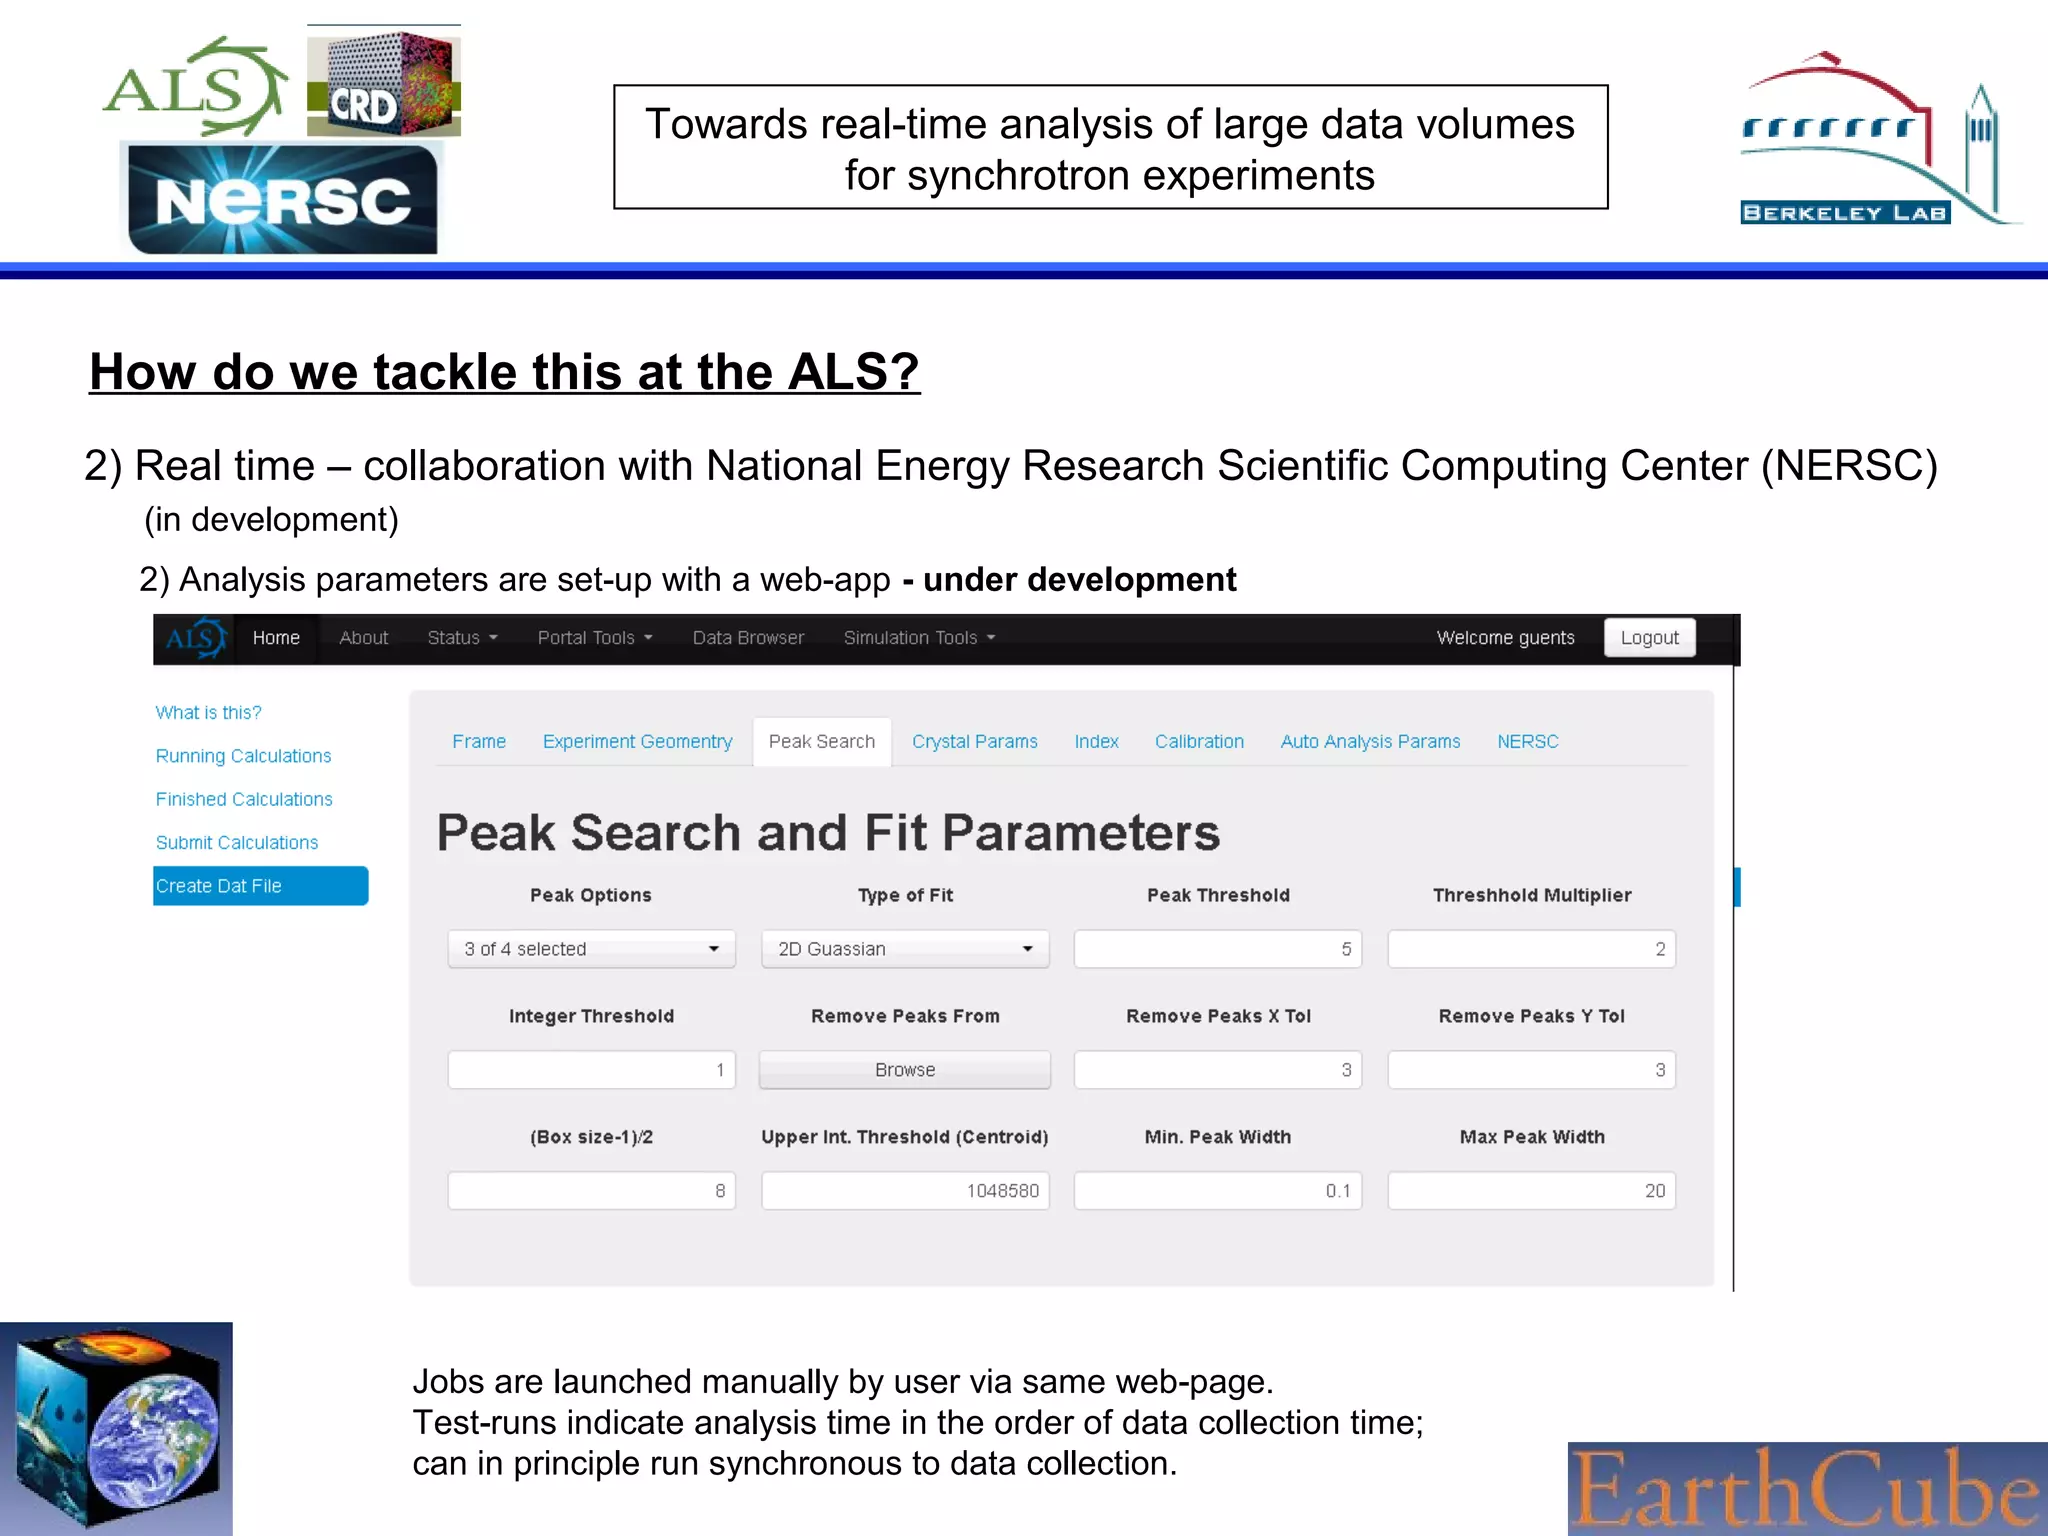
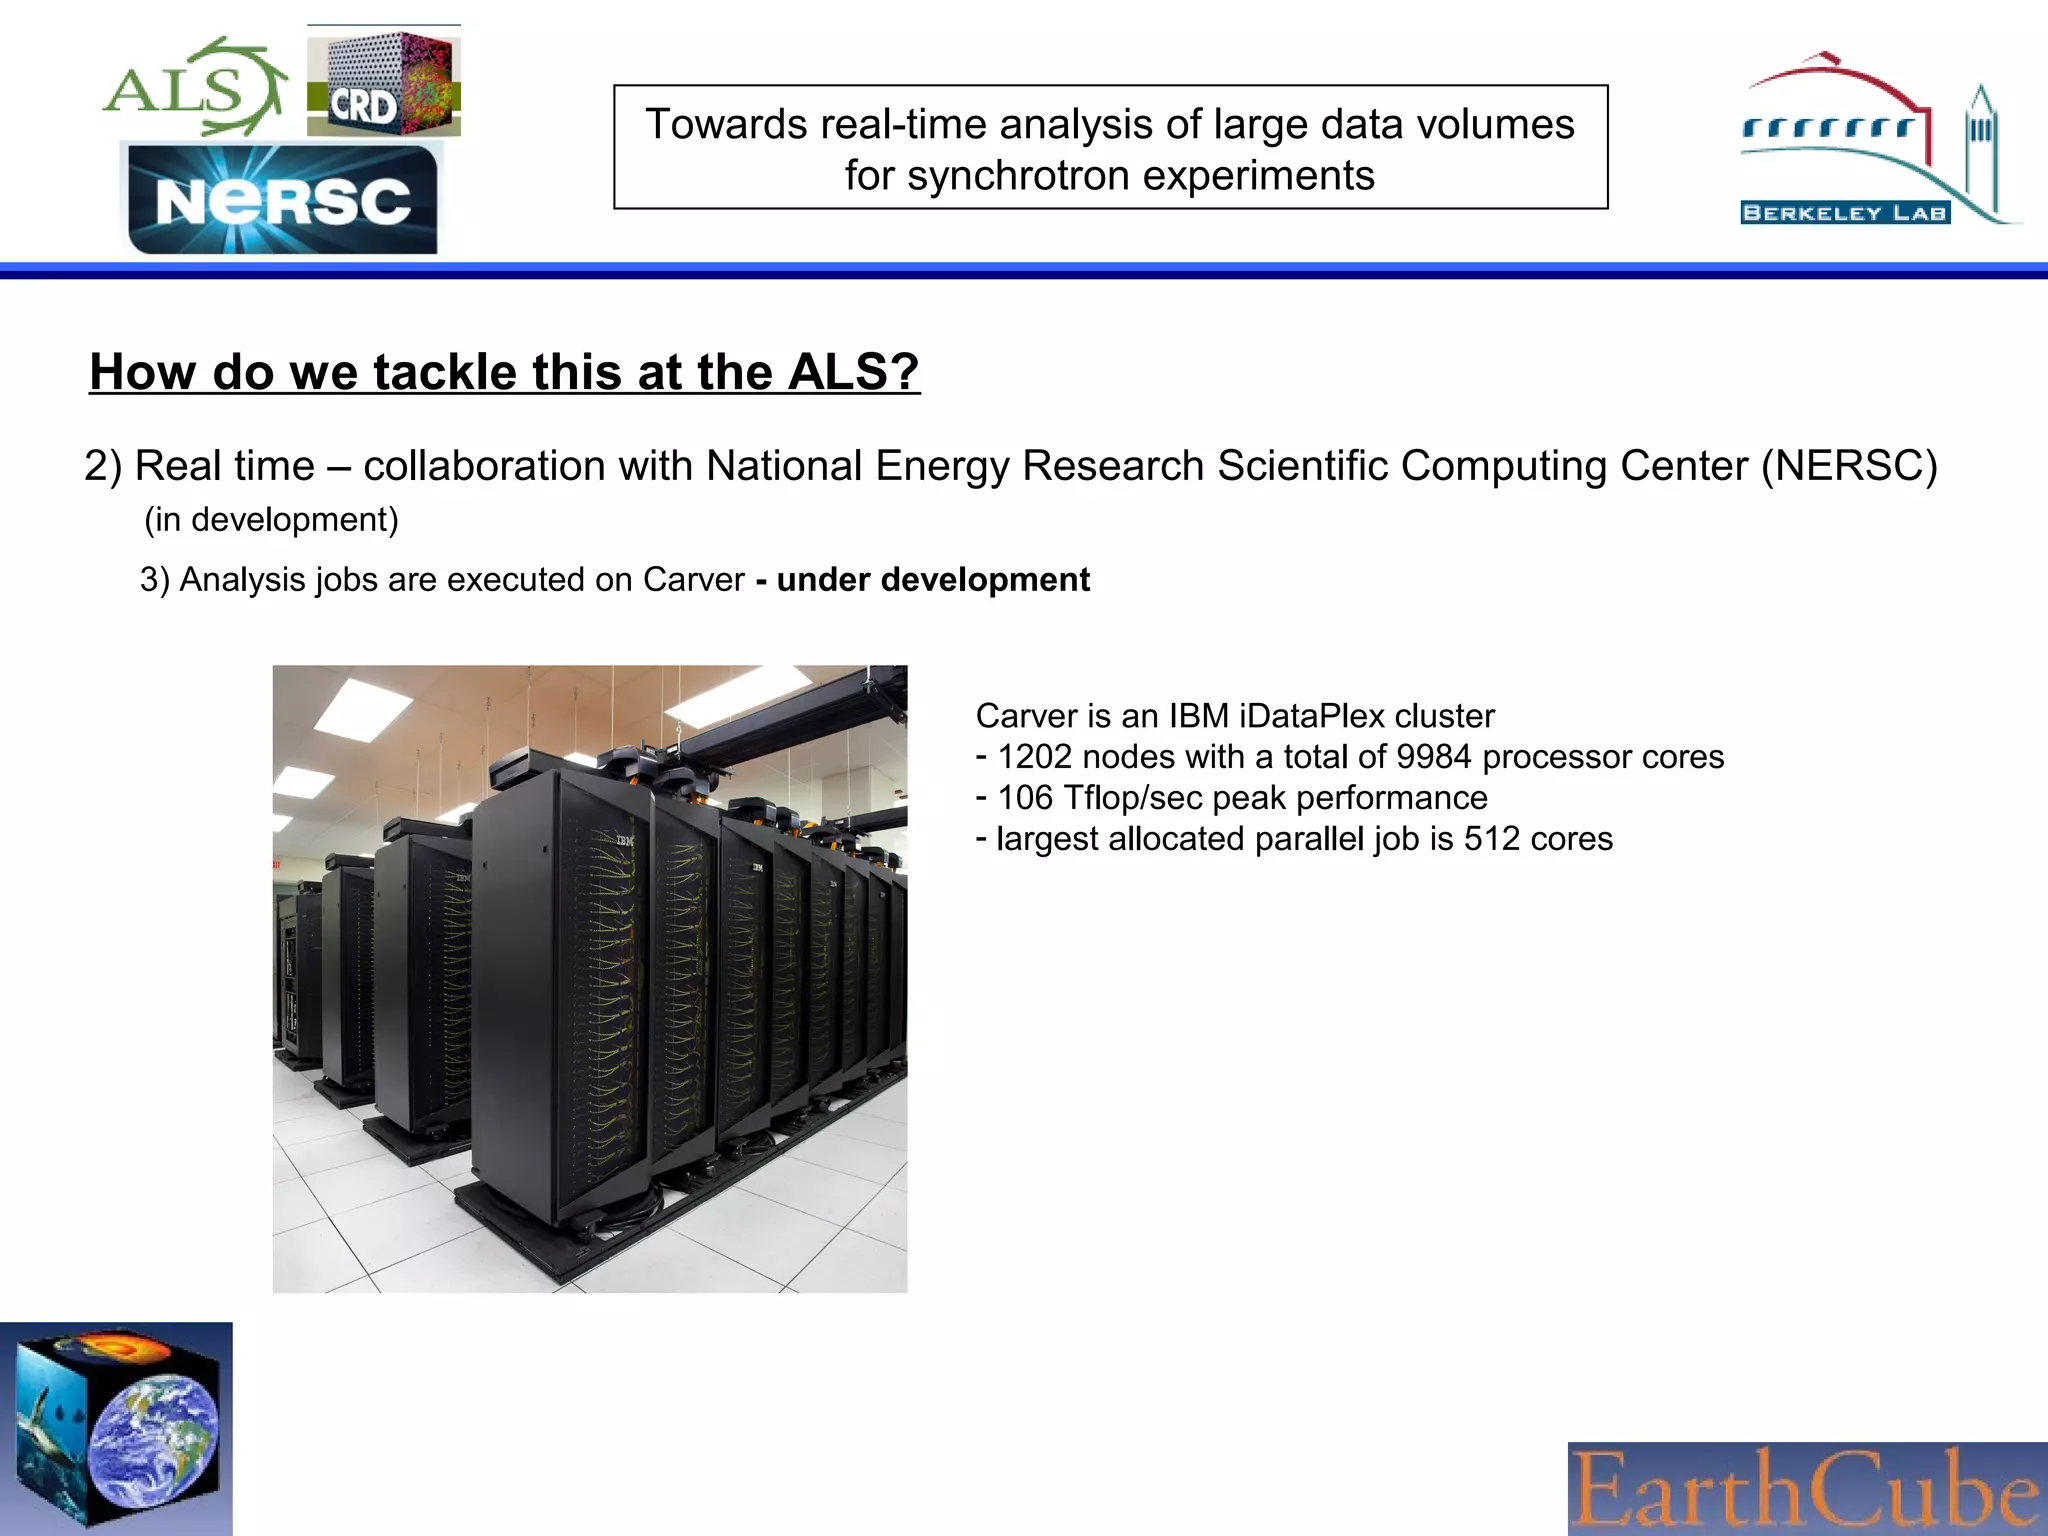

The document discusses the challenges of real-time analysis of large data volumes in synchrotron experiments within experimental mineral physics. It highlights the evolution of data analysis techniques, from traditional methods to the need for real-time, automated systems that leverage supercomputing resources for efficiency. The authors emphasize the importance of collaboration with national computing centers to facilitate high-speed data transmission and analysis.


![Vibe Coding vs. Spec-Driven Development [Free Meetup]](https://cdn.slidesharecdn.com/ss_thumbnails/vibecodingvsspecdrivendevelopment-251209105622-43f455e7-thumbnail.jpg?width=640&height=640&fit=bounds)


