Download to read offline

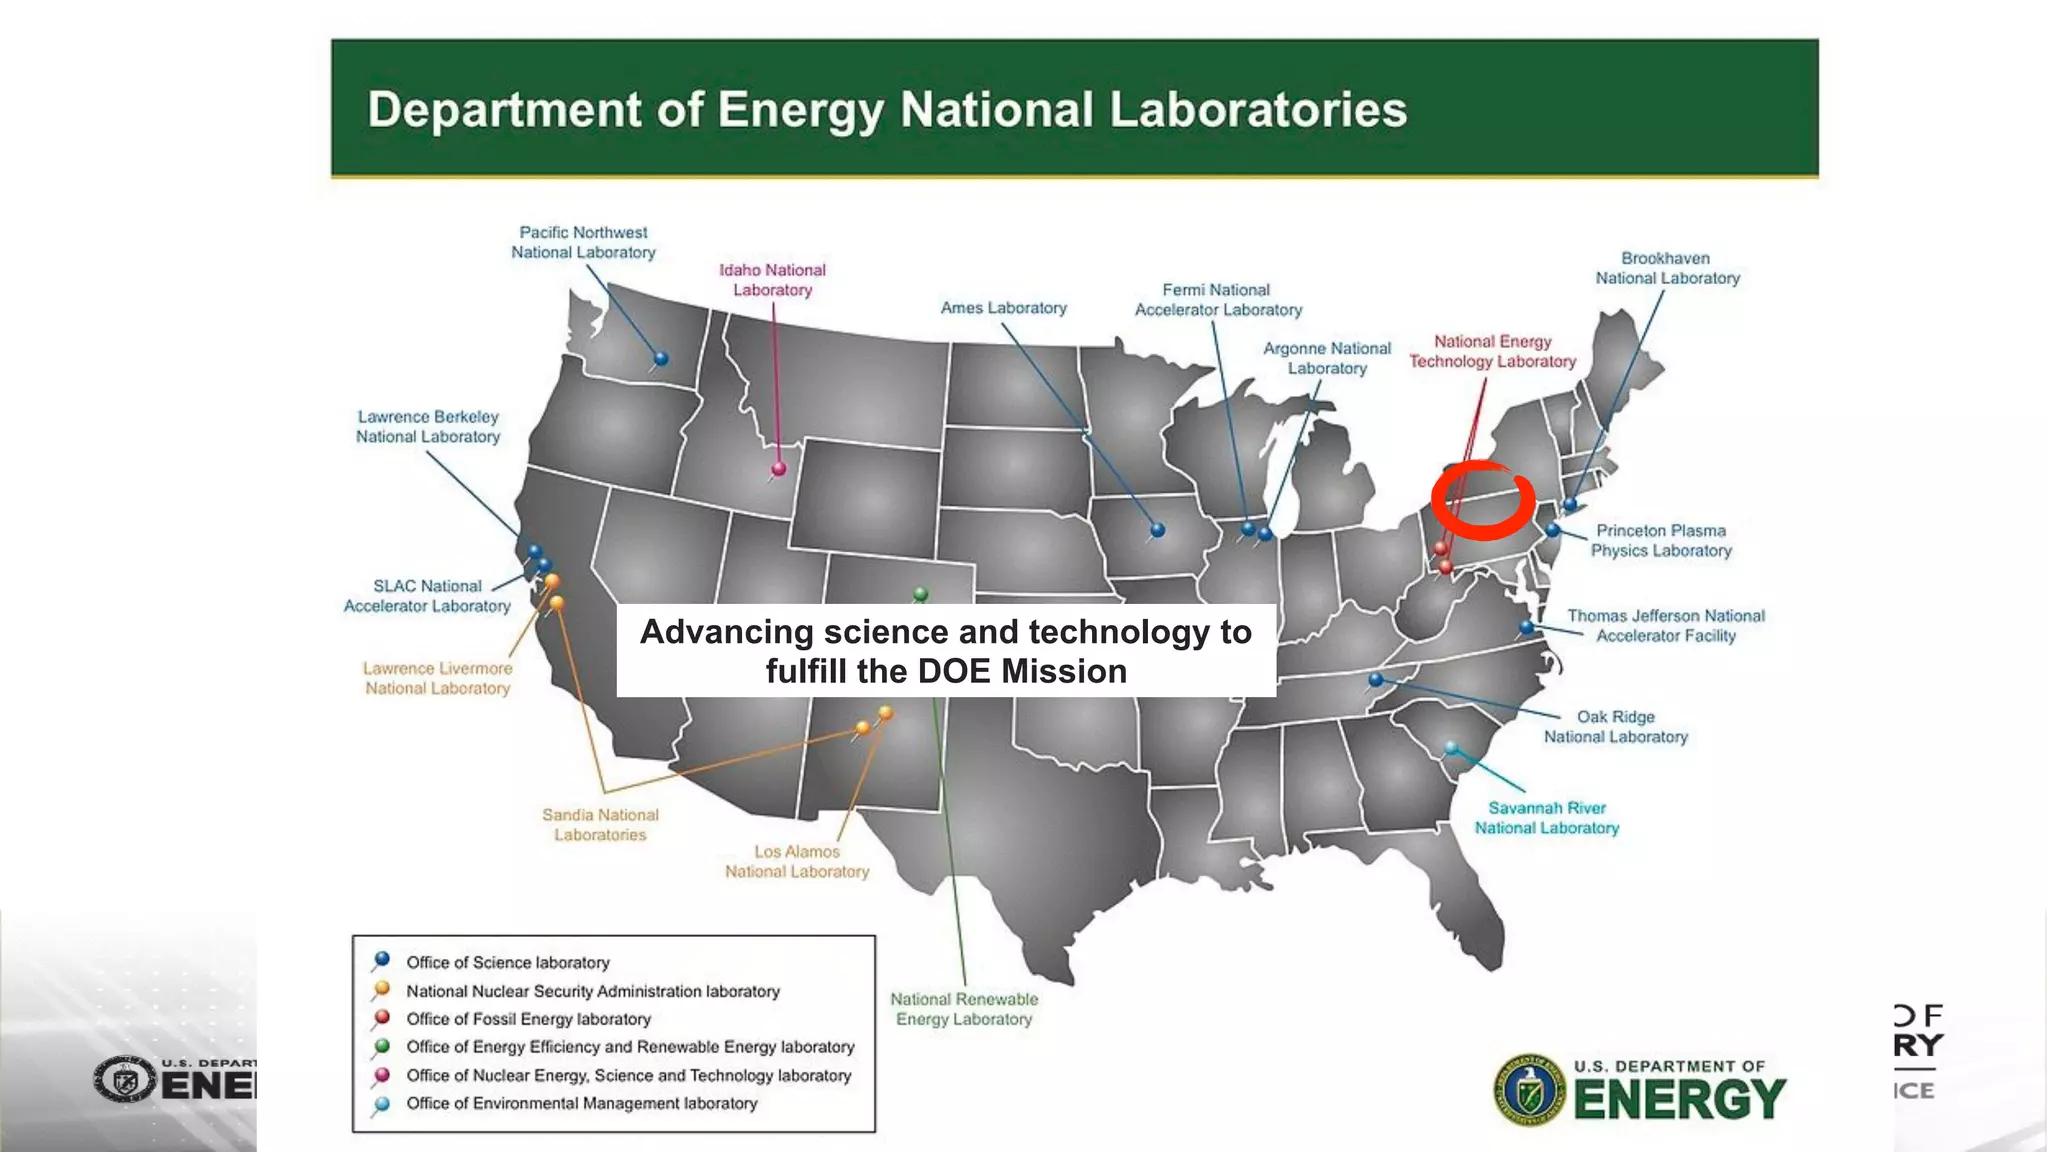
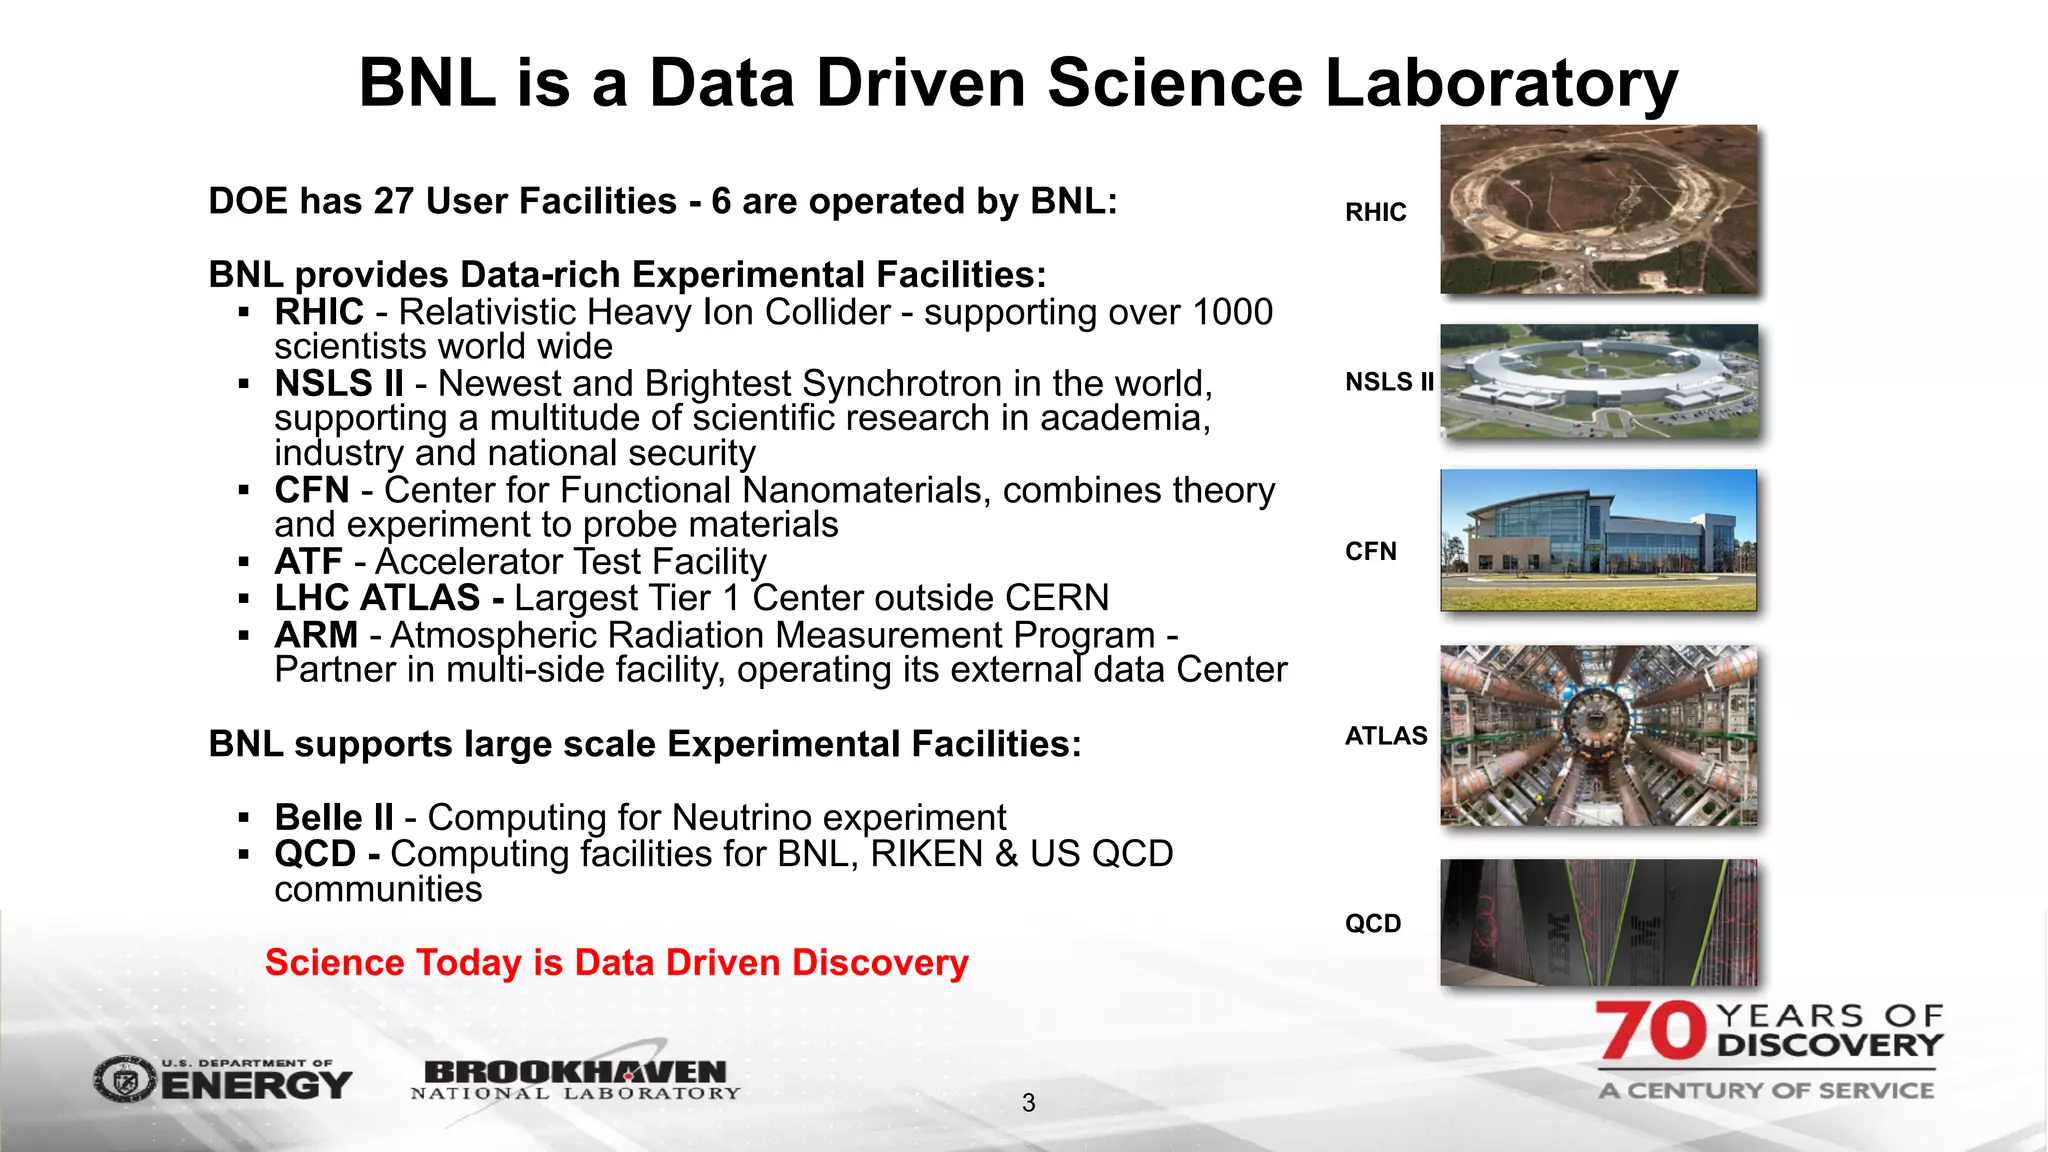
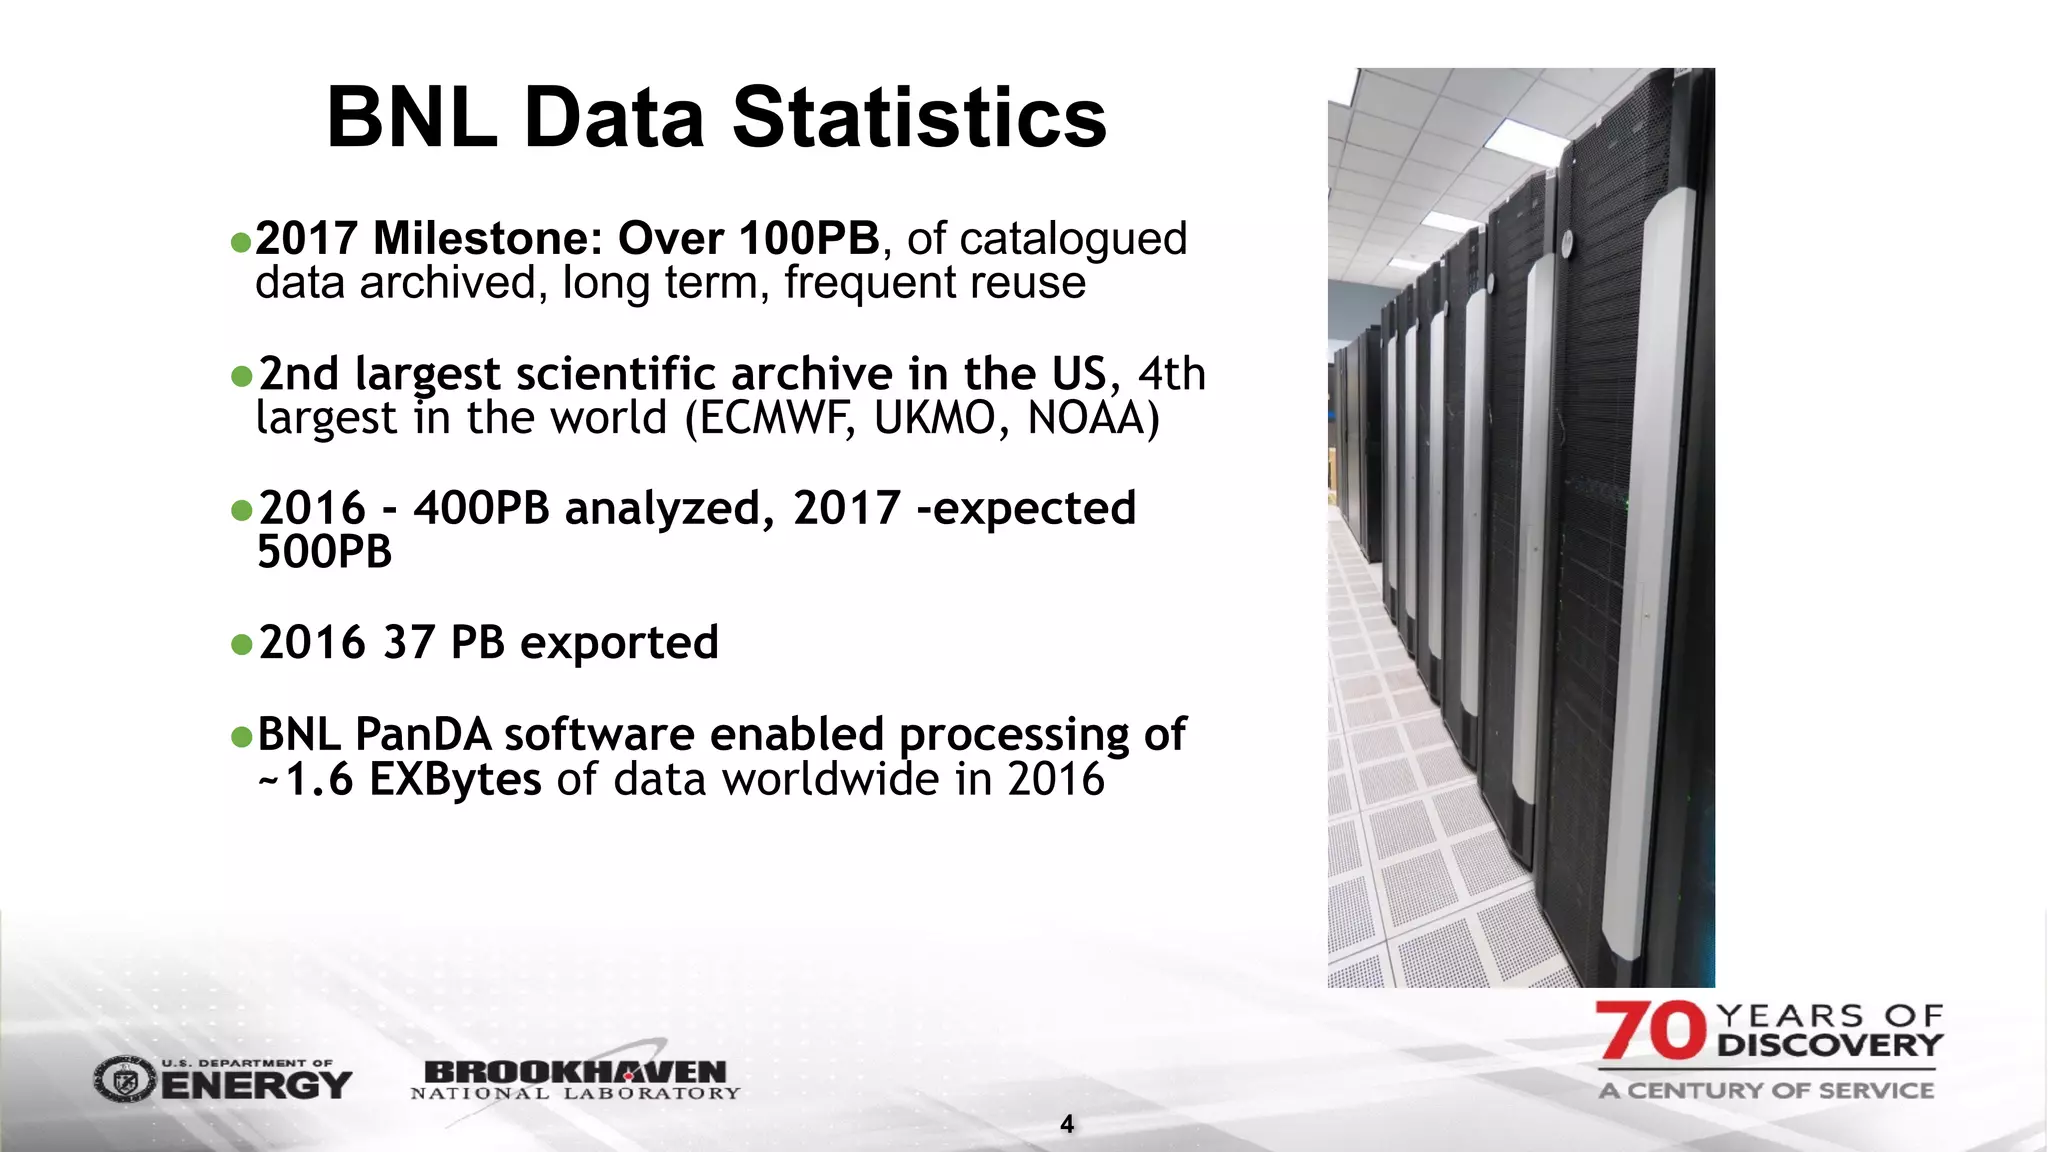

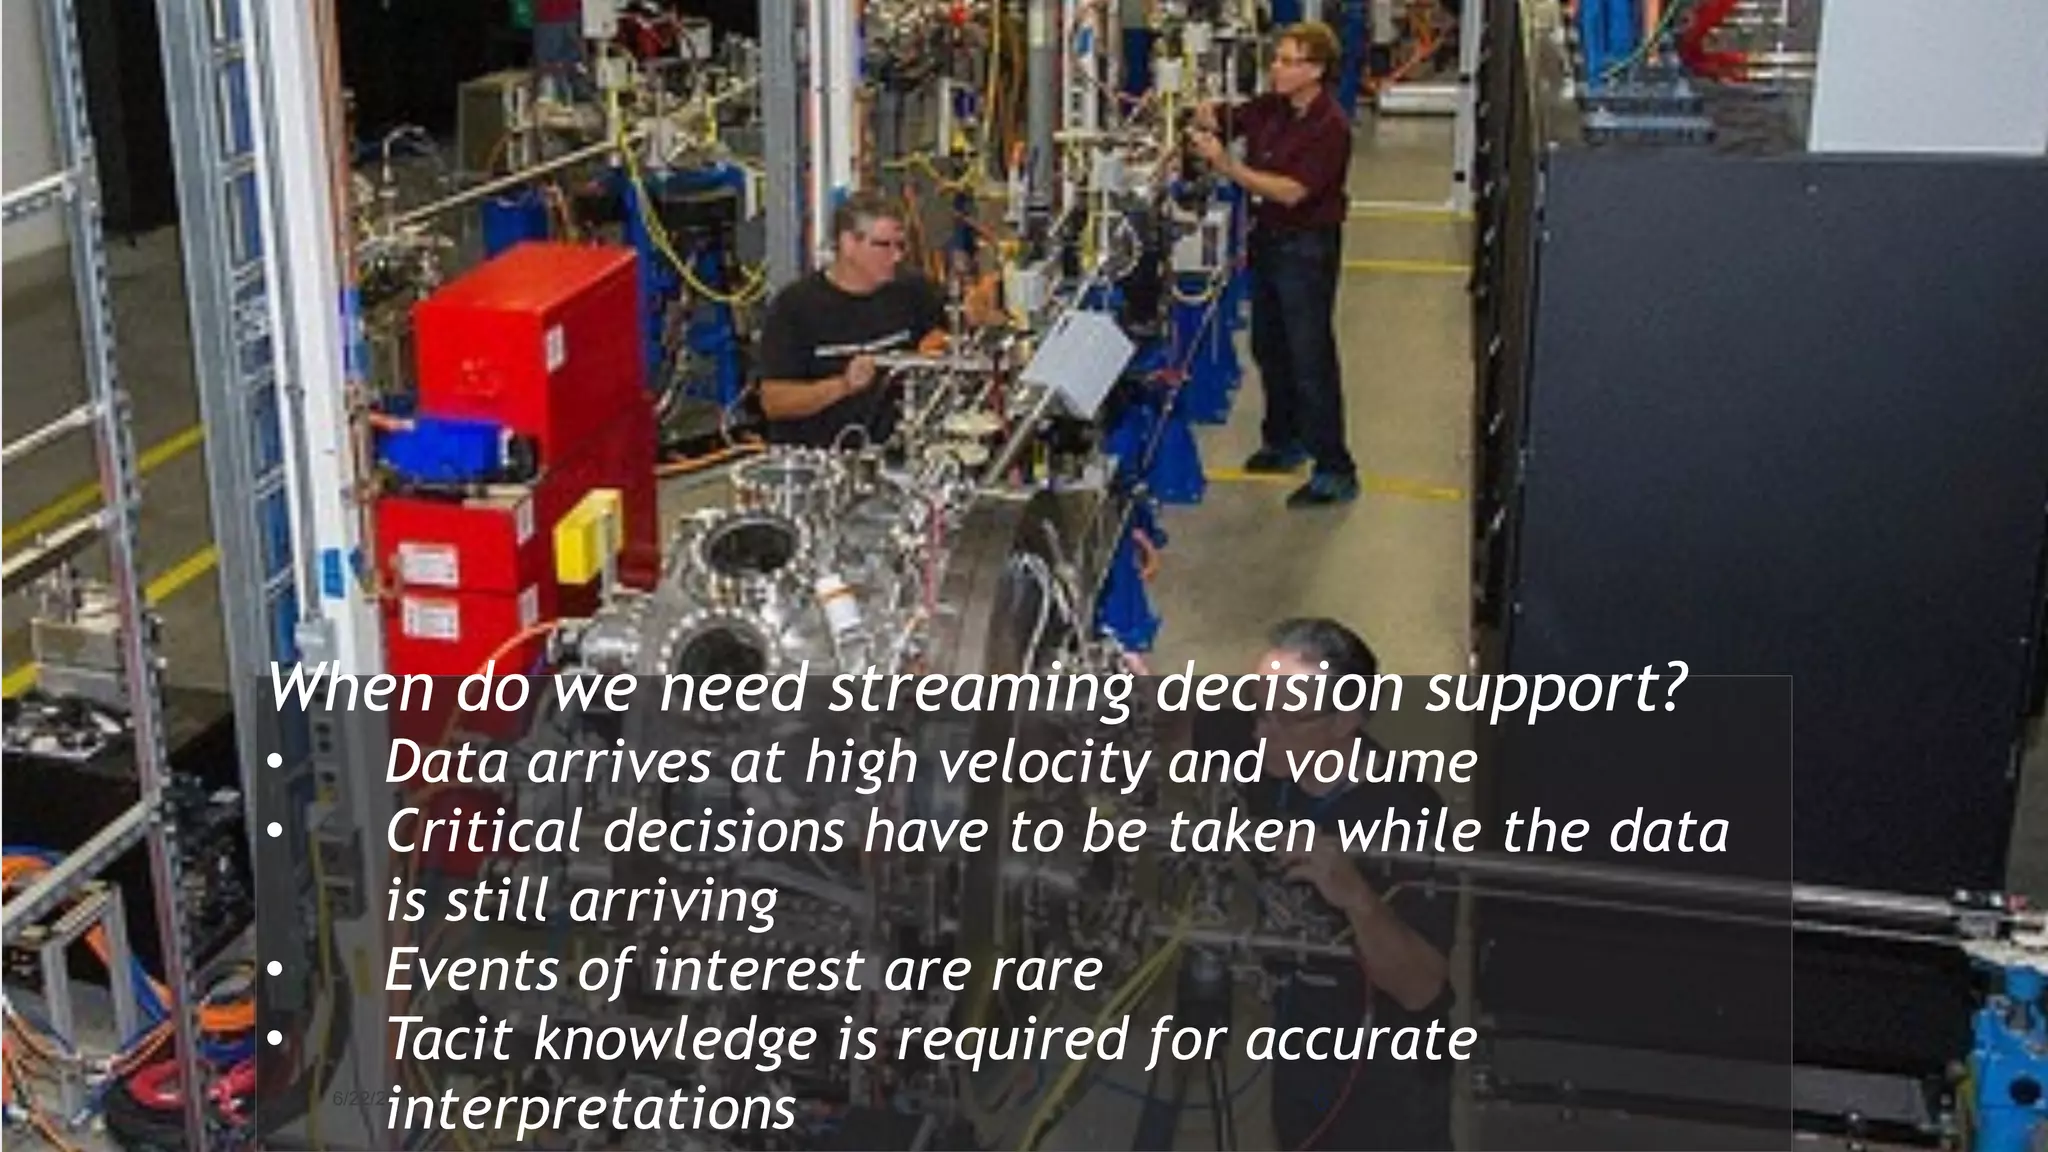
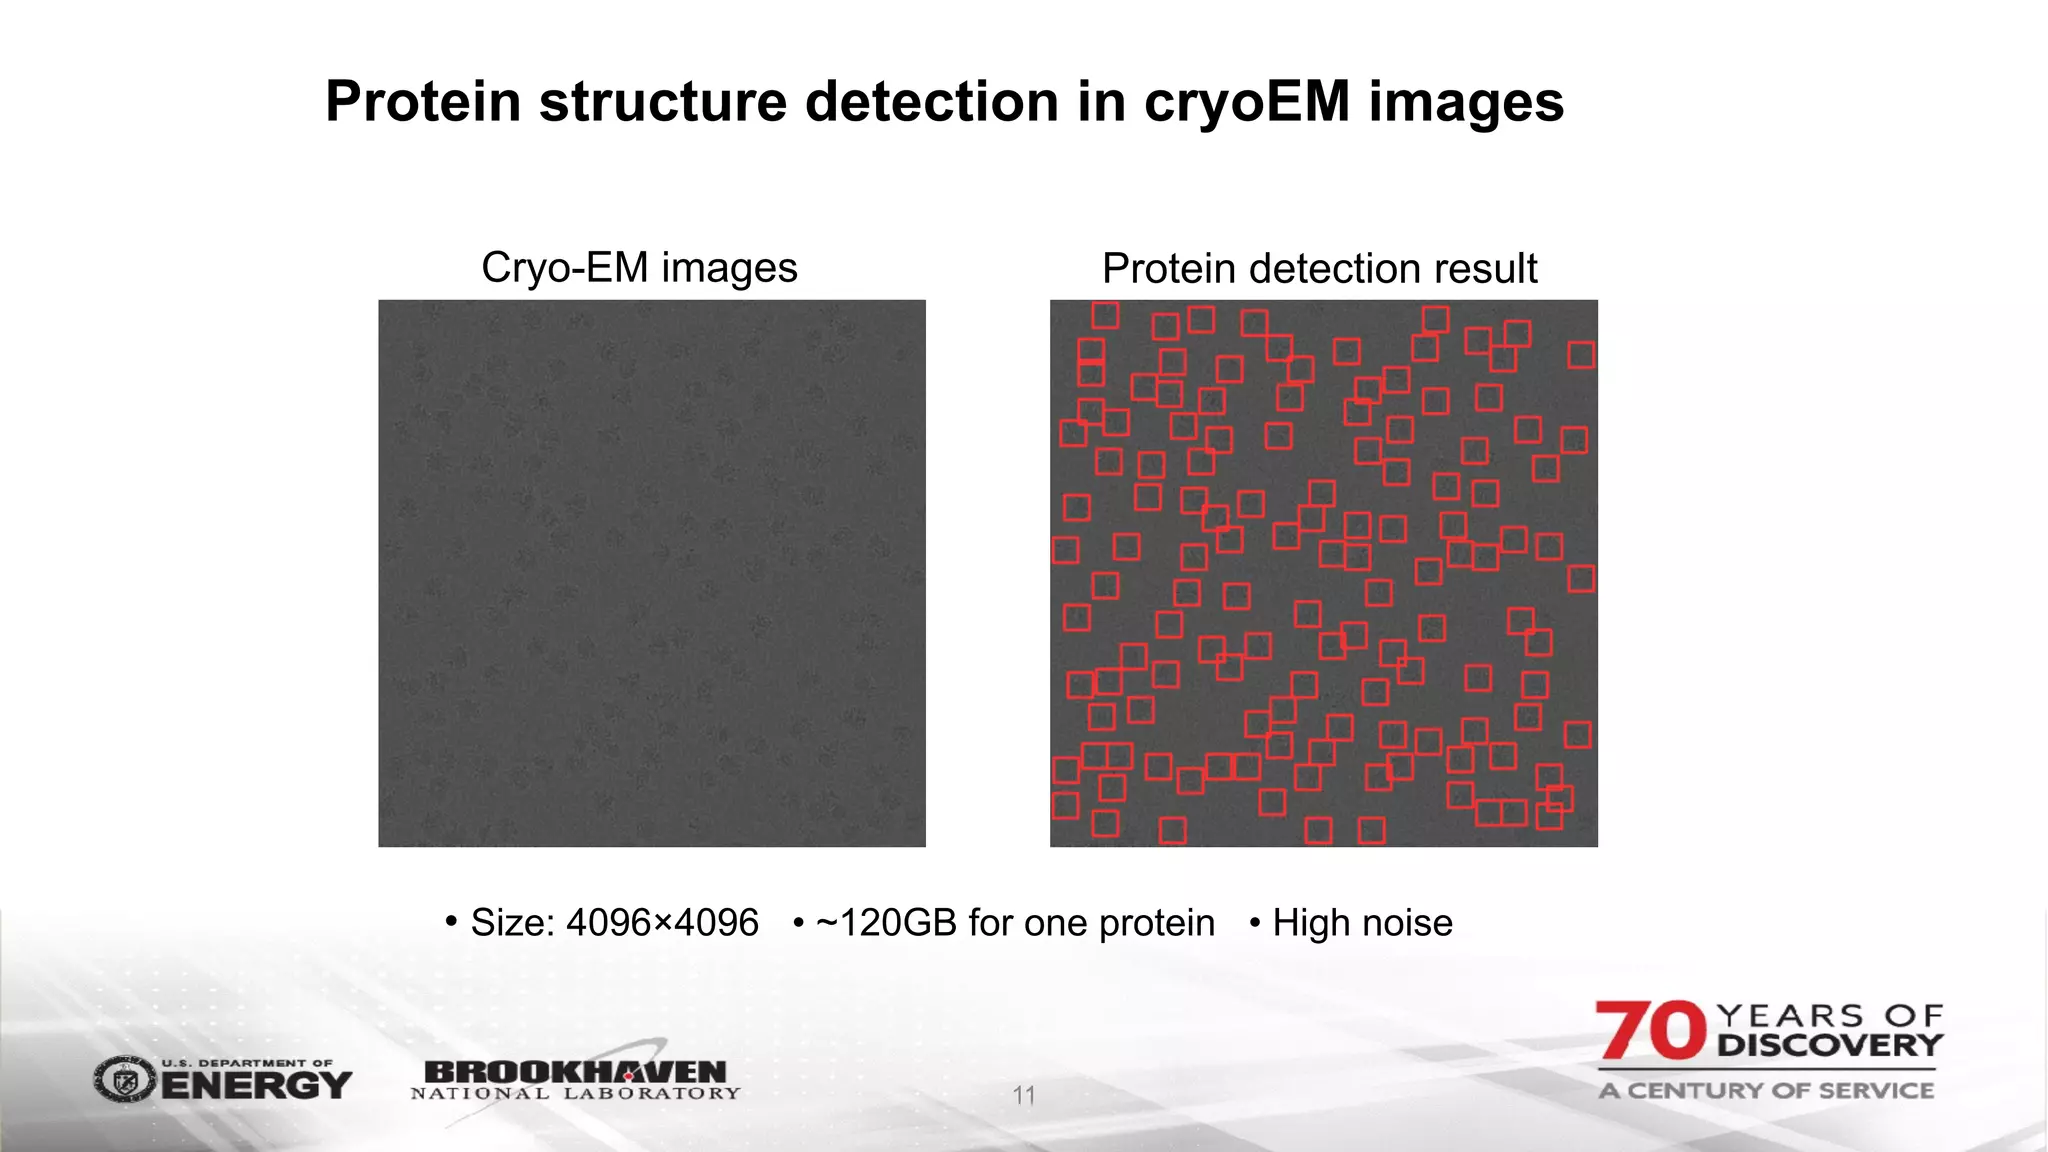
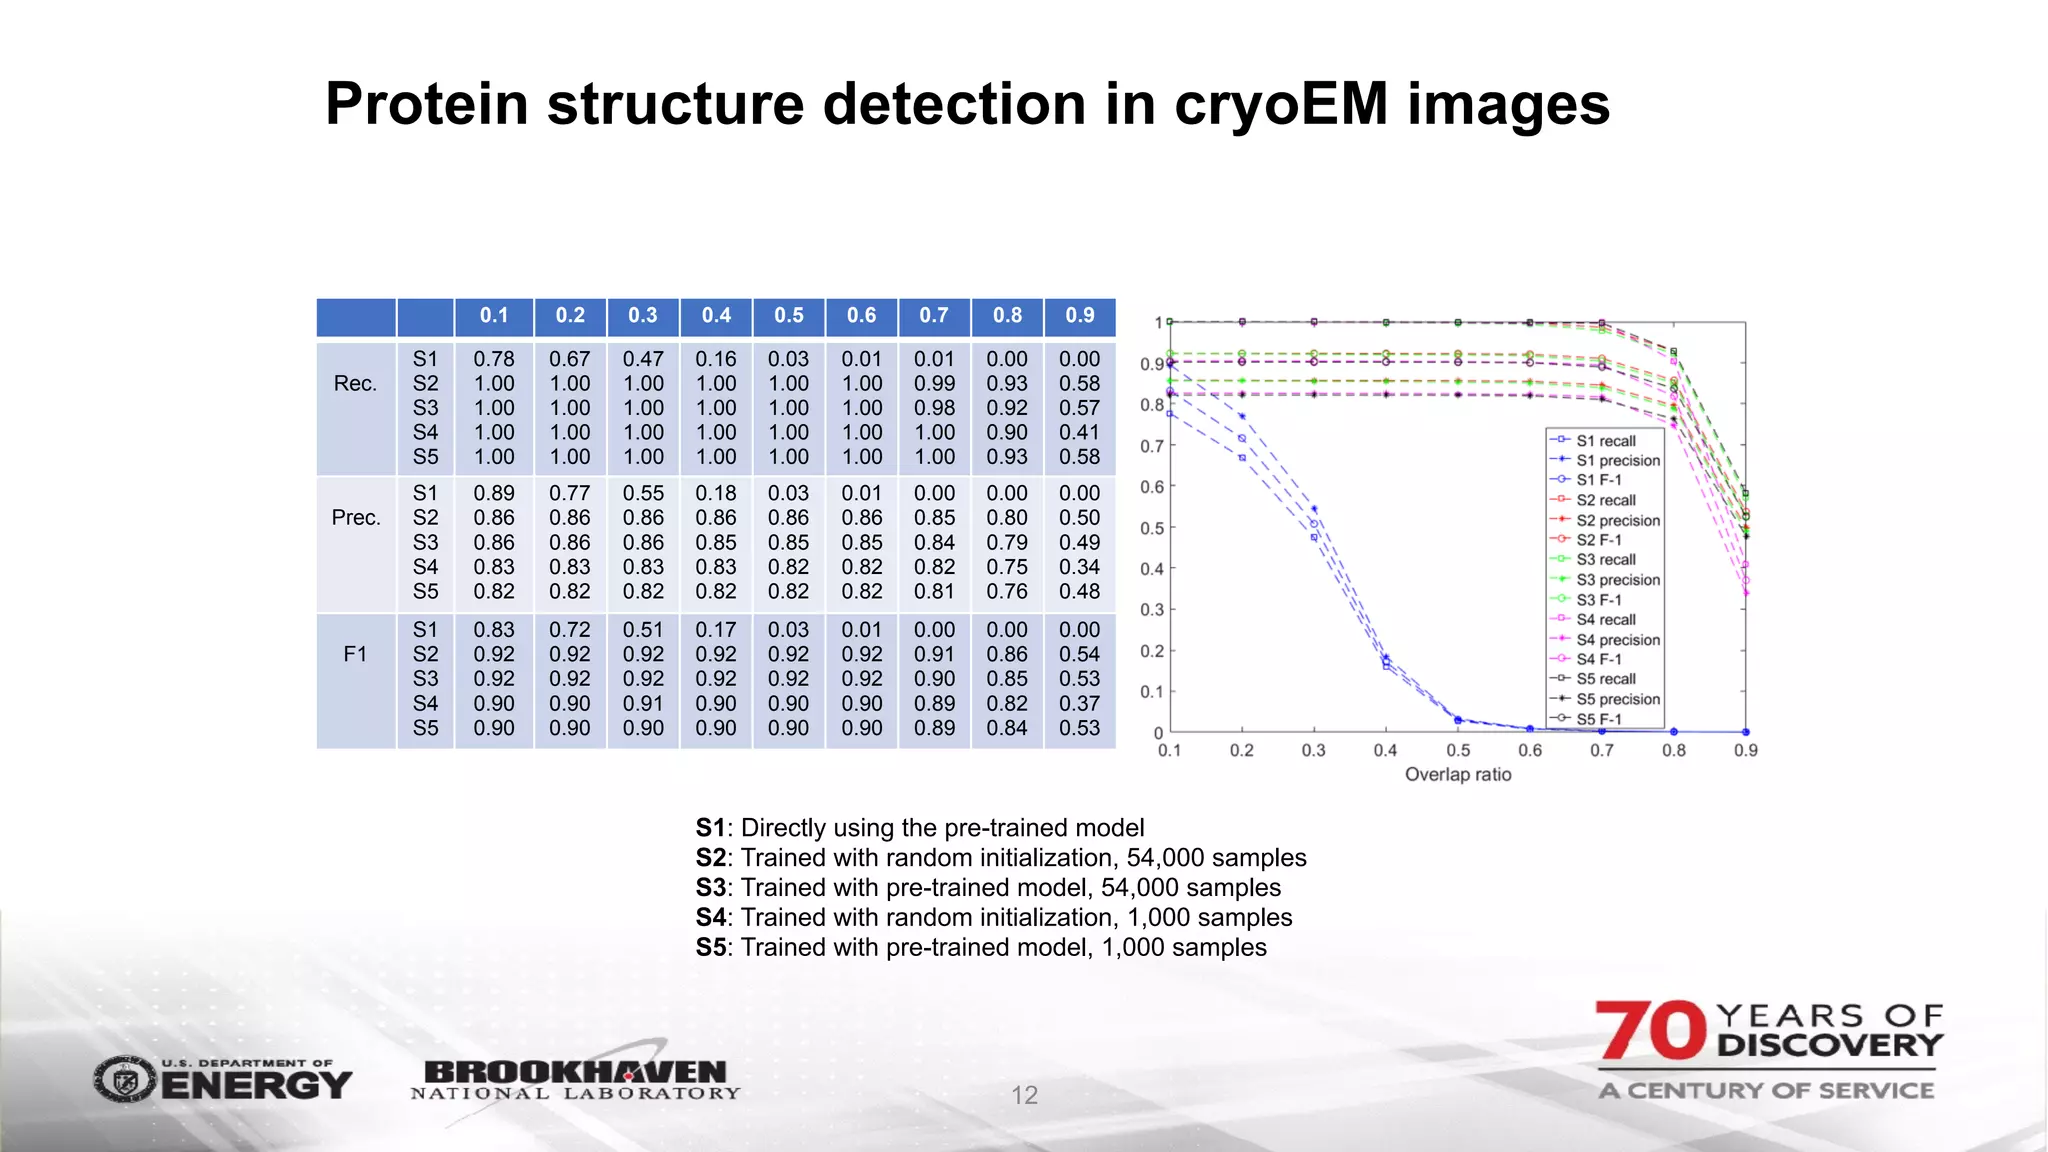
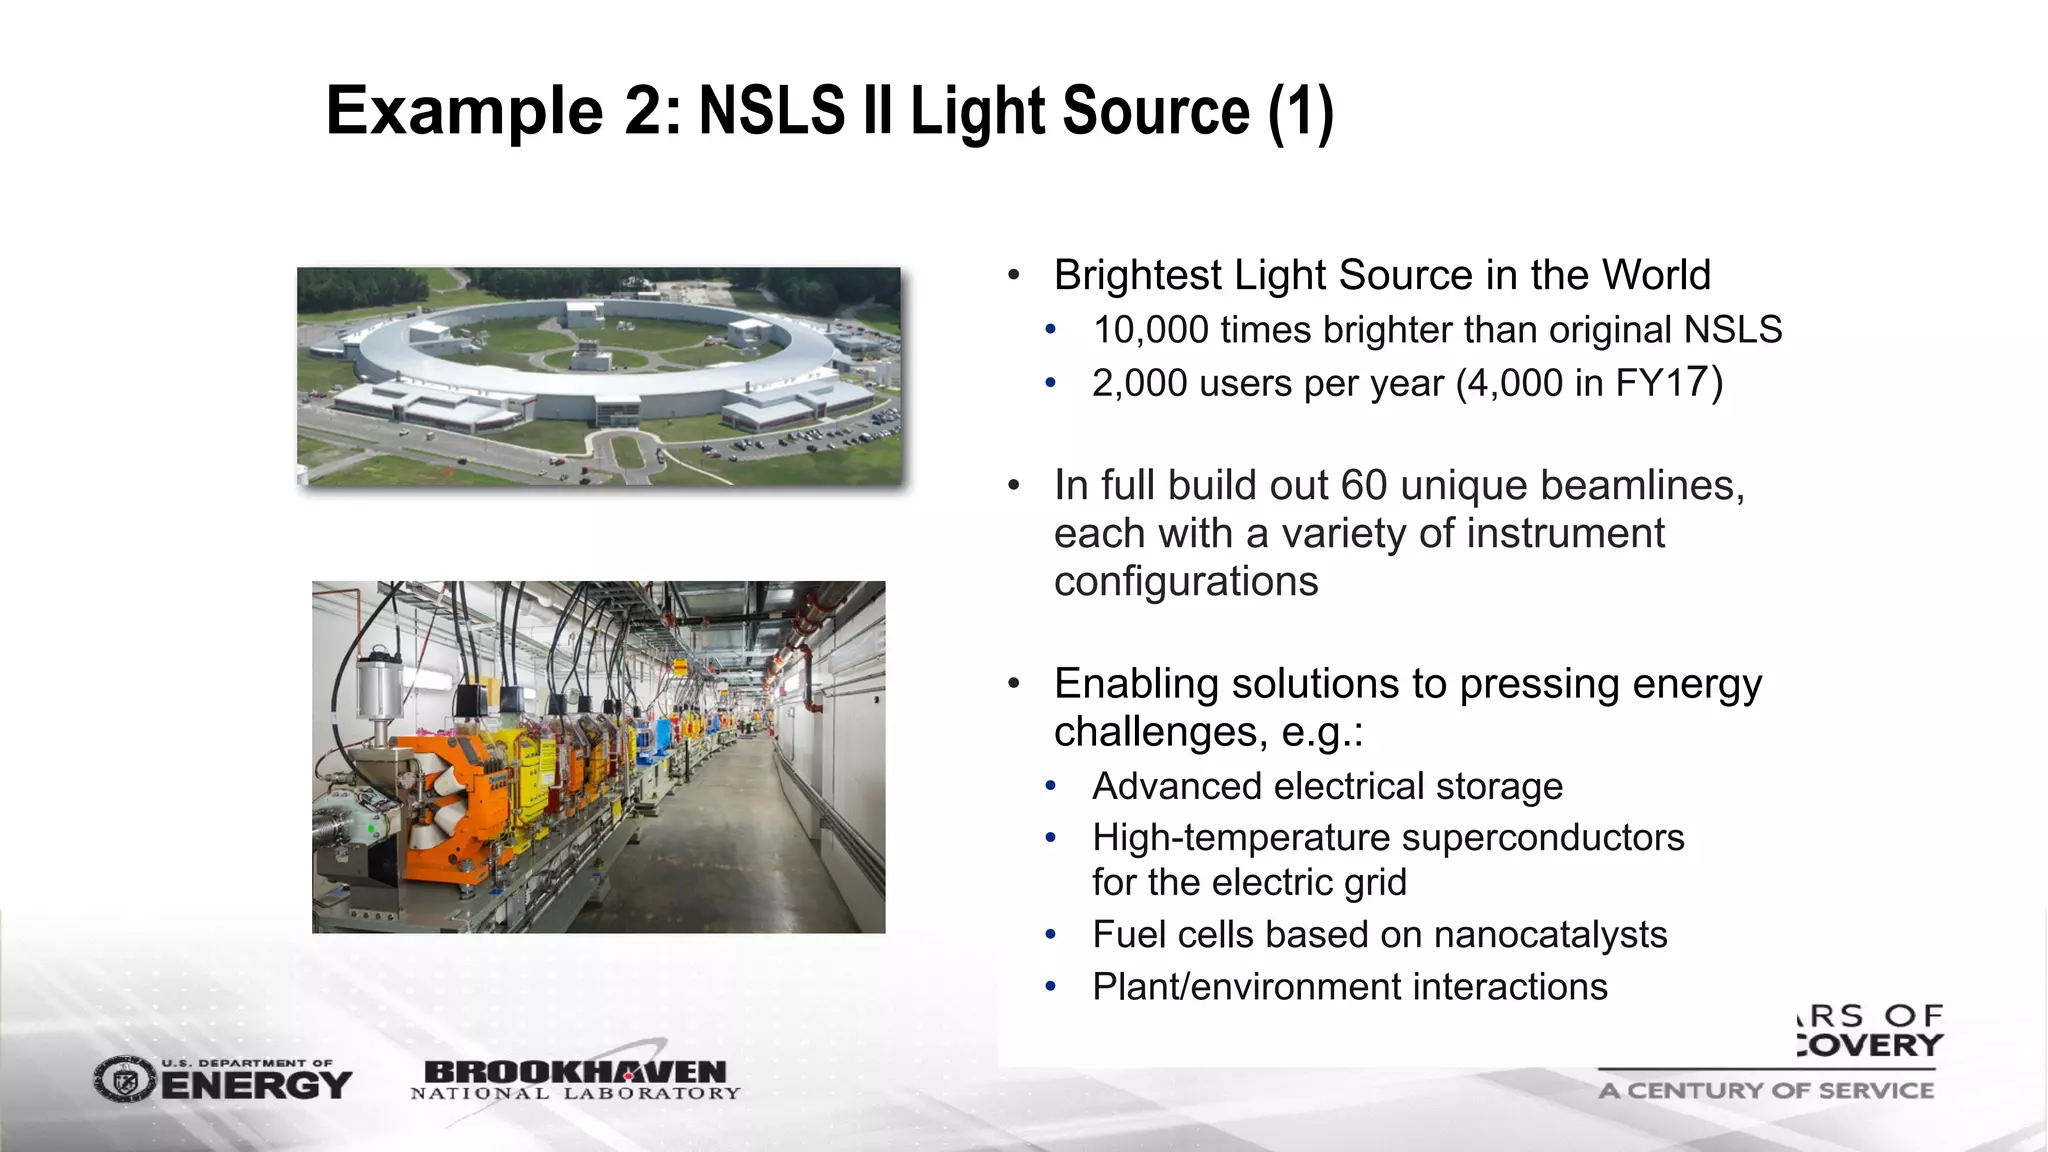
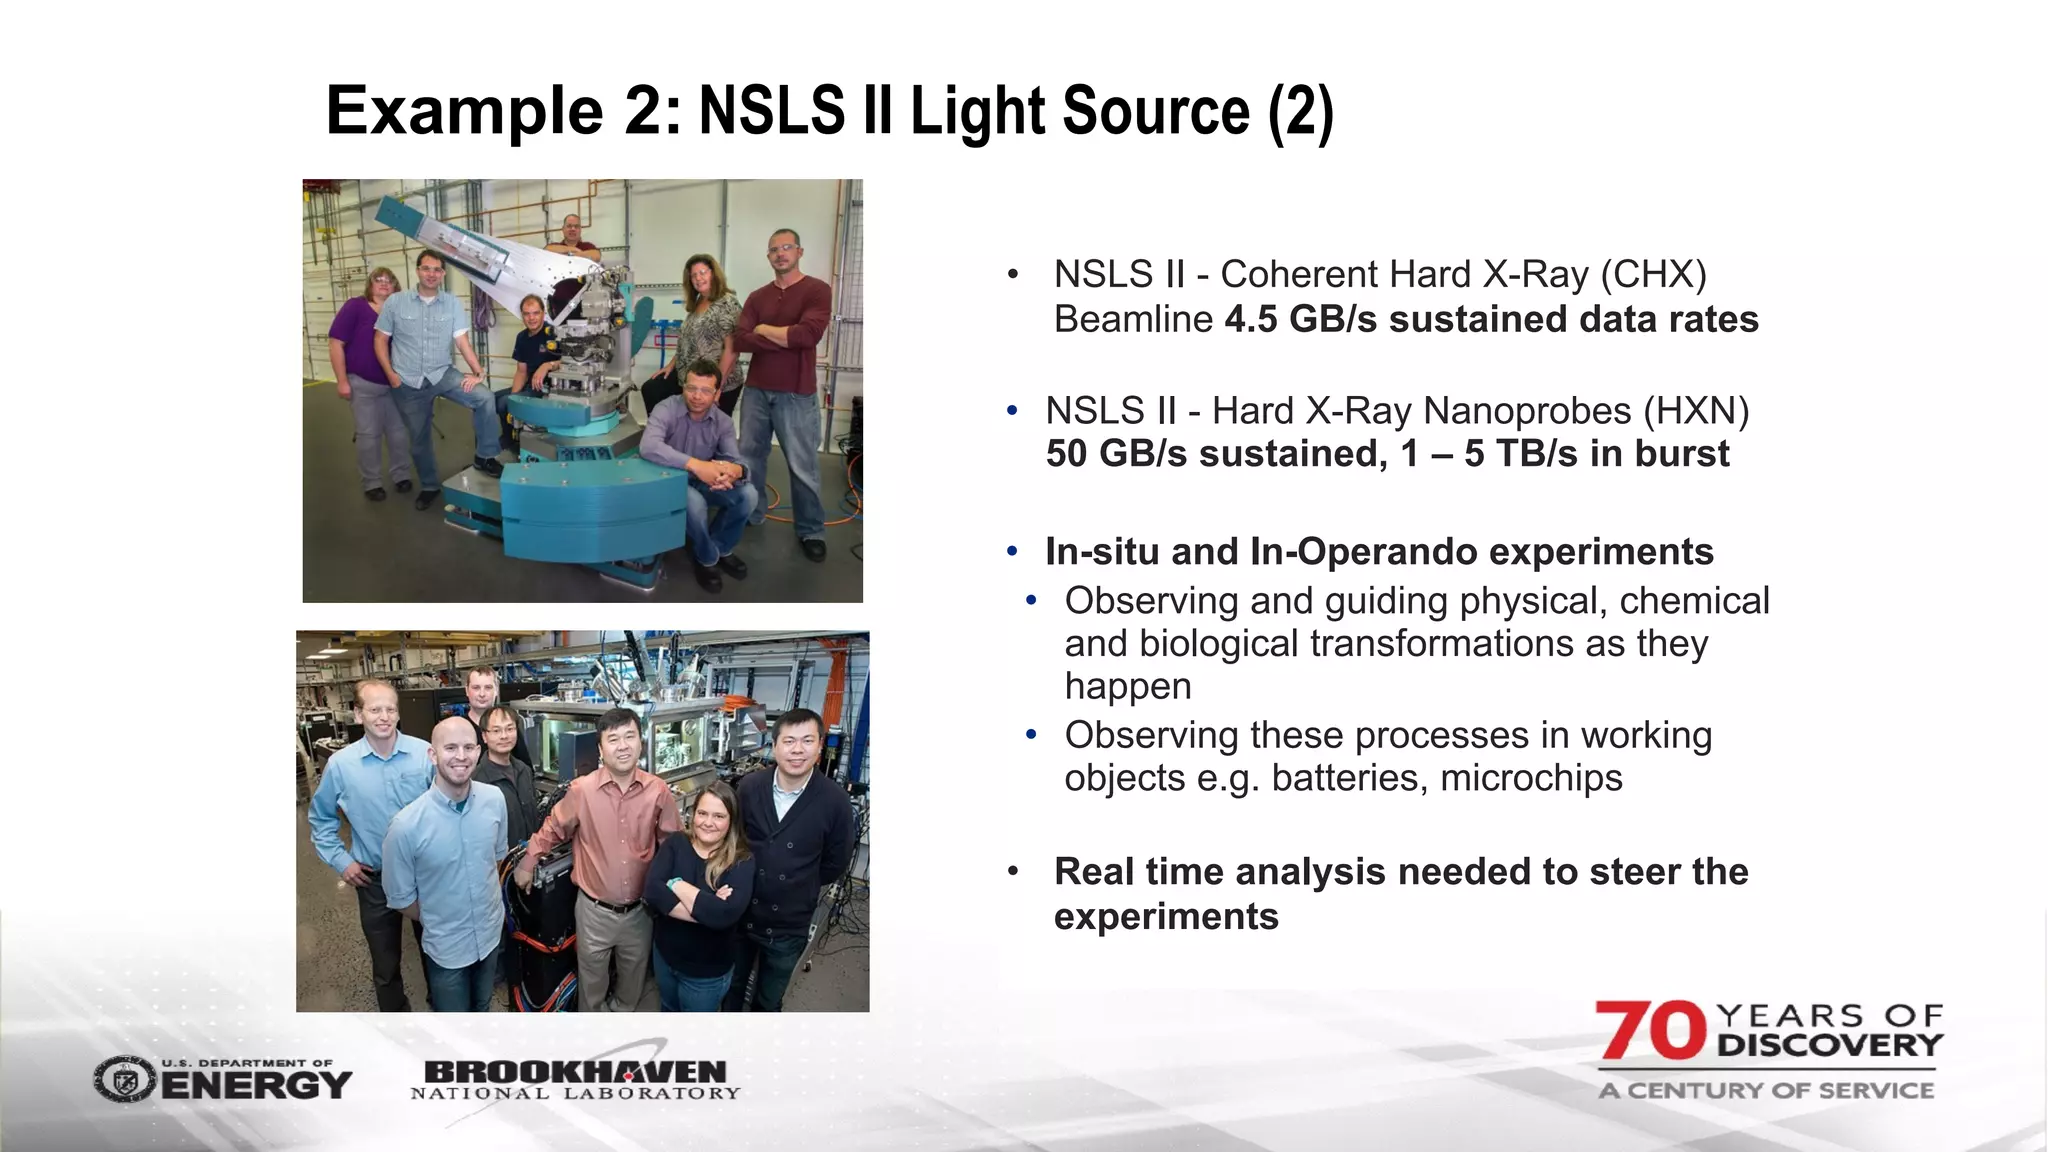
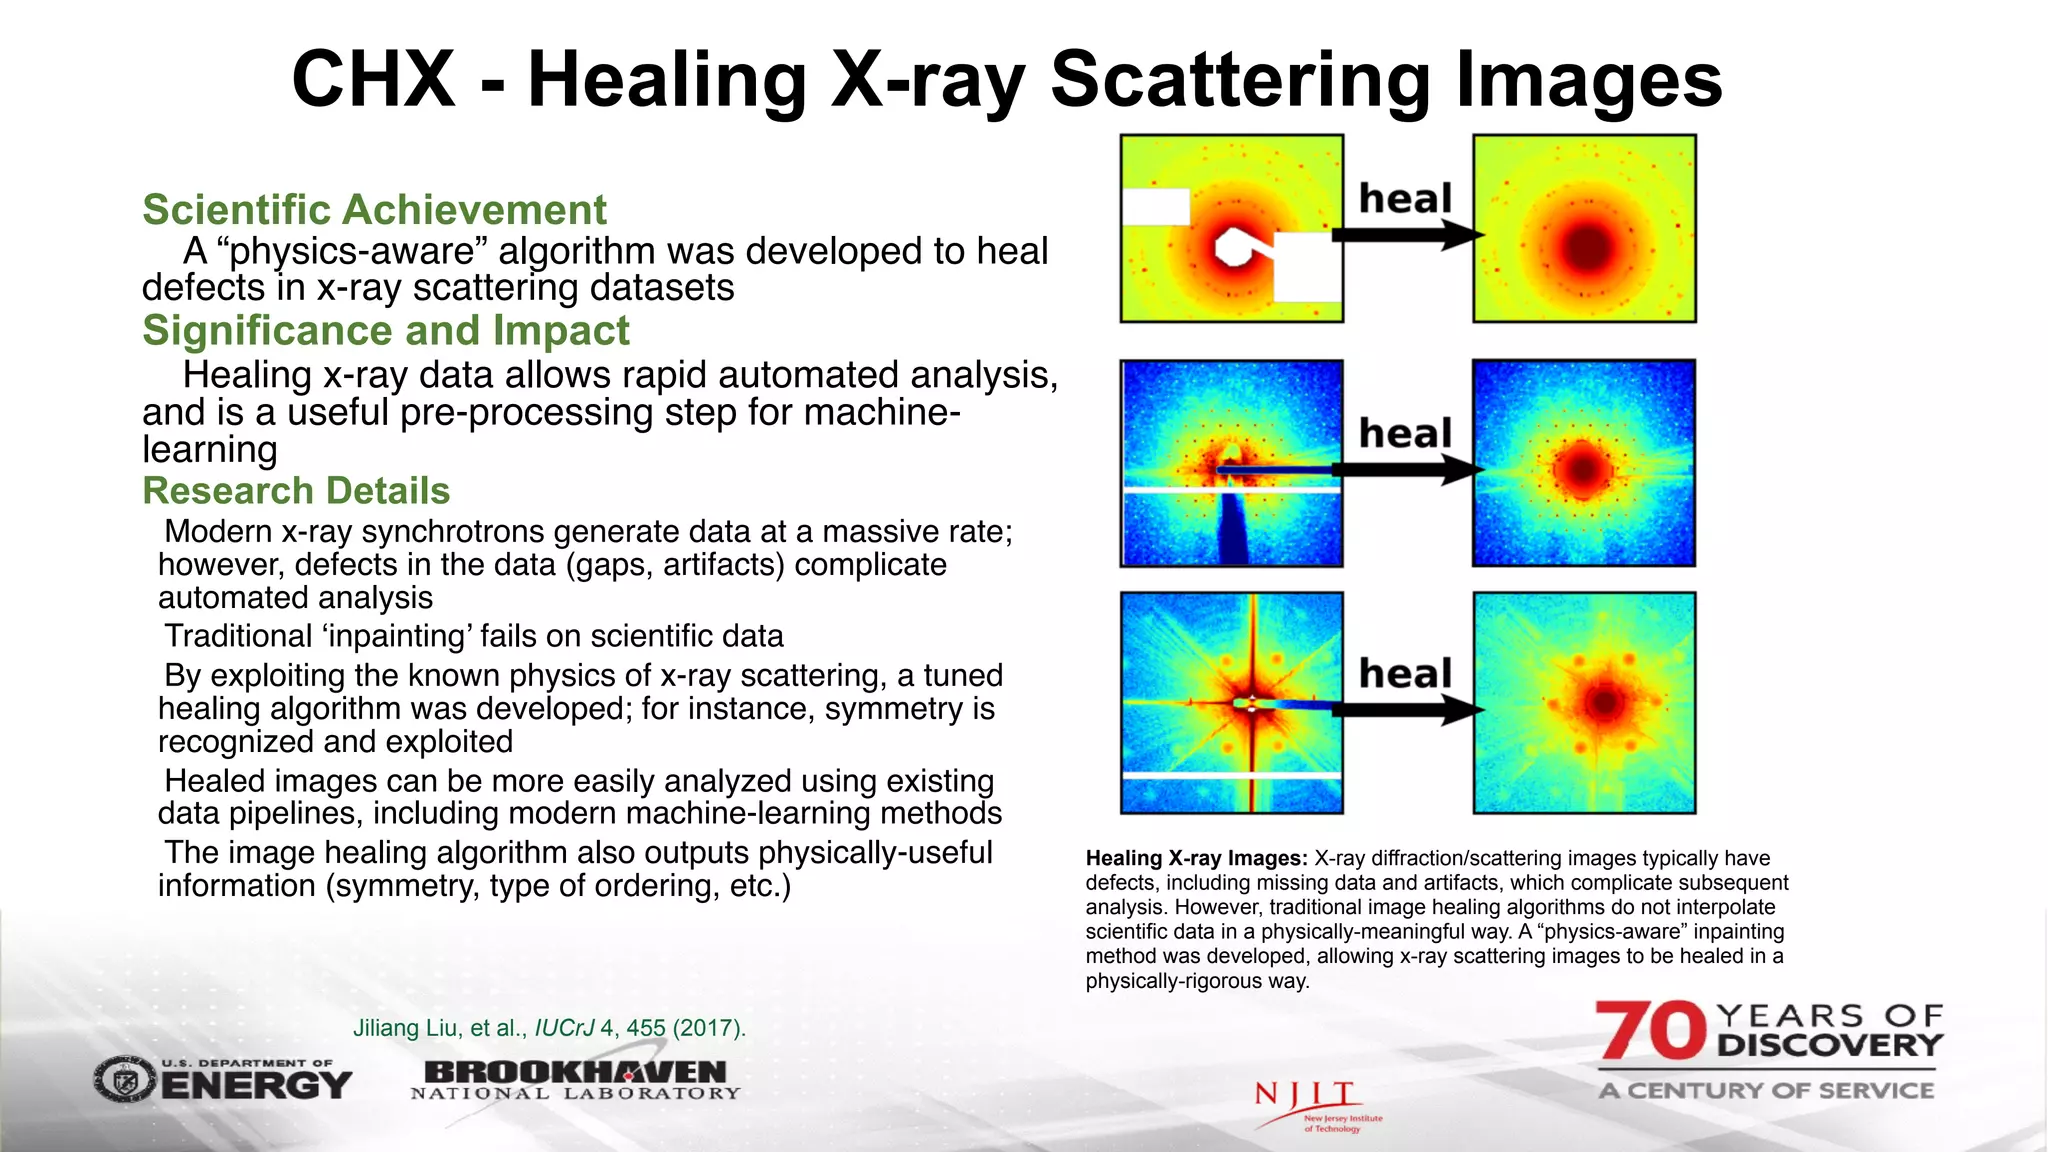
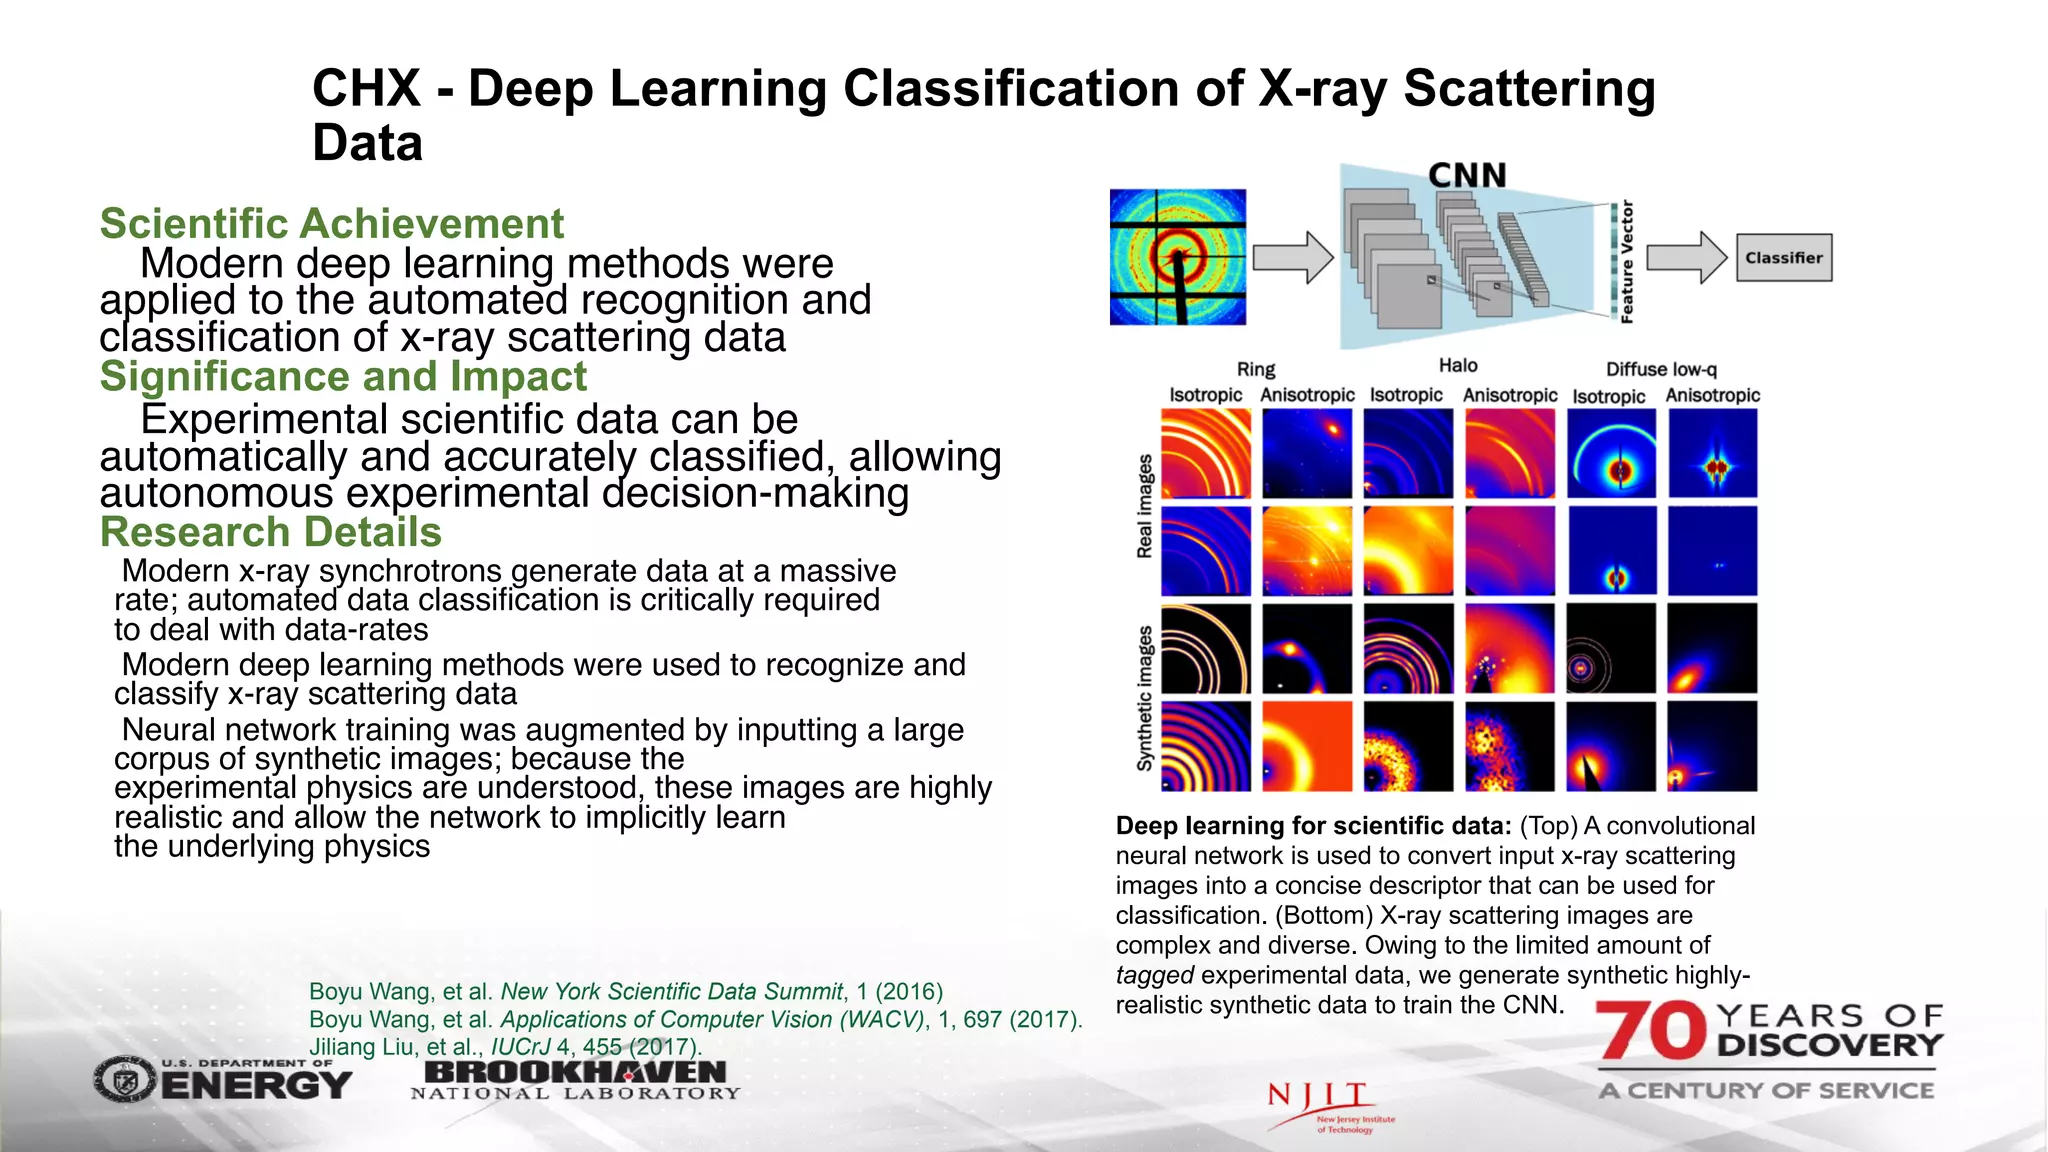
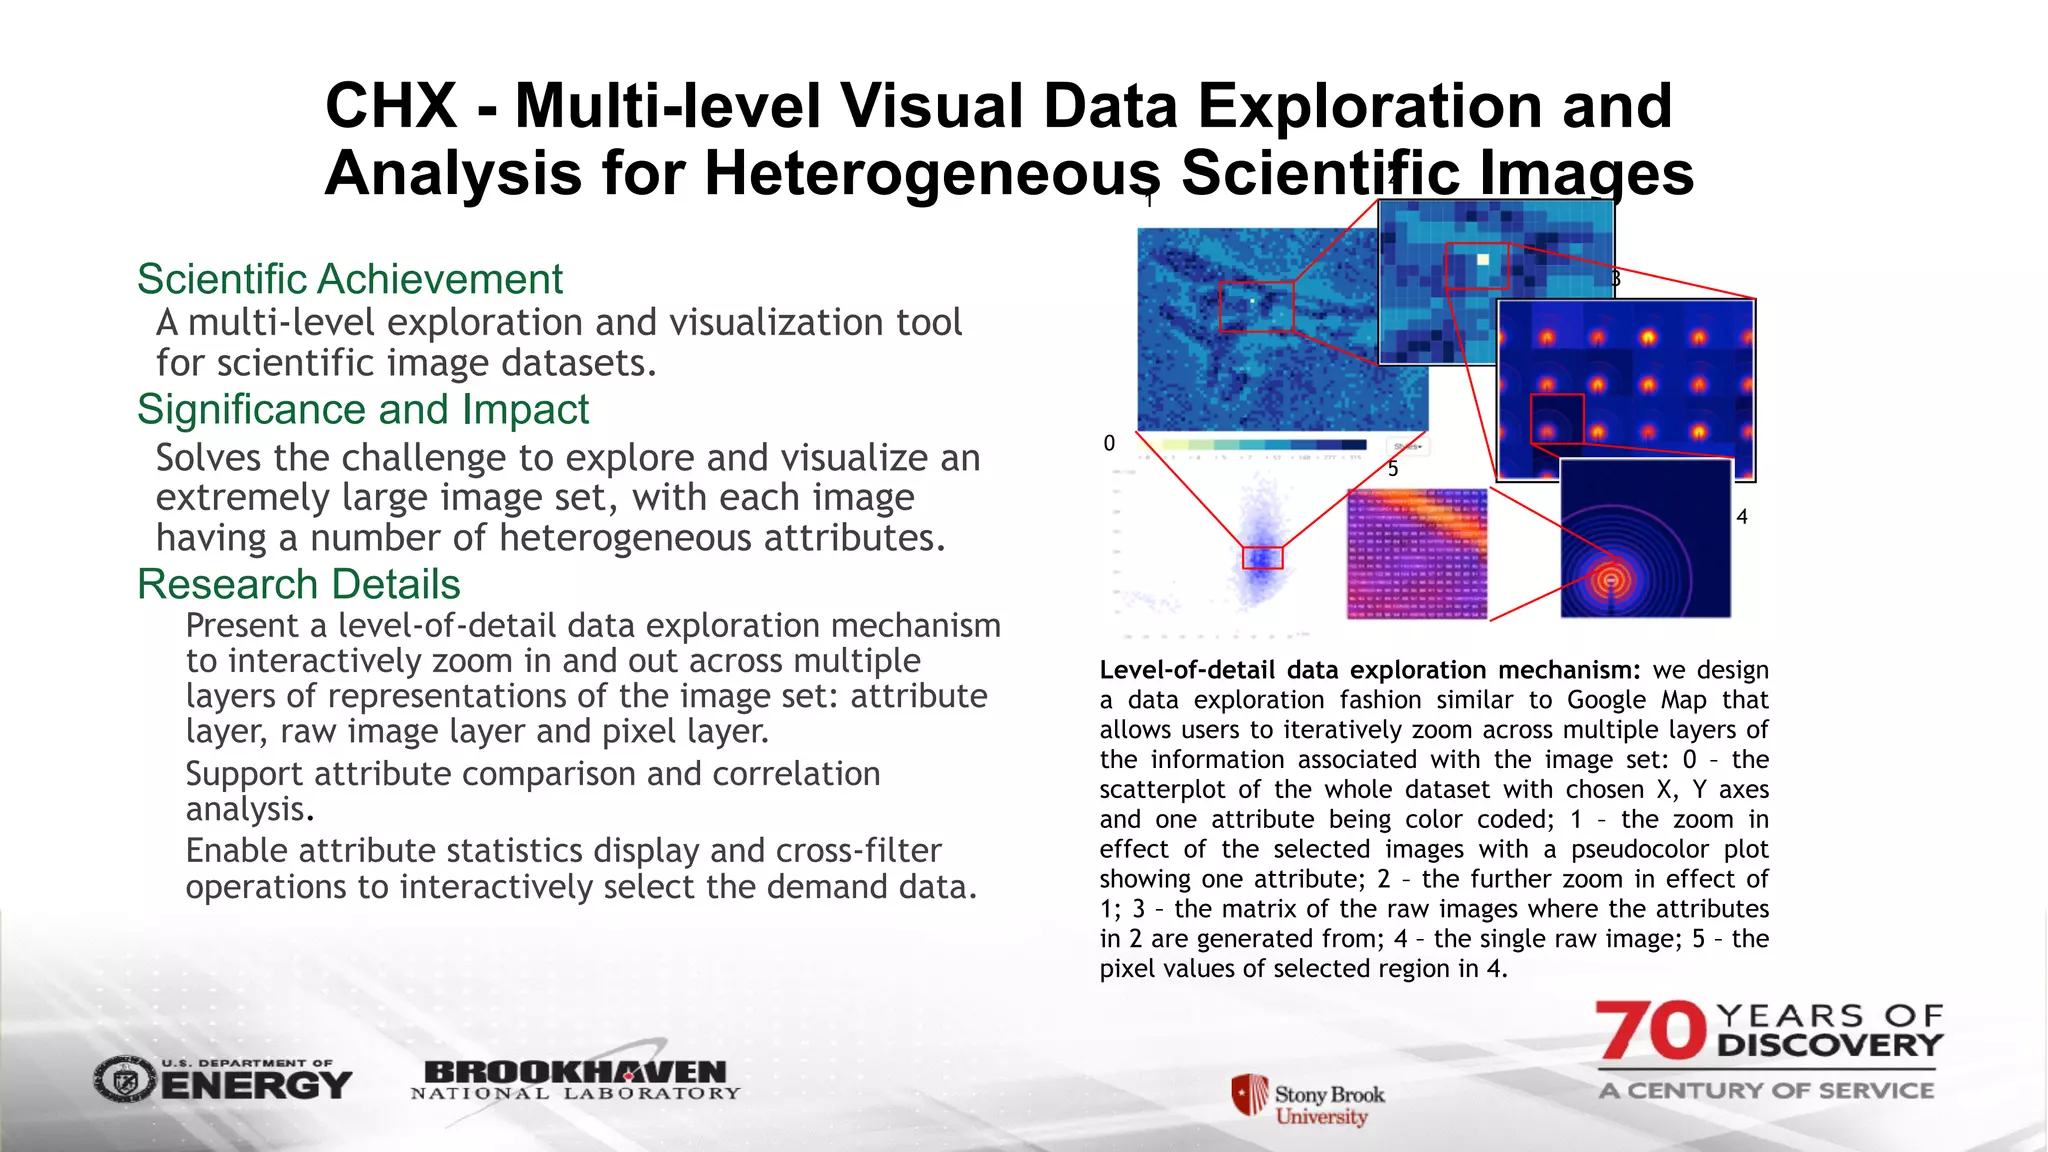
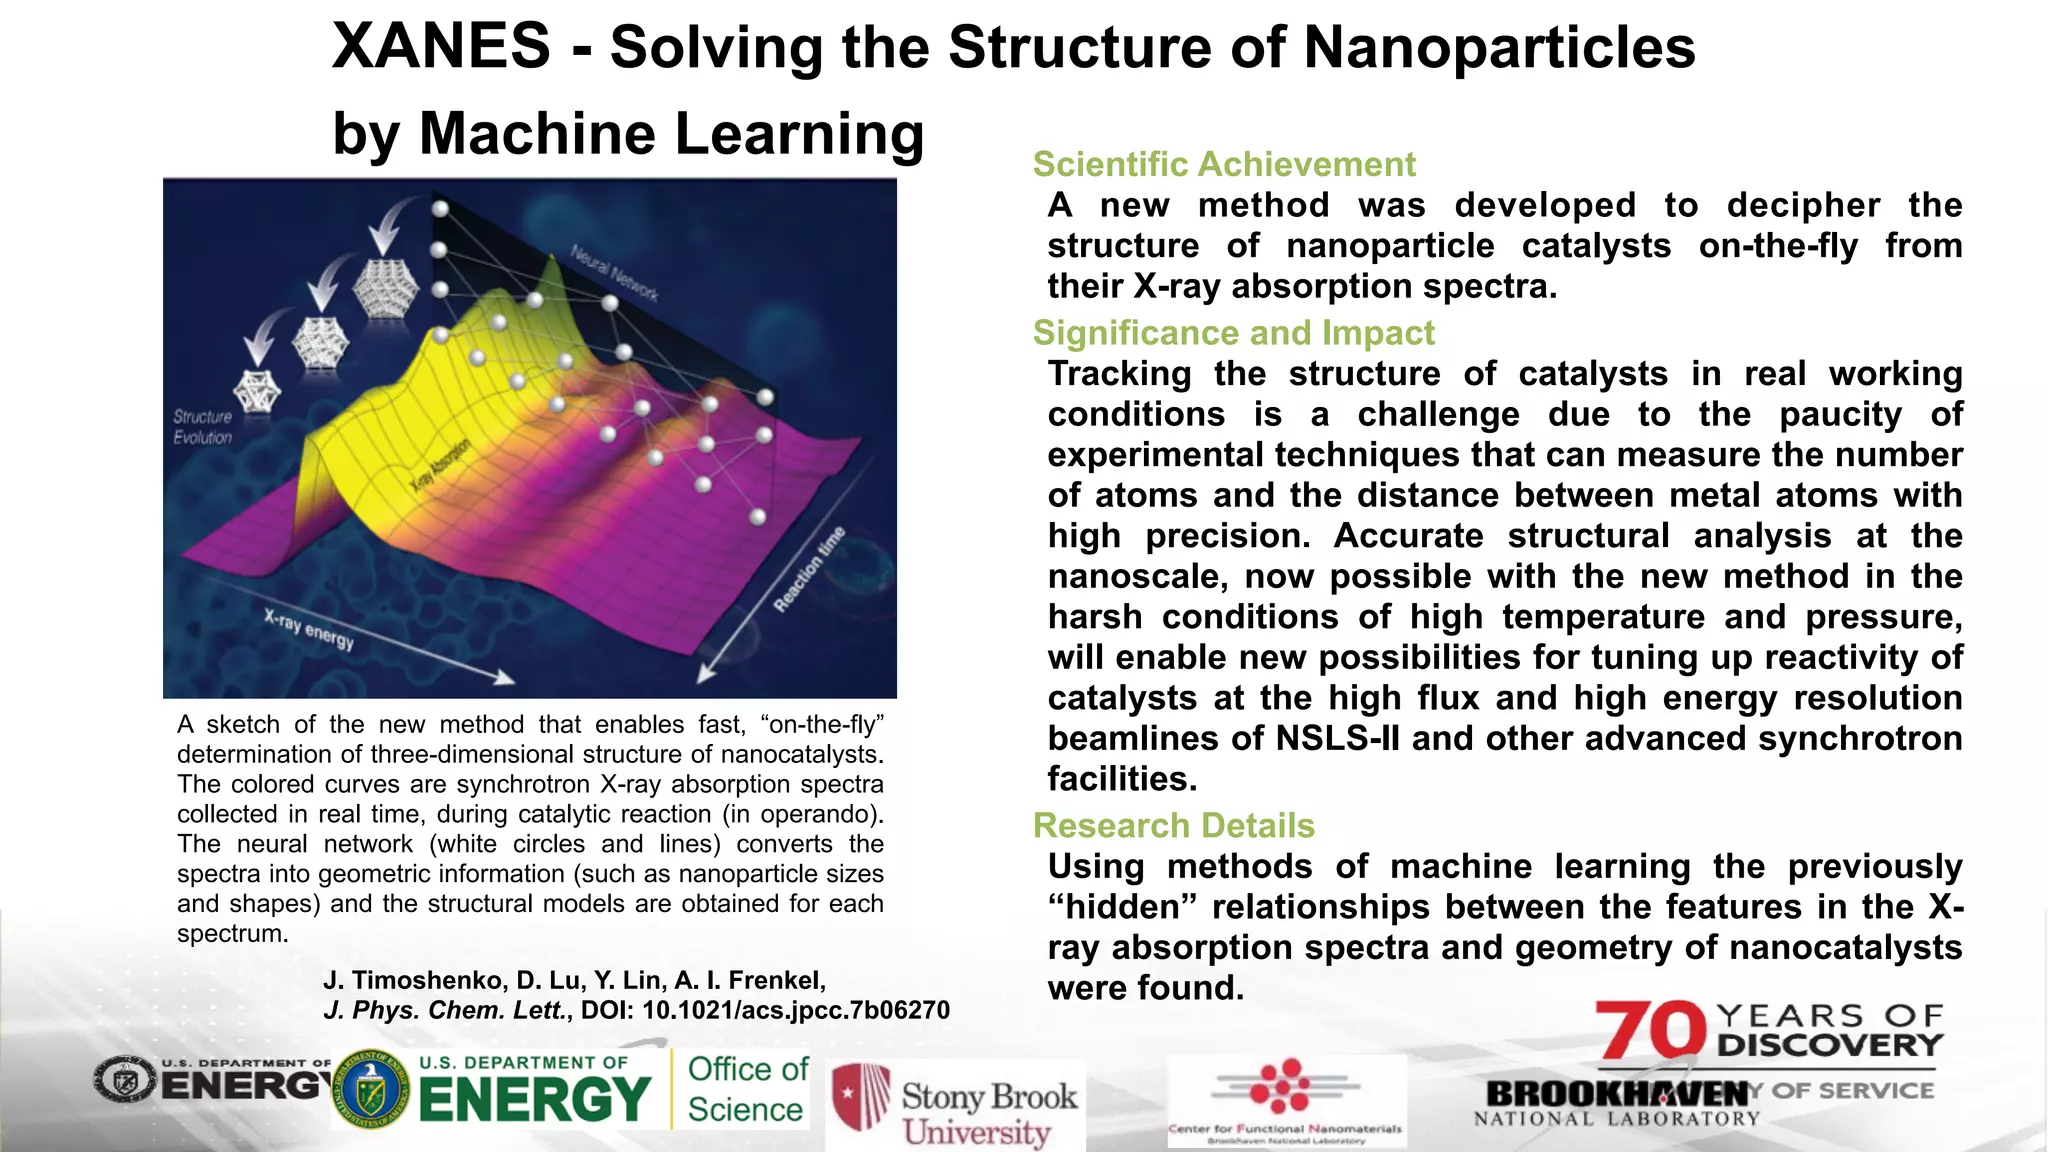
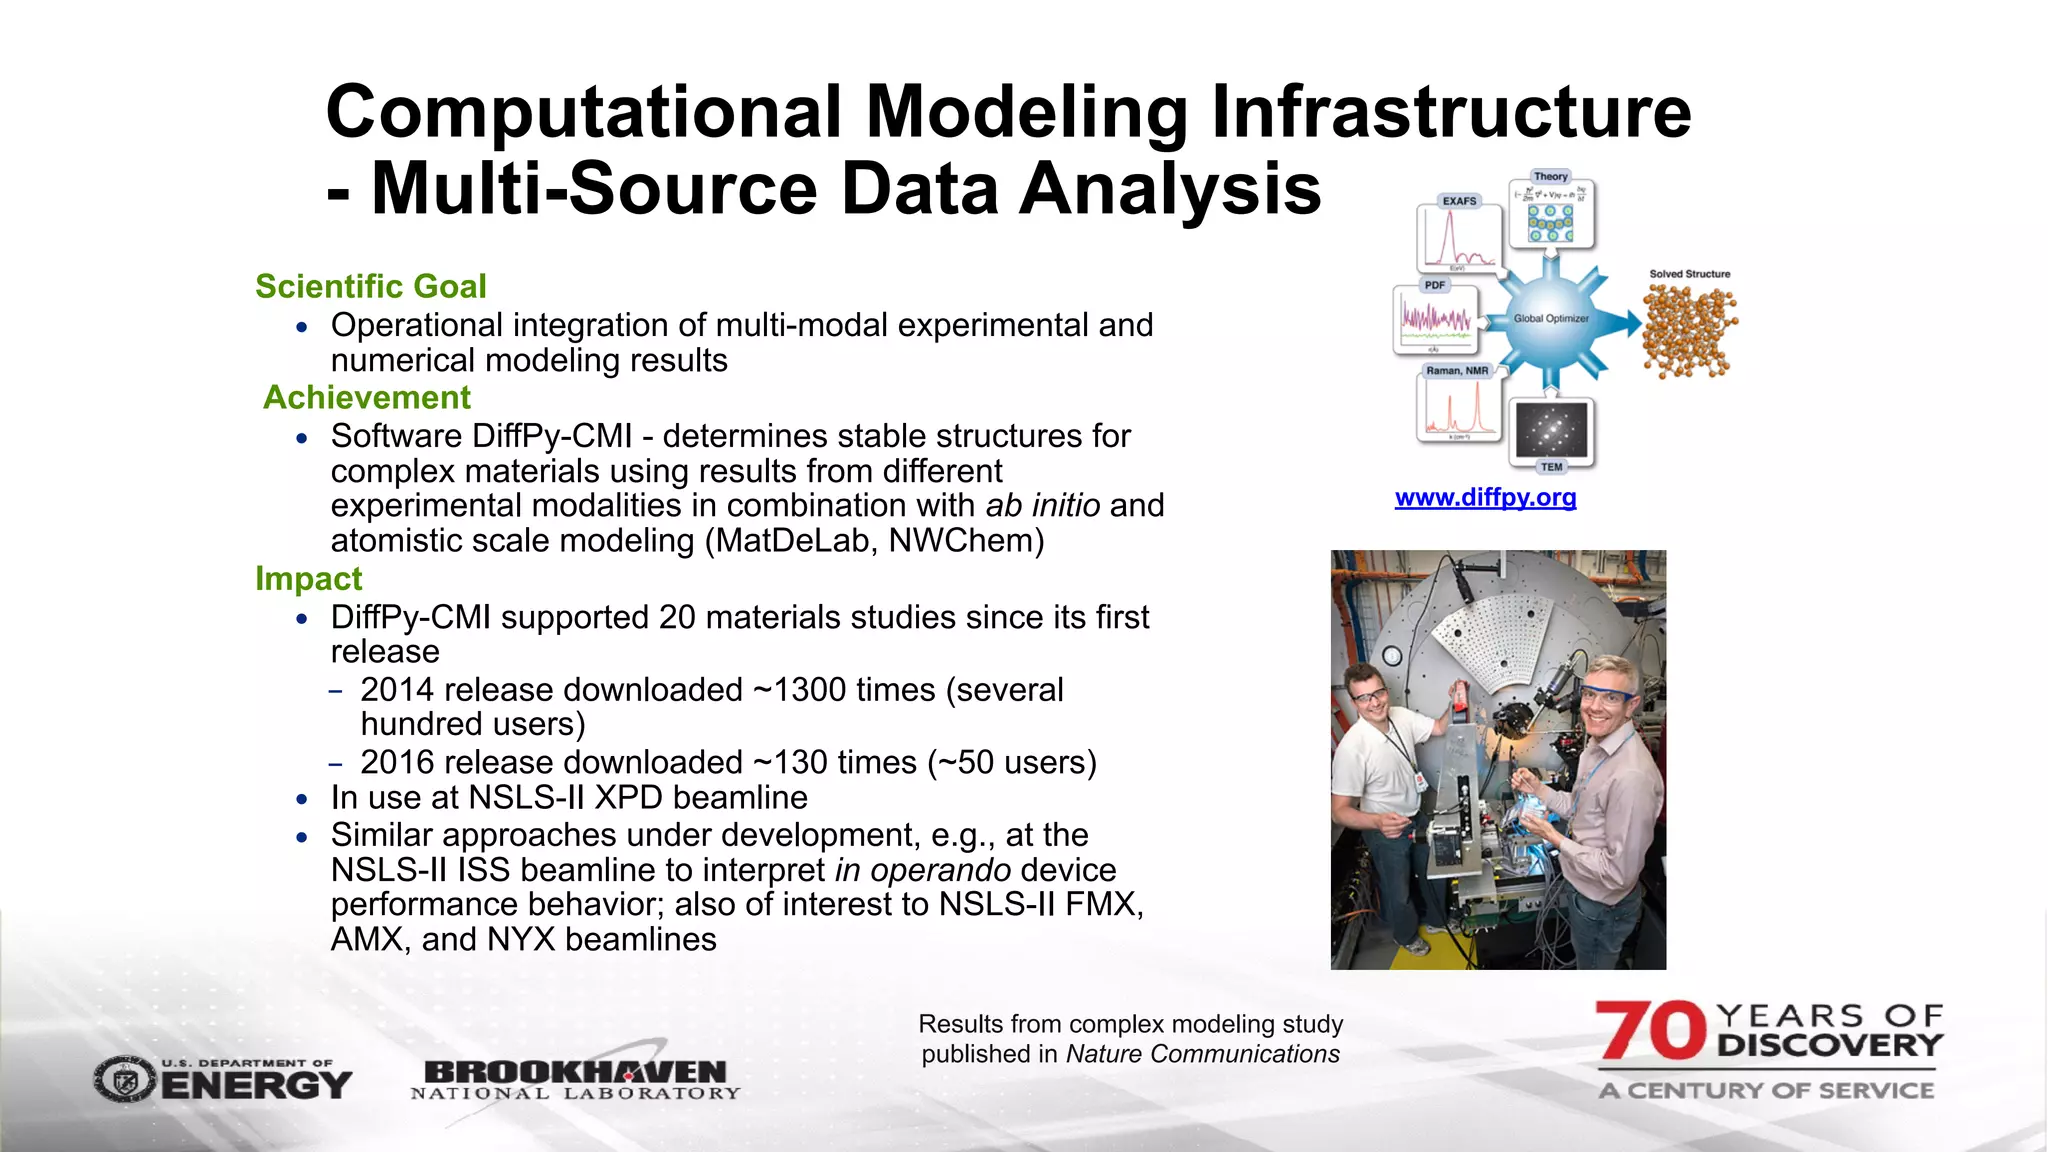
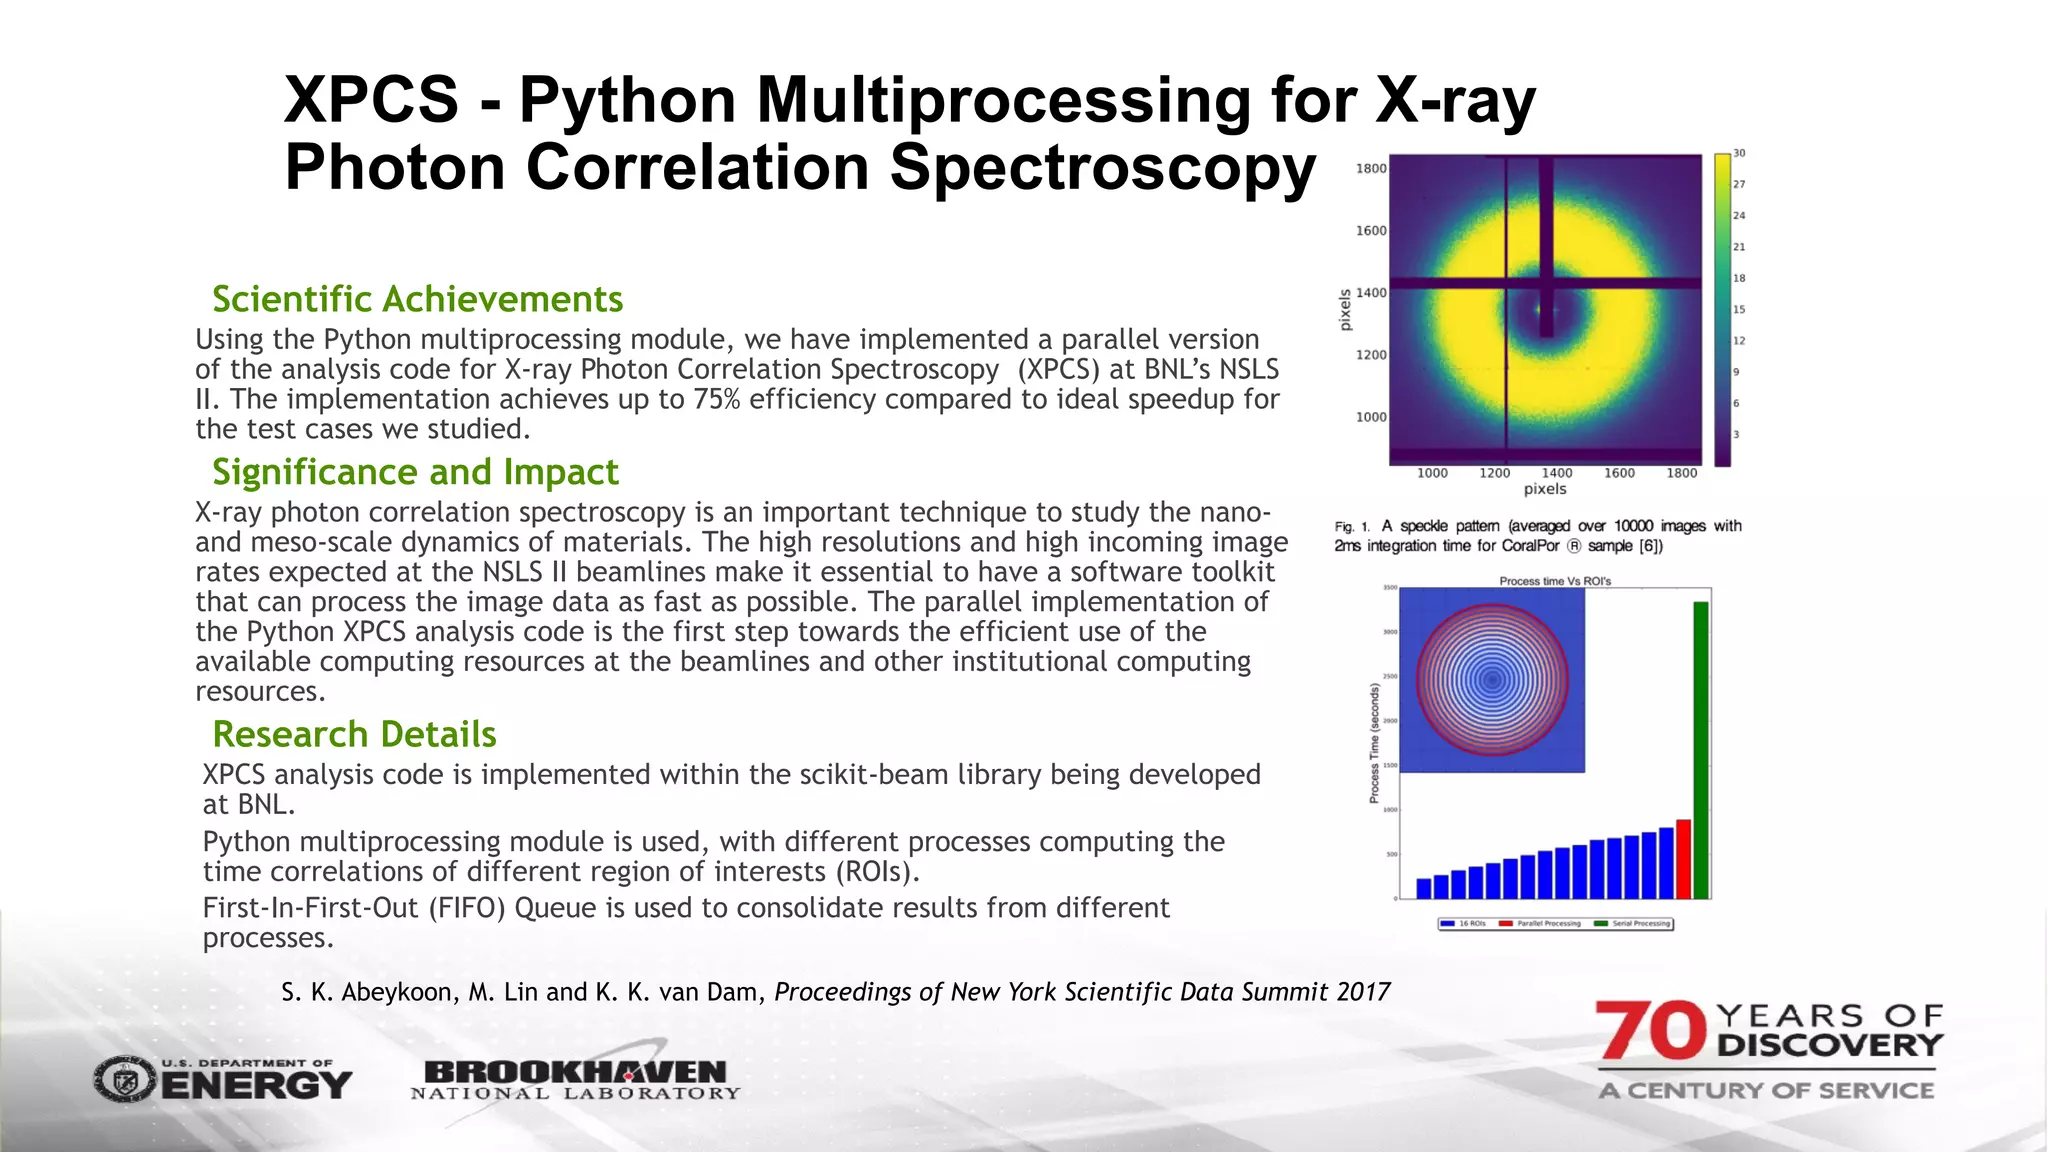

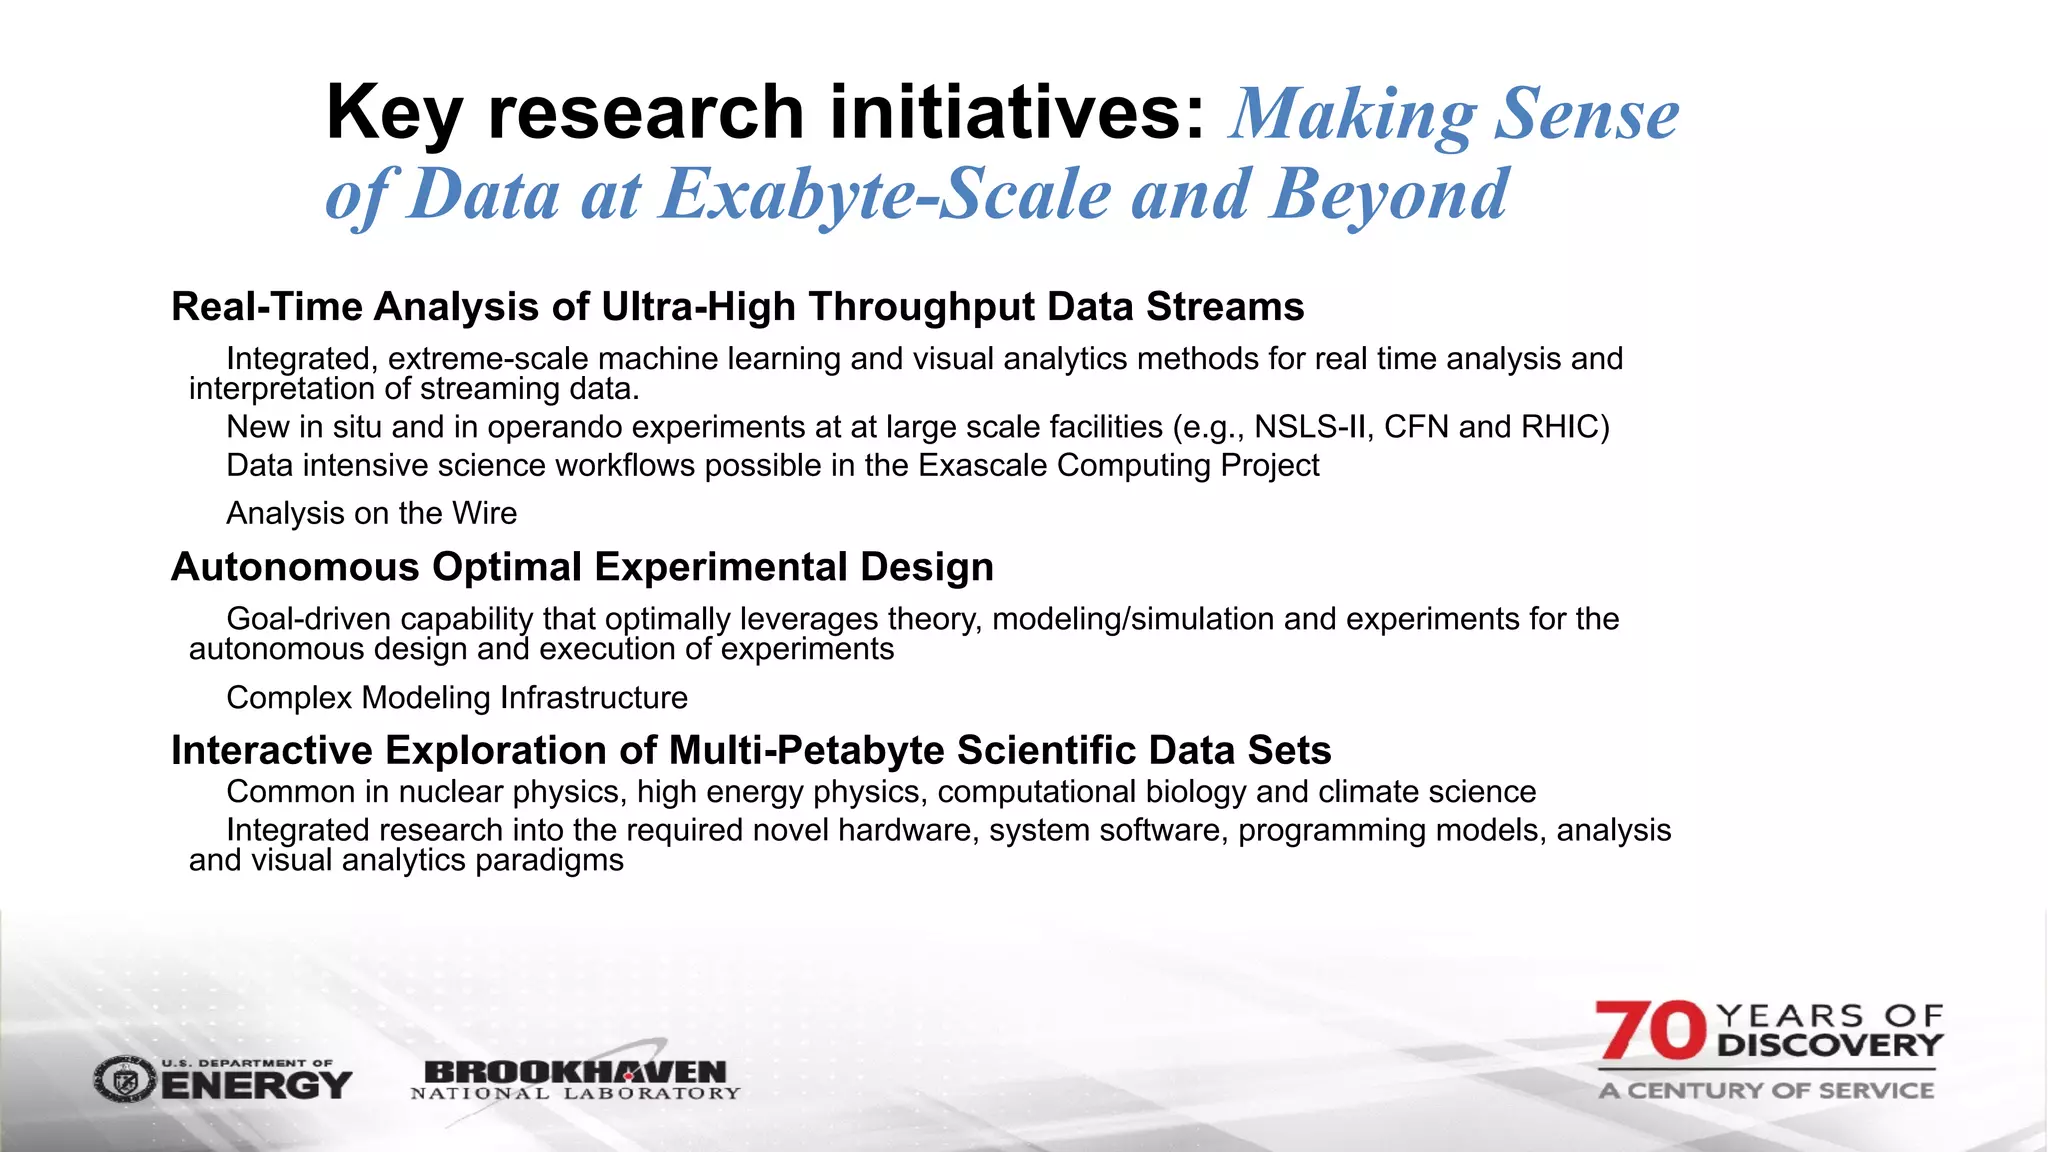

The document outlines BNL's role as a data-driven science laboratory, operating six user facilities that support various scientific research initiatives. It emphasizes the importance of real-time analysis and decision-making in handling large volumes of data generated from advanced experimental techniques, especially in fields like nanotechnology and material sciences. Key advancements include machine learning algorithms for data classification and defect healing in x-ray scattering images, which enhance the capabilities of current scientific methodologies.


![[CVPR 2018] Utilizing unlabeled or noisy labeled data (classification, detect...](https://cdn.slidesharecdn.com/ss_thumbnails/cvpr18detectionclassification-180817015950-thumbnail.jpg?width=640&height=640&fit=bounds)


![Vibe Coding vs. Spec-Driven Development [Free Meetup]](https://cdn.slidesharecdn.com/ss_thumbnails/vibecodingvsspecdrivendevelopment-251209105622-43f455e7-thumbnail.jpg?width=640&height=640&fit=bounds)


