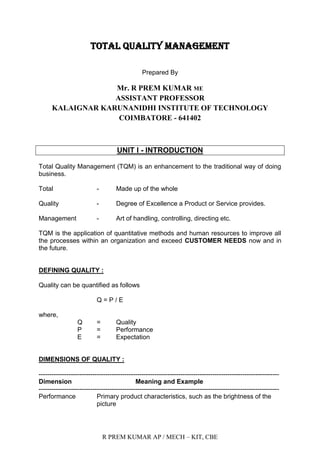
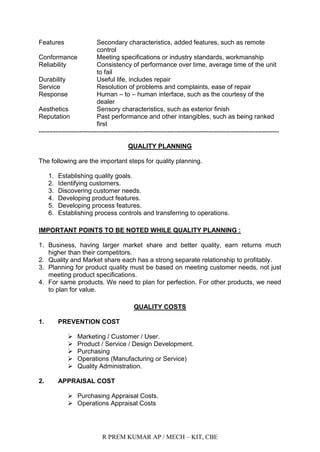
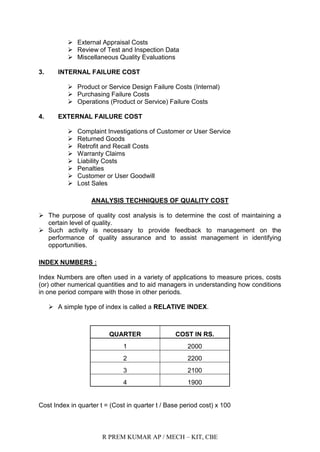
This document provides an overview of Total Quality Management (TQM). It begins by defining key terms like quality, total, and management. TQM aims to improve all processes within an organization to exceed customer needs. Quality is defined using a formula that considers performance and expectations. The dimensions of quality and important steps in quality planning are outlined. Quality costs like prevention, appraisal, internal failure, and external failure costs are examined. Various analysis techniques for quality costs like index numbers, trend analysis, and Pareto analysis are discussed. The document concludes by discussing quality statements, strategic quality planning, Deming philosophy, and TQM implementation.
Productivity & Total Quality ManagementVaibhav Bhatt
Productivity and Total Quality Management Importance For An Organisation And How Can They Develop And Overall Efficiency Through Proper Quality Management Techniques
Productivity & Total Quality ManagementVaibhav Bhatt
Productivity and Total Quality Management Importance For An Organisation And How Can They Develop And Overall Efficiency Through Proper Quality Management Techniques
Taguchi loss function is a modern tool used to determine all the prices associated with manufacturing a product so the loss function along with its types and their basic details are explained in this presentation along with the Signal-Noise Functions in a basic manner
Quality Concepts: Evolution of Quality Control, concept change, TQM Modern concept, Quality concept in design, Review of design, Evolution of prototype. Control on Purchased Product: Procurement of various products, evaluation of supplies, capacity verification, Development of sources, procurement procedure. Manufacturing Quality: Methods and techniques for manufacture, inspection and control of product, quality in sales and services, guarantee, analysis of claims.
Bechmarking- Total Quality Management (TQM)Rehan Ehsan
This presentation covers basics of Benchmarking in the eye of Total Quality Management and customer satisfaction with examples. After Reading this, one should be uble to understand and deliver the best knowledge about benchmarking.
THIS PRESENTATION CONTENT WILL GIVE YOU BRIEF KNOWLEDGE ABOUT HOW YOU CAN IMPROVE THE PROCESS OUTPUT WITH A PROPER PRE-DESIGNED STRUCTURE FOR THAT PARTICULAR.
ISO 9000, Lean manufacturing, and Six Sigma Works on the principle of total quality management or we can say that they overshadowed the TQM due to their efficient output in comparison to it.
According to new syllabus of PCI M.Pharm 1st sem. students can directly utilize this ppt for their study. As per PCI new syllabus QA STUDENTS find this ppt very use full.
UAS Manajemen Kualitas dan Standar Mutu - Total Quality ManagementCandy Chua
Ujian Akhir Semester
Manajemen Kualitas dan Standar Mutu
Total Quality Management
Dosen: Prof. Ir. Syamsir Abduh, MM. Ph.D
Nama Anggota Kelompok:
Antony S 222160505
Candy 222160506
Jonathan 222160509
Program Doktor Strategik
Universitas Trisakti
Week 4:
Quality Management
OPERATIONS MANAGEMENT
1
Outline
Quality definition
Dimension of quality in product and services
Quality assurance
Quality leaders
Cost of quality
Total quality management and tools
Definition of Quality
Quality is a predictable degree of uniformity and dependability, at low cost and suitable to the market (Deming)
Quality is fitness for use (Juran)
Quality is the conformance to requirements (Crosby)
Quality is the (minimum) loss imparted by a product to
society from the time the product is shipped. (Taguchi)
Why Quality
4
Managing quality supports differentiation, low cost, and response strategies
Quality helps firms increase sales and reduce costs
Building a quality organization is a demanding task
4
Ethics and Quality Management
5
Operations managers must deliver healthy, safe, quality products and services
Poor quality risks injuries, lawsuits, recalls, and regulation
Organizations are judged by how they respond to problems
5
Dimensions of Quality for Manufacturing Product
Performance: Product’s primary operating characteristics
Features: Secondary characteristics that supplement the products basic functioning
Reliability: The probability of a product’s surviving over a specified period of time under stated conditions of use
Durability: The amount of use one gets from a product before it physically deteriorates or until replacement is preferable.
Serviceability: The ability to repair a product quickly and easily
Aesthetics: How a product looks, feels, tastes, or smells
Service Quality Attributes
Timeliness: Will a service be performed when promised?
Completeness: Are all items in an order included?
Courtesy: Do front-line employees greet each customer cheerfully and politely.
Consistency: Are services delivered in the same fashion for every customer and every time for the same customers.
Accessibility and convenience: Is the service easy to obtain?
Accuracy: Are the services performed right the first time?
Responsiveness: Can the service personnel response quickly and resolve unexpected problem?
Quality Control
All those operational techniques and activities that are used to fulfill requirements for quality.
The objectives are:
(i) To ensure true expression/correct translation of stated and implied needs of the customers.
(ii) To monitor the process for realization of the product at various stages of its operations and eliminating causes of unsatisfactory performance at all stages of quality loop in order to achieve economic effectiveness.
(iii) Inspection of the product/service package to determine conformance to customer needs.
Quality Assurance
All the planned and systematic activities implemented within the organization for quality management, to provide adequate confidence that a product or service will satisfy given requirements for quality (ISO - International Organization for Standardization).
Quality assurance is a preventive activity an.
Basic of Performance Evaluation & Development processNatwar Sharma
The success of an organization will depends on its ability to measure accurately the performance of their employees and use it persuasively to develop them as valuable resources.
The Performance Evaluation & Development process aims at being more than a mere tool to evaluate performance and focuses on professional performance development.
Read| The latest issue of The Challenger is here! We are thrilled to announce that our school paper has qualified for the NATIONAL SCHOOLS PRESS CONFERENCE (NSPC) 2024. Thank you for your unwavering support and trust. Dive into the stories that made us stand out!
Operation “Blue Star” is the only event in the history of Independent India where the state went into war with its own people. Even after about 40 years it is not clear if it was culmination of states anger over people of the region, a political game of power or start of dictatorial chapter in the democratic setup.
The people of Punjab felt alienated from main stream due to denial of their just demands during a long democratic struggle since independence. As it happen all over the word, it led to militant struggle with great loss of lives of military, police and civilian personnel. Killing of Indira Gandhi and massacre of innocent Sikhs in Delhi and other India cities was also associated with this movement.
Synthetic Fiber Construction in lab .pptxPavel ( NSTU)
Synthetic fiber production is a fascinating and complex field that blends chemistry, engineering, and environmental science. By understanding these aspects, students can gain a comprehensive view of synthetic fiber production, its impact on society and the environment, and the potential for future innovations. Synthetic fibers play a crucial role in modern society, impacting various aspects of daily life, industry, and the environment. ynthetic fibers are integral to modern life, offering a range of benefits from cost-effectiveness and versatility to innovative applications and performance characteristics. While they pose environmental challenges, ongoing research and development aim to create more sustainable and eco-friendly alternatives. Understanding the importance of synthetic fibers helps in appreciating their role in the economy, industry, and daily life, while also emphasizing the need for sustainable practices and innovation.
Introduction to AI for Nonprofits with Tapp NetworkTechSoup
Dive into the world of AI! Experts Jon Hill and Tareq Monaur will guide you through AI's role in enhancing nonprofit websites and basic marketing strategies, making it easy to understand and apply.
June 3, 2024 Anti-Semitism Letter Sent to MIT President Kornbluth and MIT Cor...Levi Shapiro
Letter from the Congress of the United States regarding Anti-Semitism sent June 3rd to MIT President Sally Kornbluth, MIT Corp Chair, Mark Gorenberg
Dear Dr. Kornbluth and Mr. Gorenberg,
The US House of Representatives is deeply concerned by ongoing and pervasive acts of antisemitic
harassment and intimidation at the Massachusetts Institute of Technology (MIT). Failing to act decisively to ensure a safe learning environment for all students would be a grave dereliction of your responsibilities as President of MIT and Chair of the MIT Corporation.
This Congress will not stand idly by and allow an environment hostile to Jewish students to persist. The House believes that your institution is in violation of Title VI of the Civil Rights Act, and the inability or
unwillingness to rectify this violation through action requires accountability.
Postsecondary education is a unique opportunity for students to learn and have their ideas and beliefs challenged. However, universities receiving hundreds of millions of federal funds annually have denied
students that opportunity and have been hijacked to become venues for the promotion of terrorism, antisemitic harassment and intimidation, unlawful encampments, and in some cases, assaults and riots.
The House of Representatives will not countenance the use of federal funds to indoctrinate students into hateful, antisemitic, anti-American supporters of terrorism. Investigations into campus antisemitism by the Committee on Education and the Workforce and the Committee on Ways and Means have been expanded into a Congress-wide probe across all relevant jurisdictions to address this national crisis. The undersigned Committees will conduct oversight into the use of federal funds at MIT and its learning environment under authorities granted to each Committee.
• The Committee on Education and the Workforce has been investigating your institution since December 7, 2023. The Committee has broad jurisdiction over postsecondary education, including its compliance with Title VI of the Civil Rights Act, campus safety concerns over disruptions to the learning environment, and the awarding of federal student aid under the Higher Education Act.
• The Committee on Oversight and Accountability is investigating the sources of funding and other support flowing to groups espousing pro-Hamas propaganda and engaged in antisemitic harassment and intimidation of students. The Committee on Oversight and Accountability is the principal oversight committee of the US House of Representatives and has broad authority to investigate “any matter” at “any time” under House Rule X.
• The Committee on Ways and Means has been investigating several universities since November 15, 2023, when the Committee held a hearing entitled From Ivory Towers to Dark Corners: Investigating the Nexus Between Antisemitism, Tax-Exempt Universities, and Terror Financing. The Committee followed the hearing with letters to those institutions on January 10, 202
Embracing GenAI - A Strategic ImperativePeter Windle
Artificial Intelligence (AI) technologies such as Generative AI, Image Generators and Large Language Models have had a dramatic impact on teaching, learning and assessment over the past 18 months. The most immediate threat AI posed was to Academic Integrity with Higher Education Institutes (HEIs) focusing their efforts on combating the use of GenAI in assessment. Guidelines were developed for staff and students, policies put in place too. Innovative educators have forged paths in the use of Generative AI for teaching, learning and assessments leading to pockets of transformation springing up across HEIs, often with little or no top-down guidance, support or direction.
This Gasta posits a strategic approach to integrating AI into HEIs to prepare staff, students and the curriculum for an evolving world and workplace. We will highlight the advantages of working with these technologies beyond the realm of teaching, learning and assessment by considering prompt engineering skills, industry impact, curriculum changes, and the need for staff upskilling. In contrast, not engaging strategically with Generative AI poses risks, including falling behind peers, missed opportunities and failing to ensure our graduates remain employable. The rapid evolution of AI technologies necessitates a proactive and strategic approach if we are to remain relevant.
A Strategic Approach: GenAI in EducationPeter Windle
Artificial Intelligence (AI) technologies such as Generative AI, Image Generators and Large Language Models have had a dramatic impact on teaching, learning and assessment over the past 18 months. The most immediate threat AI posed was to Academic Integrity with Higher Education Institutes (HEIs) focusing their efforts on combating the use of GenAI in assessment. Guidelines were developed for staff and students, policies put in place too. Innovative educators have forged paths in the use of Generative AI for teaching, learning and assessments leading to pockets of transformation springing up across HEIs, often with little or no top-down guidance, support or direction.
This Gasta posits a strategic approach to integrating AI into HEIs to prepare staff, students and the curriculum for an evolving world and workplace. We will highlight the advantages of working with these technologies beyond the realm of teaching, learning and assessment by considering prompt engineering skills, industry impact, curriculum changes, and the need for staff upskilling. In contrast, not engaging strategically with Generative AI poses risks, including falling behind peers, missed opportunities and failing to ensure our graduates remain employable. The rapid evolution of AI technologies necessitates a proactive and strategic approach if we are to remain relevant.
Francesca Gottschalk - How can education support child empowerment.pptxEduSkills OECD
Francesca Gottschalk from the OECD’s Centre for Educational Research and Innovation presents at the Ask an Expert Webinar: How can education support child empowerment?
1. R PREM KUMAR AP / MECH – KIT, CBE
TOTAL QUALITY MANAGEMENT
Prepared By
Mr. R PREM KUMAR ME
ASSISTANT PROFESSOR
KALAIGNAR KARUNANIDHI INSTITUTE OF TECHNOLOGY
COIMBATORE - 641402
UNIT I - INTRODUCTION
Total Quality Management (TQM) is an enhancement to the traditional way of doing
business.
Total - Made up of the whole
Quality - Degree of Excellence a Product or Service provides.
Management - Art of handling, controlling, directing etc.
TQM is the application of quantitative methods and human resources to improve all
the processes within an organization and exceed CUSTOMER NEEDS now and in
the future.
DEFINING QUALITY :
Quality can be quantified as follows
Q = P / E
where,
Q = Quality
P = Performance
E = Expectation
DIMENSIONS OF QUALITY :
----------------------------------------------------------------------------------------------------------------
Dimension Meaning and Example
----------------------------------------------------------------------------------------------------------------
Performance Primary product characteristics, such as the brightness of the
picture
2. R PREM KUMAR AP / MECH – KIT, CBE
Features Secondary characteristics, added features, such as remote
control
Conformance Meeting specifications or industry standards, workmanship
Reliability Consistency of performance over time, average time of the unit
to fail
Durability Useful life, includes repair
Service Resolution of problems and complaints, ease of repair
Response Human – to – human interface, such as the courtesy of the
dealer
Aesthetics Sensory characteristics, such as exterior finish
Reputation Past performance and other intangibles, such as being ranked
first
----------------------------------------------------------------------------------------------------------------
QUALITY PLANNING
The following are the important steps for quality planning.
1. Establishing quality goals.
2. Identifying customers.
3. Discovering customer needs.
4. Developing product features.
5. Developing process features.
6. Establishing process controls and transferring to operations.
IMPORTANT POINTS TO BE NOTED WHILE QUALITY PLANNING :
1. Business, having larger market share and better quality, earn returns much
higher than their competitors.
2. Quality and Market share each has a strong separate relationship to profitably.
3. Planning for product quality must be based on meeting customer needs, not just
meeting product specifications.
4. For same products. We need to plan for perfection. For other products, we need
to plan for value.
QUALITY COSTS
1. PREVENTION COST
Marketing / Customer / User.
Product / Service / Design Development.
Purchasing
Operations (Manufacturing or Service)
Quality Administration.
2. APPRAISAL COST
Purchasing Appraisal Costs.
Operations Appraisal Costs
3. R PREM KUMAR AP / MECH – KIT, CBE
External Appraisal Costs
Review of Test and Inspection Data
Miscellaneous Quality Evaluations
3. INTERNAL FAILURE COST
Product or Service Design Failure Costs (Internal)
Purchasing Failure Costs
Operations (Product or Service) Failure Costs
4. EXTERNAL FAILURE COST
Complaint Investigations of Customer or User Service
Returned Goods
Retrofit and Recall Costs
Warranty Claims
Liability Costs
Penalties
Customer or User Goodwill
Lost Sales
ANALYSIS TECHNIQUES OF QUALITY COST
The purpose of quality cost analysis is to determine the cost of maintaining a
certain level of quality.
Such activity is necessary to provide feedback to management on the
performance of quality assurance and to assist management in identifying
opportunities.
INDEX NUMBERS :
Index Numbers are often used in a variety of applications to measure prices, costs
(or) other numerical quantities and to aid managers in understanding how conditions
in one period compare with those in other periods.
A simple type of index is called a RELATIVE INDEX.
QUARTER COST IN RS.
1 2000
2 2200
3 2100
4 1900
Cost Index in quarter t = (Cost in quarter t / Base period cost) x 100
4. R PREM KUMAR AP / MECH – KIT, CBE
QUARTER COST RELATIVE INDEX
1 (2000/2000) x 100 = 100
2 (2200/2000) x 100 = 110
3 (2100/2000) x 100 = 105
4 (1900/2000) x 100 = 95
TREND ANALYSIS :
Good visual aids are important communication tools.
Graphs are particularly useful in presenting comparative results to management.
Trend Analysis is one where Time-to-Time comparisons can be made which
illustrates the changes in cost over time.
68.5
87.5
103.3
606060.7
57
31.4
50
42.5
33.3
10
7.5
10.78.6
TREND ANALYSIS - WATCHES
5
10
15
20
25
30
35
40
45
50
55
60
65
70
75
80
85
90
95
100
1 2 3 4
5. R PREM KUMAR AP / MECH – KIT, CBE
PARETO ANALYSIS :
Joseph Juran observed that most of the quality problems are generally created
by only a few causes.
For example, 80% of all internal failures are due to one (or) two manufacturing
problems.
Identifying these “vital few” and ignoring the “trivial many” will make the corrective
action give a high return for a low money input.
5
10
15
20
25
30
35
40 36.4 %
27.3 %
22.7 %
2% 3%
1% 2%
4% 3%
Incomplete
Surfacescars
Cracks
Surfacepits
RoughSurface
Scratches
Lesspolishing
Misssharpen
Others
VITAL FEW
TRIVIAL MANY
PARETO DIAGRAM
SIX BASIC CONCEPTS OF TOTAL QUALITY MANAGEMENT
1. Management Commitment
2. Customer Focus
6. R PREM KUMAR AP / MECH – KIT, CBE
3. Involvement and utilization of entire work force
4. Continuous Improvement
5. Treating Suppliers as Partners
6. Establish Performance Measures for the processes
NEW AND OLD CULTURES :
----------------------------------------------------------------------------------------------------------------
Quality Element Previous State TQM
----------------------------------------------------------------------------------------------------------------
Definition Product Oriented Customer Oriented
Priorities Second to service First among equals of
and cost service and cost
Decisions Short term Long term
Emphasis Detection Prevention
Errors Operations System
Responsibility Quality control Everyone
Problem Solving Managers Teams
Procurement Price Life cycle costs,
Partnership
Manager‟s Role Plan, assign, control Delegate, coach,
and enforce facilitate and mentor
----------------------------------------------------------------------------------------------------------------
GURUS OF TQM :
SHEWHART - Control chart theory
- PDCA Cycle
DEMING - Statistical Process Control
JURAN - Concepts of SHEWHART
- Return on Investment ( ROI )
FEIGANBAUM - Total Quality Control
- Management involvement
7. R PREM KUMAR AP / MECH – KIT, CBE
- Employee involvement
- Company wide quality control
ISHIKAWA - Cause and Effect Diagram
- Quality Circle concept
CROSBY - “Quality is Free”
- Conformance to requirements
TAGUCHI - Loss Function concept
- Design of Experiments
OBSTACLES IN IMPLEMENTING TQM :
Lack of Management Commitment
Inability to change Organizational culture
Improper planning
Lack of continuous training and education
Incompatible organizational structure and isolated individuals and
departments
Ineffective measurement techniques and lack of access to data and results
Paying inadequate attention to internal and external customers
Inadequate use of empowerment and teamwork
Failure to continually improve
BENEFITS OF TQM :
Improved quality
Employee participation
Team work
Working relationships
Customer satisfaction
Employee satisfaction
Productivity
Communication
Profitability
Market share
LEADERSHIP
A leader is one who instills purposes, not one who controls by brute force. He
strengthens and inspires the followers to accomplish shared goals.
Leaders
Shape the Organization‟s value
Promote the Organization‟s value
Protect the Organization‟s value and
Exemplifies the Organization values
8. R PREM KUMAR AP / MECH – KIT, CBE
CHARACTERISTICS OF QUALITY LEADERS :
1. They give priority attention to external and internal customers and their needs.
2. They empower, rather than control, subordinates.
3. They emphasis improvement rather than maintenance.
4. They emphasis prevention.
5. They emphasis collaboration rather than competition.
6. They train and coach, rather than direct and supervise.
7. They learn from the problems.
8. They continually try to improve communications.
9. They continually demonstrate their commitment to quality.
10.They choose suppliers on the basis of quality, not price.
11.They establish organizational systems to support the quality effort.
12.They encourage and recognize team effort.
LEADERSHIP CONCEPTS :
A leader should have the following concepts
1. People, Paradoxically, need security and independence at the same time.
2. People are sensitive to external and punishments and yet are also strongly
self - motivated.
3. People like to hear a kind word of praise. Catch people doing something right,
so you can pat them on the back.
4. People can process only a few facts at a time; thus, a leader needs to keep
things simple.
5. People trust their gut reaction more than statistical data.
6. People distrust a leader‟s rhetoric if the words are inconsistent with the
leader‟s actions.
THE 7 HABITS OF HIGHLY EFFECTIVE PEOPLE :
1. Be Proactive
2. Begin with the End in mind
3. Put First Things First
4. Think Win – Win
5. Seek First to Understand, then to Be Understood
6. Synergy
7. Sharpen the Saw (Renewal)
ROLE OF SENIOR MANAGEMENT
1. Management by Wandering Around (MBWA).
2. Strategy of problem solving and decision making.
3. Strong information base.
4. Recognition and Reward system.
5. Spending most of the time on Quality.
6. Communication.
7. Identify and encourage potential employee.
8. Accept the responsibility.
9. To play a role model.
9. R PREM KUMAR AP / MECH – KIT, CBE
10.Remove road blocks.
11.Study TQM and investigate how TQM is implemented elsewhere.
12.Establish policies related to TQM.
13.Establish „priority of quality‟ and „customer satisfaction‟ as the basic policy.
14.Assume leadership in bringing about a cultural change.
15.Check whether the quality improvement programmes are conducted as planned.
16.Become coaches and cheer leaders to implement TQM.
17.Generate enthusiasm for TQM activities.
18.Visit other companies to observe TQM functioning.
19.Attend TQM training programme.
20.Teach others for the betterment of society and the surroundings.
QUALITY COUNCIL
A quality council is established to provide overall direction.
The council is composed of
Chief Executive Officer
Senior Managers
Coordinator or Consultant
A representative from the Union
Duties of the council are
Develop the core values, vision statement, mission statement and quality
policy statement
Develop the strategic long term plan with goals and Annual Quality
Improvement Program with objectives
Create the total education and training plan
Determine and monitor the cost of poor quality
Determine the performance measures
Determine projects those improve the process
Establish multifunctional project and work group teams
Revise the recognition and rewards system
A typical meeting agenda will have the following items
Progress report on teams
Customer satisfaction report
Progress on meeting goals
New project teams
Benchmarking report
Within three to five years, the quality council activities will become ingrained in the
culture of the organization.
10. R PREM KUMAR AP / MECH – KIT, CBE
QUALITY STATEMENTS
VISION STATEMENT :
It is a short declaration of what an organization aspires to be tomorrow.
Example :
Disney Theme Park - Happiest place on earth
Polaroid - Instant photography
Successful visions provide a guideline for decision making
MISSION STATEMENT :
It answers the following questions
Who we are?
Who are the customers?
What we do?
How we do it?
It describes the function of the organization. It provides a clear statement of purpose
for employees, customers & suppliers
A simpler mission statement is
“To meet customers transportation and distribution needs by being the best at
moving their goods on time, safely and damage free”
- National Railways
QUALITY POLICY STATEMENT :
It is guide for everyone in the organization as to how they should provide products
and services to the customers.
Common characteristics are
Quality is first among equals
Meet the needs of the internal & external customers
Equal or exceed competition
Continuously improve the quality
Utilize the entire workforce
STRATEGIC QUALITY PLANNING
Goals – Long term planning (Eg : Win the war)
Objectives – Short term planning (Eg : Capture the bridge)
Goals should
11. R PREM KUMAR AP / MECH – KIT, CBE
Improve customer satisfaction, employee satisfaction and process
Be based on statistical evidence
Be measurable
Have a plan or method for its achievement
Have a time frame for achieving the goal
Finally, it should be challenging yet achievable
SEVEN STEPS TO STRATEGIC QUALITY PLANNING :
1. Customer needs 5. Closing the gap
2. Customer positioning 6. Alignment
3. Predict the future 7. Implementation
4. Gap analysis
DEMING PHILOSOPHY
1. Create and publish the Aims and Purposes of the organization.
2. Learn the New Philosophy.
3. Understand the purpose of Inspection.
4. Stop awarding business based on price alone.
5. Improve constantly and forever the System.
6. Institute Training.
7. Teach and Institute Leadership.
8. Drive out Fear, Create Trust and Create a climate for innovation.
9. Optimize the efforts of Teams, Groups and Staff areas.
10. Eliminate exhortations for the Work force.
11a. Eliminate numerical quotas for the work force.
11b. Eliminate Management by objectives.
12. Remove Barriers THAT ROB PEOPLE OF PRIDE OF
WORKMANSHIP.
13.Encourage Education and Self-improvement for everyone.
14.Take action to accomplish the transformation.
TQM IMPLEMENTATION :
Begins with Management Commitment
Leadership is essential during every phase of the implementation process and
particularly at the start
Senior Management should develop an implementation plan
Timing of the implementation process is very important
Formation of Quality Council
Active involvement of Middle Managers and First Line Supervisors is essential
Early discussions with the Union is a must
Communicate TQM to the entire organization
12. R PREM KUMAR AP / MECH – KIT, CBE
Training on quality awareness and problem solving
Customer, Employee and Supplier surveys must be conducted to benchmark
The council establishes the project teams and work groups and monitors their
progress
13. R PREM KUMAR AP / MECH – KIT, CBE
UNIT II – TQM PRINCIPLES
CUSTOMER SATISFACTION
CUSTOMER PERCEPTION OF QUALITY :
1. Performance
2. Features
3. Service
4. Warranty
5. Price
6. Reputation
FEEDBACK (INFORMATION COLLECTING TOOLS):
Feedback enables organization to
Discover customer satisfaction
Discover relative priorities of quality
Compare performance with the competition
Identify customer needs
Determine opportunities for improvement
Listening to the voice of the customer can be accomplished by numerous information
collecting tools.
1. Comment Card
2. Customer Questionnaire
Highly Neutral Highly
Satisfied Dissatisfied
1. Trash removal 5 4 3 2 1
2. Personal hygiene 5 4 3 2 1
3. Romance 5 4 3 2 1
4. Thoughtfulness 5 4 3 2 1
5. Listening skills 5 4 3 2 1
6. Faithfulness 5 4 3 2 1
7. Respect for
Mother – in - law 5 4 3 2 1
8. Overall,how satisfied
are you with your
marriage? 5 4 3 2 1
To make surveys more useful, it is best to remember eight points
14. R PREM KUMAR AP / MECH – KIT, CBE
Clients and Customers are not the same
Surveys raise customers expectations
How you ask a question will determine how the question is answered
The more specific the question, the better the answer
You have only one chance and only 15 minutes
The more time you spend in survey development, the less time you will spend
in data analysis and interpretation
Who you ask is as important as what you ask
Before the data are collected, you should know how you want to analyse and
use the data
3. Focus Groups
These groups are very effective for gathering information on customer
expectations and requirements.
4. Toll – Free Telephone Numbers
5. Customer Visits
6. Report Card
7. The Internet and Computers
8. Employee Feedback
9. Mass Customization
USING CUSTOMER COMPLAINTS :
Actions an organization can take to handle complaints are as follows
Investigate customers experiences by actively getting feed back, both positive
and negative, and then acting on it promptly
Develop procedures for complaint resolution that include empowering front –
line personnel.
Analyze complaints, but understand that complaints do not always fit into neat
categories.
Work to identify process and material variations and then eliminate the root
cause. “More inspection” is not corrective action.
When a survey response is received, a senior manager should contact the
customer and strive to resolve the concern.
Establish customer satisfaction measures and constantly monitor them.
15. R PREM KUMAR AP / MECH – KIT, CBE
Communicate complaint information, as well as the results of all investigations
and solutions, to all people in the organization.
Provide a monthly complaint report to the quality council for their evaluation
and, if needed, the assignment of process improvement teams.
Identify customers‟ expectations beforehand rather than afterward through
complaint analysis.
SERVICE QUALITY
Customer service is the set of activities an organization uses to win and retain
customer‟s satisfaction. It can be provided before, during, or after the sale of the
product or exist on its own.
Elements of customer service are
Organization
1. Identify each market segment.
2. Write down the requirements.
3. Communicate the requirements.
4. Organize processes.
5. Organize physical spaces.
Customer Care
6. Meet the customer‟s expectations.
7. Get the customer‟s point of view.
8. Deliver what is promised.
9. Make the customer feel valued.
10. Respond to all complaints.
11. Over – respond to the customer.
12. Provide a clean and comfortable customer reception area.
Communication
13. Optimize the trade – off between time and personal attention.
14. Minimize the number of contact points.
15. Provide pleasant, knowledgeable and enthusiastic employees.
16. Write document in customer friendly language.
Front-Line people
17. Hire people who like people.
18. Challenge them to develop better methods.
19. Give them the authority to solve problems.
20. Serve them as internal customers.
16. R PREM KUMAR AP / MECH – KIT, CBE
21. Be sure they are adequately trained.
22. Recognize and reward performance.
Leadership
23. Lead by example.
24. Listen to the front-line people.
25. Strive for continuous process improvement.
CHARACTERISTICS AND EXPECTATIONS :
----------------------------------------------------------------------------------------------------------------
Characteristic Expectation
----------------------------------------------------------------------------------------------------------------
Delivery Delivered on schedule in undamaged condition
Installation Proper instructions on setup, or technicians supplied for
complicated products
Use Clearly-written training manuals or instructions provided
on proper use
Field repair Properly-trained technicians to promptly make quality
repairs
Customer Service Friendly service representatives to answer questions
Warranty Clearly stated with prompt service on claims
----------------------------------------------------------------------------------------------------------------
CUSTOMER RETENTION
It means “retaining the customer” to support the business. It is more powerful and
effective than customer satisfaction.
For Customer Retention, we need to have both “Customer satisfaction & Customer
loyalty”.
The following steps are important for customer retention.
1. Top management commitment to the customer satisfaction.
2. Identify and understand the customers what they like and dislike about the
organization.
3. Develop standards of quality service and performance.
4. Recruit, train and reward good staff.
17. R PREM KUMAR AP / MECH – KIT, CBE
5. Always stay in touch with customer.
6. Work towards continuous improvement of customer service and customer
retention.
7. Reward service accomplishments by the front-line staff.
8. Customer Retention moves customer satisfaction to the next level by determining
what is truly important to the customers.
9. Customer satisfaction is the connection between customer satisfaction and
bottom line.
EMPLOYEE INVOLVEMENT
Employee involvement is one approach to improve quality and productivity.
It is a means to better meet the organization‟s goals for quality and
productivity.
MOTIVATION
MASLOW’S HIERARCHY OF NEEDS :
EMPLOYEE WANTS :
----------------------------------------------------------------------------------------------------------------
Factor Employee Rating Manager Rating
----------------------------------------------------------------------------------------------------------------
Interesting work 1 5
Appreciation 2 8
Involvement 3 10
Job security 4 2
Social
Security
Self - Actualization
Esteem
Survival
18. R PREM KUMAR AP / MECH – KIT, CBE
Good Pay 5 1
Promotion/ growth 6 3
Good working conditions 7 4
Loyalty to employees 8 7
Help with personal problems 9 9
Tactful discipline 10 6
----------------------------------------------------------------------------------------------------------------
ACHIEVING A MOTIVATED WORK FORCE :
The building of a motivated work force if for the most part an indirect process.
Concepts to achieve a motivated work force are as follows:
1. Know thyself.
2. Know your employees.
3. Establish a positive attitude.
4. Share the goals.
5. Monitor progress.
6. Develop interesting work.
Job rotation
Job enlargement
Job enrichment
7. Communicate effectively
8. Celebrate success.
EMPLOYEE SURVEYS :
Employee surveys help managers assess the current state of employee relations,
identify trends, measure the effectiveness of program implementation, identify
needed improvements, and increase communication effectiveness.
STEP 1 : The Quality Council to create a multifunctional team
STEP 2 : The Team will develop survey instrument
STEP 3 : Administer the survey
STEP 4 : Results are compiled and analyzed
STEP 5 : Determine areas for improvement
19. R PREM KUMAR AP / MECH – KIT, CBE
EMPOWERMENT
Empowerment is investing people with authority. It‟s purpose is to tap the enormous
reservoir of potential contribution that lies within every worker.
The two steps to empowerment are
1. To arm people to be successful through coaching, guidance and training.
2. Letting people do by themselves.
The principles of empowering people are given below.
1. Tell people what their responsibilities are.
2. Give authority.
3. Set standards for excellence.
4. Render training.
5. Provide knowledge and information.
6. Trust them.
7. Allow them to commit mistakes.
8. Treat them with dignity and respect.
Three dimensions of empowerment are
Capability
Alignment and
Trust
TEAMS
Employee involvement is optimized by the use of teams.
A team is defined as a group of people working together to achieve common
objectives or goals.
Teamwork is the cumulative actions of the team during which each member
of the team subordinates his individual interests and opinions to fulfill the
objectives or goals of the group.
WHY TEAMS WORK :
1. Many heads are more knowledgeable than one.
2. The whole is greater than the sum of its members.
3. Team members develop a rapport which each other.
4. Teams provide the vehicle for improved communication.
TYPES OF TEAMS :
1. Process improvement team.
20. R PREM KUMAR AP / MECH – KIT, CBE
2. Cross – functional team.
3. Natural work teams.
4. Self – Directed / Self – Managed work teams.
CHARACTERISTICS OF SUCCESSFUL TEAMS :
1. Sponsor 2. Team Charter
3. Team Composition 4. Training
5. Ground Rules 6. Clear Objectives
7. Accountability 8.Well-Defined decision procedure
9. Resources 10. Trust
11.Effective Problem Solving 12. Open Communication
13. Appropriate Leadership 14. Balanced Participation
15. Cohesiveness
TEAM MEMBER ROLES :
TEAM LEADER
Ensures the smooth and effective operation of the team.
Facilitates the team process.
Serves as a Contact Point.
Organizes the implementation of changes.
Prepares the meeting agenda.
FACILITATOR
Supports the leader.
Focuses on the team process.
Acts as a resource to the team.
Provides feedback to the team.
RECORDER
Documents the main ideas of the team‟s discussion, the issues raise,
decisions made, action items etc.
Presents the documents and distributes the MOM.
Participates as a team member.
TIMEKEEPER
Ensures that the team maintains the schedule.
Participates as a team member.
TEAM MEMBER
Contributes best, without reservation.
Respects other people‟s contributions.
Listens carefully and asks questions.
Works for consensus on decisions.
Supports the decision of the team.
Understands and is committed to the team objectives.
21. R PREM KUMAR AP / MECH – KIT, CBE
Respects and is tolerant of individual differences.
Acknowledges and works through conflict openly.
Carries out assignments.
DECISION MAKING METHODS :
1. Non-decision.
2. Unilateral decision.
3. Handclasp decision.
4. Minority-rule decision.
5. Majority-rule decision.
6. Consensus.
COMMON BARRIERS TO TEAM PROGRESS :
Insufficient training.
Incompatible rewards and compensation.
First-line supervisor resistance.
Lack of planning.
Lack of management support.
Access to information systems.
Lack of Union support.
Project scope too large.
Project objectives are not significant.
No clear measures of success.
No time to do improvement work.
RECOGNITION AND REWARD
Recognition is a process by which management shows acknowledgement of an
employee‟s outstanding performance.
Various ways for Recognition and Rewards are
1. Recognition can be expressed using verbal and written praise.
2. Rewards may be in the form of certificates and plaques.
3. Reward is normally in the form of cinema tickets, dinner for family etc.
4. The financial compensation (for recognition) can be paid in terms of increased
salaries, commissions, gain sharing etc.
5. The efforts of employees can be recognized by promotions, special job
assignments etc.
6. A letter of appreciation from the CEO or the Top Management will increase the
employee‟s involvement.
7. Reward may be delayed but recognition should be in a timely basis.
8. Rewards should be appropriate to the improvement level.
9. People like to be recognized than any reward.
22. R PREM KUMAR AP / MECH – KIT, CBE
10.Special forms of recognition include pictures on the bulletin board, articles in
news letters, letter to families etc.
11.Supervisors can give on-the-spot praise for a job which is done well.
EFFECTS OF RECOGNITION AND REWARD SYSTEM :
1. Recognition and reward go together for letting people know that they are valuable
members for the organization.
2. Employee involvement can be achieved by recognition and reward system.
3. Recognition and reward system reveals that the organization considers quality
and productivity as important.
4. It provides the organization an opportunity to thank high achievers.
5. It provides employees a specific goal to achieve.
6. It motivates employees to improve the process.
7. It increases the morale of the workers.
PERFORMANCE APPRAISAL
The performance appraisal is used to let employees know how they are performing.
The performance appraisal becomes a basis for promotions, increase in salaries,
counseling and other purposes related to an employee‟s future.
IMPORTANCE OF PERFORMANCE APPRAISALS :
1. It is necessary to prevail a good relationship between the employee and the
appraiser.
2. Employee should be informed about how they are performing on a continuous
basis, not just at appraisal time.
3. The appraisal should highlight strength and weakness and how to improve the
performance.
4. Employee should be allowed to comment on the evaluation and protest if
necessary.
5. Everyone should understand that the purpose of performance appraisal is to
have employee involvement.
6. Errors in performance evaluations should be avoided.
7. Unfair and biased evaluation will render poor rating and hence should be
eliminated.
BENEFITS OF EMPLOYEE INVOLVEMENT :
Employee involvement improves quality and increases productivity because
Employees make better decisions using their expert knowledge of the process
Employees are better able to spot and pin-point areas for improvement.
Employees are better able to take immediate corrective action.
Employee involvement reduces labour / management friction.
Employee involvement increases morale.
Employees have an increased commitment to goals because they are
involved.
23. R PREM KUMAR AP / MECH – KIT, CBE
CONTINUOUS PROCESS IMPROVEMENT
Continuous process improvement is designed to utilize the resources of the
organization to achieve a quality-driven culture.
Improvement is made by
Viewing all work as process.
Making all process effective, efficient and adaptable.
Anticipating changing customer needs.
Controlling in-process performance using measures such as scrap reduction,
control charts etc.
Eliminating waste and re-work.
Eliminating non-value added activities.
Eliminating non-conformities.
Using Benchmarking.
Incorporating learned lessons into future activities.
Using technical tools such as SPC, benchmarking, experimental design, QFD
etc.
PROCESS :
Process refers to business and production activities of an organization.
Input / Output Process Model
INPUT
Materials,
Money,
Information,
Data, etc.
PROCESS
People,
Equipment,
Method,
Procedures,
Environment,
Materials
OUTPUT
Information,
Data,
Product,
Service, etc.
OUTCOMES
FEEDBACK
CONDITIONS
24. R PREM KUMAR AP / MECH – KIT, CBE
There are five basic ways for improvement.
Reduce resources.
Reduce errors.
Meet or exceed expectations of downstream customers.
Make the process safer.
Make the process more satisfying to the person doing it.
THE JURAN TRILOGY
1. PLANNING
Determine internal & external customers.
Their needs are discovered.
Develop product / service features.
Develop the processes able to produce the product / service features.
Transfer plans to operations.
2. CONTROL
Control is used by operating forces to help meet the product, process and service
requirements.
It consists of the following steps
1. Determine items to be controlled.
2. Set goals for the controls.
3. Measure actual performance.
4. Compare actual performance to goals.
5. Act on the difference.
3. IMPROVEMENT
Aims to attain levels of performance that are higher than current levels.
It consists of the following steps
Establishment of quality council.
Identify the improvement projects.
Establish the project teams with a project leader.
Provide the team with the resources.
25. R PREM KUMAR AP / MECH – KIT, CBE
THE PDCA CYCLE :
PROBLEM SOLVING METHOD :
1. IDENTIFY THE OPPORTUNITY
Identify the Problem
Pareto analysis of external alarm signals.
Pareto analysis of internal alarm signals.
Proposals from key insiders.
Proposals from suggestion schemes.
Field study of user‟s needs.
Comments of key people outside the organization.
Customer surveys.
Employee surveys.
Brainstorming by work groups.
Form the Team
Team should be selected.
Goals and milestones are established.
Define the Scope.
Criteria for a good problem statement is as follows
It clearly describes the problem.
It states the effect.
It focuses on what is known, unknown etc.
It emphasizes the impact on the customer.
ACT PLAN
CHECK DO
26. R PREM KUMAR AP / MECH – KIT, CBE
2. ANALYZE THE CURRENT PROCESS
The objective is to understand the process and how it is currently performed.
Step 1 : The team to develop a process flow diagram.
Step 2 : The target performance measures are defined.
Step 3 : Collection of all available data and information.
Common items of data and information are
1. Customer information 2. Design information
3. Process information 4. Statistical information
5. Quality information 6. Supplier information
3. DEVELOP THE OPTIMAL SOLUTION(S)
This phase has the objective of establishing potential and feasible solutions and
recommending the best solution to improve the process.
Creativity plays the major role, and brainstorming is the principal technique.
There are three types of creativity:
Create new processes
Combine different processes
Modify the existing process
4. IMPLEMENT CHANGES
This phase has the objective of preparing the implementation plan, obtaining
approval and implementing the process improvements.
Approval of the quality council.
Obtain the advice and consent of departments, functional areas, teams,
individuals etc.
Monitor the activity.
5. STUDY THE RESULTS
This phase has the objective of monitoring and evaluating the change by tracking
and studying the effectiveness of the improvement efforts.
6. STANDARDIZE THE SOLUTION
Institutionalize by positive control of the process.
The quality peripherals – the system, environment and supervision must be
certified.
Operators must be certified.
27. R PREM KUMAR AP / MECH – KIT, CBE
7. PLAN FOR THE FUTURE
The objective is to achieve improved level of process performance.
Regularly conduct reviews of progress by the quality council.
Establish the systems to identify area for future improvements.
Track performance with respective internal & external customers.
TQM tools and techniques are used to improve quality, delivery and cost.
5-S : HOUSEKEEPING
CLEARING
ARRANGING
SWEEPING
CLEANLINESS
DISCIPLINE
There can be no TQM without 5-S.
A dirty factory cannot produce quality products.
Clutter hides problems. A neat workplace promotes easy discovery of
abnormalities.
SEIRI
SEITON
SEIKETSU
SEISO
SHITSUKE
5-S
CONTRIBUTES
TO
SAFETY
QUALITY
PRODUCTIVITY
5-S
FACILITATES
VISUAL CONTROL
5-S MEANS EVERYTHING IN ITS PLACE
28. R PREM KUMAR AP / MECH – KIT, CBE
The First S : SEIRI : CLEARING
Factory Floor Office Home
Machines to be Used / Broken Broken toys
scrapped pens
Rejected material Useless paper Old clothes
Expired goods Old diaries Broken suitcases
Broken tools, Broken furnitures
pallets, bins,
trolleys.
Old notices
Flow Chart :
Separating the wanted and unwanted
Junk & waste Repairable Wanted items
No use Repair
Discard To next step
Consequences of not practicing SEIRI :
The unwanted clutters up the place and the wanted are hard to find.
Every place can only hold so much.
Clutter sometimes causes misidentification.
Take out unnecessary items and throw them away
29. R PREM KUMAR AP / MECH – KIT, CBE
The Second S : SEITON : ARRANGING
Factory Floor Office Home
Unlabelled tool crib Unlabelled file cabinet Clutter
Cluttered shelves Cluttered drawer, No orderly
lockers etc. shelves, book cases, arrangement in
tables the rooms
Stores – no clear Records & documents
location system. Not arranged well
Things on the floor File heaps and papers
Consequences of not practicing SEITON :
Things are seldom available when needed.
Items are “lost‟ in stores.
Items – defectives and good ones get mixed up.
Accidents or near-accidents occur due to clutter.
Visual control of the shop floor is not possible.
Sometimes, production is lost because an item required is available but cannot
be found.
In some offices, Critical Excise records or tax records may not be traceable. This
can lead to finance loss, prosecution or embarrassment.
The Third S : SEISO : SWEEPING
Factory Floor Office Home
Dirty machines Dirty table & furniture Dirty furniture, floor,
Dust on product window, grills,
parts, R.Mtls. bookshelves.
Dirty jigs, fixtures Dirty office equipments
Dirty walls, roofs Littered floor
Littered floor Dirty windows
Consequences of not practicing SEISO :
Most machines are affected by dust & dirt and hence their performance may go
down.
Dust and dirt on products, materials, packing boxes etc. will affect either their
performance quality or their aesthetic look.
Unpleasant to work in.
Arrange everything in proper order so that it can be easily picked up for use.
Sweep your workplace thoroughly so that there is no dust anywhere.
30. R PREM KUMAR AP / MECH – KIT, CBE
The Fourth S : SEIKETSU : CLEANLINESS
Factory Floor Office Home
Handling hazardous Free of pests Pest control
chemicals Personal hygiene Personal hygiene
Control of fumes,
hazardous dust.
Disinfecting, Personal hygiene
Consequences of not practicing SEIKETSU :
Good health and safety require the practice of Seiketsu.
Hazardous chemicals, dusty chemicals, fumes etc. can make it a dangerous
place to work in.
Washing thoroughly and cleaning a place makes the workplace pleasant.
Personal hygiene is essential for healthy workforce.
The Fifth S : SHITSUKI : DISCIPLINE
Consequences of not practicing SEIKETSU :
If discipline is not practiced, then the first 4-S would backslide.
Lack of Shitsuki means not following the standards. Then, all activities related to
safety and quality will be affected.
IMPLEMENTING 5-S
1. Top Management resolve and training.
2. Formation of a top level team.
3. Understanding current circumstances.
4. Establishing priorities and targets.
5. Forming sub-teams and training.
6. Major cleaning.
7. Establishing improvement plans in each priority area.
8. Implementing the plan.
9. Verifying results.
10. Standardizing.
11. Establishing full control.
12. Looking for further improvements.
Washing with a strong overtone of keeping things disinfected as well as free of
hazardous chemicals.
Discipline especially with regard to safety rules and punctuality.
31. R PREM KUMAR AP / MECH – KIT, CBE
KAIZEN
Kaizen is a Japanese word for the philosophy that defines management‟s roles in
continuously encouraging and implementing small improvements involving everyone.
It focuses on simplification by breaking down complex progress into their
sub – processes and then improving them.
The Kaizen improvement focuses on the use of :
Value – added and non – value work activities.
Muda, which refers to the seven classes of waste – over-production, delay,
transportation, processing, inventory, wasted motion, and defective parts.
Principles of motion study and the use of cell technology.
Principles of materials handling and use of one – piece flow.
Documentation of standard operating procedures.
The five S‟s for workplace organization.
Visual management.
Just – in – time principles.
Poka – Yoke.
Team dynamics.
RE-ENGINEERING
It is the fundamental rethinking and radical redesign of business processes to
achieve dramatic improvements in critical measures of performance.
SUPPLIER PARTNERSHIP
The suppliers should be treated as partners to achieve the same quality level as
attained within the organization.
The following forces need Supplier Partnership to improve quality, reduce costs and
increase market share.
Deming Philosophy (Deming‟s 4th
point)
Just-in-time
Continuous process improvement
ISO 9000
CUSTOMER – SUPPLIER RELATIONS :
Dr. Kaoru Ishikawa has given ten principles of customer-supplier relations. They are
1. Both the customer and supplier are fully responsible for the control of quality.
2. Both the customer and supplier should be independent of each other.
3. The customer is responsible for providing the supplier with clear and sufficient
requirements so that the customer can know precisely what to produce.
32. R PREM KUMAR AP / MECH – KIT, CBE
4. Both the customer and supplier should enter into a non-adversarial contract.
5. The supplier is responsible for providing the quality that will satisfy the customer.
6. Both the customer and supplier should decide the method to evaluate the quality
of the product or services.
7. Both the customer and supplier should establish in the contract the method by
which they can reach an amicable settlement in case of any dispute.
8. Both the customers and supplier should continually exchange information.
9. Both the customer and supplier should perform business activities.
10.Both the customer and supplier should have the best interest of the end user in
mind.
PARTNERING
Partnering is a relationship between two or more parties based upon trust, dedication
to common goals.
The benefits of partnering are
Improved quality
Increased efficiency
Lower cost
Increased opportunity for innovation
Continuous improvement
The three key elements to a partnership relationship are
Long term commitment
Trust
Shared Vision
SOURCING
The three types of sourcing are
Sole sourcing
Multiple sourcing
Single sourcing
SUPPLIER SELECTION
The suppliers should be selected with the following ten conditions
1. The supplier should understand clearly the management philosophy of the
organization.
2. The supplier should have stable management system.
3. The supplier should maintain high technical standards.
4. The supplier should provide the raw materials and parts which meet quality
specifications required by the purchaser.
5. The supplier should have the required capability in terms of production.
6. The supplier should not leak out the corporate secrets.
7. The supplier should quote right price and should meet the delivery schedule. The
supplier should be accessible with respect to transportation and communication.
8. The supplier should be sincere in implementing the contract provisions.
33. R PREM KUMAR AP / MECH – KIT, CBE
9. The supplier should have an effective quality system such as ISO / QS 9000.
10.The supplier should be renowned for customer satisfaction.
SUPPLIER CERTIFICATION :
A certified supplier is one which, after extensive investigation, is found to supply
material of such quality that is not necessary to perform routine testing.
The Eight criteria for supplier certification are
1. No product related lot rejections for atleast 1 year.
2. No non-product related rejections for atleast 6 months.
3. No production related negative incidents for atleast 6 months.
4. Should have passed a recent on-site quality system evaluation.
5. Having a fully agreed specifications.
6. Fully documented process and quality system.
7. Timely copies of inspection and test data.
8. Process that is stable and in control.
SUPPLIER RATING :
Supplier Rating is done
To obtain an overall rating of supplier performance.
To communicate with suppliers regarding their performance.
To provide each supplier with a detailed and true record of problems for
corrective action.
To enhance the relationship between the buyer and the supplier.
RELATIONSHIP DEVELOPMENT :
For establishment of supplier relationship, the following are necessary.
(a) Partnering
(b) Supplier selection
(c) Principles of customer / supplier relations
(d) Certification
(e) Periodic rating
For relationship development, the following are necessary.
(a) Inspection
100% inspection
Sampling
Audit
Identity check
(b) Training
(c) Teams
(d) Recognition and Reward
34. R PREM KUMAR AP / MECH – KIT, CBE
PERFORMANCE MEASURES
Performance measures are required for the managers for managing an organization
perfectly.
Performance measures are used to achieve the following objectives.
To establish performance measures and reveal trend.
To identify the processes to be improved.
To determine the process gains and losses.
To compare the actual performance with standard performance.
To provide information for individual and team evaluation.
To determine overall performance of the organization.
To provide information for making proper decisions.
WHAT SHOULD BE MEASURED?
Human resources
1. Lost time due to accidents, absenteeism.
2. Employee turnover.
3. Employee satisfaction index.
4. Training cost per employee.
5. Number of grievances.
Customers
1. Number of complaints from customers.
2. Number of on-time deliveries.
3. Warranty data.
4. Dealer satisfaction.
Production
2. Inventory.
3. SPC Charts.
4. Amount of scrap / rework.
5. Machine down time.
Research and Development
2. New product time to market.
3. Design change orders.
4. Cost estimating errors.
Suppliers
2. On-time delivery.
3. Service rating.
4. Quality performance.
5. Average lead time.
35. R PREM KUMAR AP / MECH – KIT, CBE
Marketing / Sales
2. Sales expense to revenue.
3. New product sales to total sales.
4. New customers.
Administration
1. Revenue per employee.
2. Purchase order error.
3. Billing accuracy.
4. Cost of poor quality.
STRATEGY :
The quality council has the overall responsibility for the performance measures.It
ensures that all the measures are integrated into a total system of measures.
A typical system contains the following function
Quality
Cost
Flexibility
Reliability
Innovation
PERFORMANCE MEASURE PRESENTATION :
There are six basic techniques for presenting performance measures. They are
1. Time series graph.
2. Control charts.
3. Capability Index.
4. Taguchi‟s loss function.
5. Cost of poor quality.
6. Malcolm Baldrige National Quality Award.
In MBNQA, five categories are analyzed. They are
a) Manufacturing
b) Service
c) Small business
d) Health care
e) Education
36. R PREM KUMAR AP / MECH – KIT, CBE
UNIT III – TQM TOOLS AND TECHNIQUES I
TQM TOOLS (SEVEN TOOLS OF QUALITY)
1. PARETO DIAGRAM
2. FLOW DIAGRAM
3. CAUSE AND EFFECT DIAGRAM
STEPS IN CONSTRUCTING A CAUSE & EFFECT DIAGRAM :
a. Define the problem or effect to be analyzed.
b. Form the team to perform the analysis. Often the team will uncover potential
causes through brainstorming.
c. Draw the effect box and the centerline.
d. Specify the major potential cause categories and join them as boxes
connected to the centerline.
e. Identify the possible causes and classify them into the categories in step d.
Create new categories, if necessary.
f. Rank order the causes to identify those that seem most likely to impact the
problem.
g. Take corrective action.
VARIATION IN
STEAM
GENERATION
FUEL
INCREASED
MOISTURE
CONTENT
SUGAR
CONTENT
INCREASED
NATURE OF
BAGASSE
FIBRE
NON-UNIFORM
FLOW OF FUEL
BOILER
WATER
QUALITY
VARIATION
IN BOILER
WATER pH
VARIATION
IN BOILER
WATER TDS
VARIATION IN
FEED WATER
TEMPERATURE
WATER
VARIATION IN
WATER LEVEL
IN DRUM
DRAUGHT
SYSTEM
IMPROPER
FUNCTION
OF ID FAN
OF SA FAN
FUNCTION
IMPROPER
FUNCTION
OF FD FAN
IMPROPER
CAUSE AND EFFECT DIAGRAM
37. R PREM KUMAR AP / MECH – KIT, CBE
4. CHECK SHEETS
CHECK SHEET
Product : Bicycle
Nonconformity Type Check Total
----------------------------------------------------------------------------------------------------------------
Blister IIII IIII IIII IIII I 21
Light spray IIII IIII IIII 15
Drips IIII IIII IIII IIII IIII 25
Others IIII IIII IIII IIII IIII 25
----------------------------------------------------------------------------------------------------------------
TOTAL 86
----------------------------------------------------------------------------------------------------------------
5. HISTOGRAM
Number of Errors Tally of Number of Errors
------------------------------- -------------------------------------------------------------------
0 1 3 0 1 0 1 0 Number Non Tabulation Freq.
1 5 4 1 2 1 2 0 -conforming
1 0 2 0 0 2 0 1 -------------------------------------------------------------------
2 1 1 1 2 1 1 0 IIII IIII IIII 15
0 4 1 3 1 1 1 1 IIII IIII IIII IIII 20
1 3 4 0 0 0 0 2 IIII III 8
1 3 0 1 2 2 3 3 IIII 5
------------------------------- 4 III 3
5 I 1
-------------------------------------------------------------------
0 1 2 3 4 5
0
5
10
15
20
Number Non-confirming
Frequency
38. R PREM KUMAR AP / MECH – KIT, CBE
6. CONTROL CHARTS
Upper control limit
Centre line
Lower control limit
Sample number or time
Samplequalitycharacteristic
A typical control chart
7. SCATTER DIAGRAM
In scatter diagram, three types of co-relations exist.
1. Positive correlation.
2. Negative correlation.
3. No correlation.
NEW MANAGEMENT TOOLS
1. WHY, WHY
2. FORCED FIELD ANALYSIS
Define the objective.
Determine criteria for evaluating the effectiveness of the improvement
action.
Brainstorm the forces.
Prioritize the forces from greatest to least.
Take action.
39. R PREM KUMAR AP / MECH – KIT, CBE
Objective : Stop Smoking
----------------------------------------------------------------------------------------------------------------
Promoting Forces Inhibiting Forces
----------------------------------------------------------------------------------------------------------------
Poor Health Habit
Smelly Clothing Addiction
Poor Example Taste
Cost Stress
Impact on Others Advertisement
----------------------------------------------------------------------------------------------------------------
3. NOMINAL GROUP TECHNIQUE
4. AFFINITY DIAGRAM
5. INTER-RELATIONSHIP DIGRAPH
6. TREE DIAGRAM
7. MATRIX DIAGRAM
8. PRIORITIZATION MATRICES
9. PROCESS DECISION PROGRAM CHART
10.ACTIVITY NETWORK DIAGRAM
STATISTICAL FUNDAMENTALS
Statistics is defined as the science that deals with the collection, tabulation, analysis,
interpretation and presentation of quantitative data.
Data collected for quality control purposes are obtained by direct observation and
are classified as
1. Variables (Measurable quality characteristics like length measured in metres)
2. Attributes (Quality characteristic which are classified as either conforming (or)
non-conforming to specifications, such as “go & no-go” gauge.
MEASURES OF CENTRAL TENDENCY AND DISPERSION
There are two important analytical methods of describing a collection of data as
1. Measures of central tendency.
2. Measures of dispersion.
40. R PREM KUMAR AP / MECH – KIT, CBE
A measure of central tendency of a distribution is a numerical value that describes
how the data tend to build up in the centre. There are three measures in quality as
1. Average
2. Median
3. Mode
Average is the sum of observations divided by the number of observations.
i = n
Σ X i
Average = X = i = 1
n
where, n = number of observations
X i = observed value
Median is the value which divides a series of ordered observations so that the
number of items above it is equal to the number of items below it.
Mode is the value which occurs with the greatest frequency in a set of numbers.
Mode can again classified as
No mode
Uni mode
Bi mode
Multimode
Measure of dispersion describes how the data are spread out on each side of the
central value.
The two measures of dispersion are
1. Range
2. Standard Deviation
Range is the difference between the largest and smallest values of observations in a
series of numbers.
Range = R = X h – X l
Where, R = Range
X h = highest observation in a series
X l = lowest observation in a series
Standard Deviation measures the spreading tendency of the data. Larger the
standard deviation, greater the variability of data.
i = n
Σ (X i – X)2
S = i = 1
n - 1
41. R PREM KUMAR AP / MECH – KIT, CBE
where S = sample standard deviation
X i = observed value
n = number of observations
POPULATION AND SAMPLE
In order to construct a frequency distribution of the outer diameter of shafts, a small
portion (or) sample is selected to represent all the shafts. The population is the
whole collection of shafts.
The population may be an hour‟s production, a week‟s production, 10000 pieces and
so on.
It is not possible to measure all of the population. Hence, we go for sampling.
Sampling becomes necessary
1. When it is impossible to measure the entire population.
2. When it is more expensive to observe all the data.
3. When the required inspection destroys the product.
4. When a test of the entire population may be too dangerous as in the case of
new medical drug.
X is for sample average or sample mean.
µ is for population mean.
S is for sample standard deviation.
σ is for population standard deviation.
NORMAL CURVE
Normal curve is common type of population. The normal curve is symmetrical,
unimodal, bell – shaped distribution with the mean, median and mode all having the
same value.
LSL, LCL
TOLERANCE
6
AVERAGE
PROCESS
USL, UCL
SPEC.
MEAN
Figure 3.2 : Normal curve tolerance limits
42. R PREM KUMAR AP / MECH – KIT, CBE
CONTROL CHARTS FOR VARIABLES AND ATTRIBUTES
Variation is a law of nature because no two natural items in any category are the
same. Variations are due to the following reasons.
1. Chance causes or Natural causes.
2. Assignable causes.
Chance causes of variation are inevitable. Chance causes affect almost every
production process and are inherent in the process. They are purely random,
unidentifiable sources of variations.
Hence, when only chance causes are present in a process, the process is said to be
in Statistical Control.
Assignable causes result in unnatural variations. The sources of variations may be
due to
Equipments
Materials
Environment
Operator etc.
The Control chart is used to look at variations, seek assignable causes and chance
causes. The control chart is a line chart with control limits.
All control charts have three basic components.
1. A centre line, usually the mathematical average of all the samples plotted.
2. Upper and Lower Control Limits that define the constraints of common cause
variations.
3. Performance data plotted over time.
A typical control chart is a graphic display of a quality characteristic that has been
measured or computed from a sample versus sample number or time. If the
process is in control, nearly all of the sample points will fall between Upper Control
Limit (UCL) and Lower Control Limit (LCL).
CONTROL CHART FOR VARIABLES
1. Mean chart – X chart & Range Chart – R Chart
X
X = ------
N
Where, N = Total number of observations.
R n = Sample size (for finding out the value of A2
R = ------ and D4 and D3 from the table)
43. R PREM KUMAR AP / MECH – KIT, CBE
N
Control limits for the charts are given by the following equation.
X – Chart R - Chart
CL = X CL = R
UCL X = X + A2. R UCL R = D4. R
LCL X = X - A2. R LCL R = D3. R
2. Mean chart – X chart & Standard Deviation chart – S Chart
X
X = ------
N
Where, N = Total number of observations.
S n = Sample size (for finding out the value of A3
S = ------ and B4 and B3 from the table)
N
Control limits for the charts are given by the following equation.
X – Chart S - Chart
CL = X CL = S
UCL X = X + A3. S UCL S = B4. S
LCL X = X – A3. S LCL S = B3. S
CONTROL CHART FOR ATTRIBUTES
1. p chart
2. np chart
3. c chart
4. u chart
44. R PREM KUMAR AP / MECH – KIT, CBE
UNIT IV – TQM TOOLS AND TECHNIQUES II
BENCHMARKING
Benchmarking is a systematic method by which organizations can measure
themselves against the best industry practices.
Benchmarking is a systematic search for the best practices, innovative ideas,
and highly effective operating procedures.
BENCHMARKING CONCEPT
REASONS TO BENCHMARK :
It is a tool to achieve business and competitive objectives
It can inspire managers (and Organizations) to compete
It is time and cost effective
It constantly scans the external environment to improve the process
Potential and useful technological breakthroughs can be located and adopted
early
PROCESS OF BENCHMARKING
The following six steps contain the core techniques of Benchmarking
1. Decide what to benchmark
Benchmarking can be applied to any business or production process
The strategy is usually expressed in terms of mission and vision
statements
What is our
performance level ?
How do we do it ?
What are others
performance levels ?
How did they get there ?
Creative
Adaptation
Breakthrough Performance
45. R PREM KUMAR AP / MECH – KIT, CBE
Best to begin with the mission and critical factors
Choosing the scope of the Benchmarking study
Pareto analysis – what process to investigate
Cause and Effect diagram – for tracing outputs back
2. Understand current performance
Understand and document the current process
Those working in the process are the most capable of identifying and
correcting problems
While documenting, it is important to quantify
Care should be taken during accounting information
3. Plan
A benchmarking team should be chosen
Organizations to serve as the benchmark need to be identified
Time frame should be agreed upon for each of the benchmarking tasks
There are three types of benchmarking
a. Internal
b. Competitive
c. Process
4. Study Others
Benchmarking studies look for two types of information
How best the processes are practiced
Measurable results of these practices
Three techniques for conducting the research are
Questionnaires
Site visits
Focus groups
5. Learn from the data
Answering a series of questions like
Is there a gap between the organization‟s performance and the performance
of the best-in-class organizations?
What is the gap? How much is it?
Why is there a gap? What does the best-in-class do differently that is better?
If best-in-class practices were adopted, what would be the resulting
improvement?
Benchmarking studies can reveal three different outcomes
Negative gap
Parity
Positive gap
46. R PREM KUMAR AP / MECH – KIT, CBE
6. Using the findings
The objective is to close the gap. For this
Findings must be communicated to the people within the organization
Action plans must be developed to implement new processes
Groups that must agree on the change
Process owners
Upper management
Steps for the development and execution of action plans are
1. Specify tasks
2. Sequence tasks
3. Determine resources needs
4. Establish task schedule
5. Assign responsibility for each task
6. Describe expected results
7. Specify methods for monitoring results
PITFALLS AND CRITICISMS OF BENCHMARKING :
Idea of copying others
It is not a cure or a business philosophy
Some process have to be benchmarked repeatedly
It is not a substitute for innovation
QUALITY FUNCTION DEPLOYMENT
Quality Function Deployment is a planning tool used to fulfill customer
expectations.
Quality Function Deployment focuses on customer expectations or
requirements, often referred to as voice of the customer.
QFD TEAM :
There are two types of teams namely
1. Team for designing a new product
2. Team for improving an existing product
BENEFITS OF QFD :
1. Improves Customer satisfaction
Creates focus on customer requirements
Uses competitive information effectively
47. R PREM KUMAR AP / MECH – KIT, CBE
Prioritizes resources
Identifies items that can be acted upon
2. Reduces Implementation Time
Decreases midstream design changes
Limits post introduction problems
Avoids future development redundancies
3. Promotes Team Work
Based on consensus
Creates communication
Identifies actions
4. Provides Documentation
Documents rationale for design
Adds structure to the information
Adapts to changes (a living document)
HOUSE OF QUALITY :
Interrelationship
Between
Technical
Descriptors
Technical Descriptors
(Voice of the organization)
Relationship between
Requirements and
Descriptors
Prioritized
Technical Descriptors
CustomerRequirements
(Voiceofthecustomer)
Prioritized
CustomerRequirements
48. R PREM KUMAR AP / MECH – KIT, CBE
THE STEPS IN BUILDING A HOUSE OF QUALITY ARE :
1. List Customer Requirements (WHAT‟s)
2. List Technical Descriptors (HOW‟s)
3. Develop a Relationship Matrix Between WHAT‟s and HOW‟s
4. Develop an Inter-relationship Matrix between HOW‟s
5. Competitive Assessments
a. Customer Competitive Assessments
b. Technical Competitive Assessments
6. Develop Prioritized Customer Requirements
7. Develop Prioritized Technical Descriptors
TAGUCHI’S QUALITY LOSS FUNCTION
Taguchi‟s Quality Loss Function concept combines cost, target and variation in
one metric with specifications being of secondary importance.
Taguchi has defined quality as the loss imparted to society from the time a
product is shipped. Societal losses include failure to meet customer
requirements, failure to meet ideal performance and harmful side effects.
CUSTOMERS PERCEIVE QUALITY AS MEETING THE TARGET
RATHER THAN JUST MEETING THE SPECIFICATIONS.
There are three common quality loss functions
1. Nominal - the - best.
2. Smaller - the - better.
3. Larger - the - better.
49. R PREM KUMAR AP / MECH – KIT, CBE
NOMINAL – THE – BEST :
Although Taguchi developed so many loss functions, many situations are
approximated by the quadratic function which is called the Nominal – the – best
type.
The quadratic function is shown in figure. In this situation, the loss occurs as soon as
the performance characteristic, y, departs from the target τ.
At τ, the loss is Rs. 0.
At LSL (or) USL, the loss is Rs. A.
The quadratic loss function is described by the equation L = k (y - τ) 2
.
Where,
L = cost incurred as quality deviates from the target.
y = Performance characteristic
τ = target
k = Quality loss coefficient.
The loss coefficient is determined by setting ∆ = (y – τ), the deviation from the target.
When ∆ is the USL (or) LSL, the loss to the customer of repairing (or) discarding the
product is Rs. A.
Thus, K = A / (y – τ)2
= A / ∆2
.
Loss(Rs)
USL
A
τ + ∆
LSL
Performance Characteristic
Quadratic Loss Function
L
0
τ - ∆
Y
τ
50. R PREM KUMAR AP / MECH – KIT, CBE
SMALLER – THE – BETTER :
The following figure shows the smaller – the – better concepts.
The target value for smaller – the – better is 0. There are no negative values for the
performance characteristic.
The radiation leakage from a microwave appliance, the response time for a
computer, pollution from an automobile, out of round for a hole etc. are the
performance characteristics for this concept.
LARGER – THE – BETTER :
The following figure shows the concept of the Larger – the – better.
Loss(Rs)
A
Performance Characteristic
Smaller-the-better
L
0
y
y
51. R PREM KUMAR AP / MECH – KIT, CBE
In the Larger – the – better concept, the target value is ∞ (infinity), which gives a
zero loss. There are no negative values and the worst case is at y = 0. Actually,
larger – the – better is the reciprocal of smaller – the – better. The performance
characteristics in Larger – the – better are bond strength of adhesives, welding
strength etc.
TOTAL PRODUCTIVE MAINTENANCE (TPM)
Total Productive Maintenance (TPM) is defined as keeping the running plant and
equipment at its highest productive level with the co-operation of all areas of the
organization.
Predictive and Preventive maintenance are essential to building a foundation for
a successful TPM environment. Predictive Maintenance is the process of using
data and statistical tools to determine when a piece of equipment will fail.
Preventive Maintenance is the process of periodically performing activities such
as lubrication on the equipment to keep it running.
OBJECTIVES OF TPM :
1. To maintain and improve equipment capacity.
2. To maintain equipment for life.
3. To use support from all areas of the operation.
4. To encourage input from all employees.
5. To use teams for continuous improvement.
y
Loss(Rs)
A
Performance Characteristic
Larger-the-better
L
0
y
52. R PREM KUMAR AP / MECH – KIT, CBE
TPM PHILOSOPHY – CONCEPT OF TPM :
Total Productive Maintenance (TPM) is an extension of the Total Quality
Management (TQM) philosophy to the maintenance function.
TPM has the following steps:
1. Management should learn the new philosophy of TPM.
2. Management should promote the new philosophy of TPM.
3. Training should be funded and developed for everyone in the organization.
4. Areas of needed improvement should be identified.
Loss measurements to identify improvement needs are
Down time losses
Reduced speed losses
Poor quality losses
5. Performance goals should be formulated.
6. An implementation plan should be developed.
7. Autonomous worth groups should be established.
FAILURE MODE AND EFFECTS ANALYSIS
FMEA is an analytical technique that combines the technology and experience of
people in identifying foreseeable failure modes of a product or process and planning
for its elimination.
It is a group of activities comprising the following :
1. Recognize the potential failure of a product or process.
2. Identify actions that eliminate / reduce the potential failure.
3. Document the process.
Two important types of FMEA are
Design FMEA
Process FMEA
INTENT OF FMEA :
Continually measuring the reliability of a machine, product or process.
53. R PREM KUMAR AP / MECH – KIT, CBE
To detect the potential product - related failure mode.
FMEA evaluation to be conducted immediately following the design phase.
BENEFITS OF FMEA:
Having a systematic review of components failure modes to ensure that any
failure produces minimal damage.
Determining the effects of any failure on other items.
Providing input data for exchange studies.
Determining how the high-failure rate components can be adapted to high-
reliability components.
Eliminating / minimizing the adverse effects that failures could generate.
Helping uncover the misjudgements, errors etc.
Reduce development time and cost of manufacturing.
FMEA TEAM :
Engineers from
- Assembly - Manufacturing - Materials - Quality
- Service - Supplier - Customer
FMEA DOCUMENTATION :
The purpose of FMEA documentation is
To allow all involved Engineers to have access to others thoughts
To design and manufacture using these collective thoughts (promotes team
approach)
54. R PREM KUMAR AP / MECH – KIT, CBE
UNIT V – QUALITY MANAGEMENT SYSTEMS
ISO 9000 STANDARDS
ISO 9000
ISO 9001
ISO 9002
ISO 9003
ISO 9001
Design, Development, Production, Installation & Servicing
ISO 9002
Production, Installation & Servicing
ISO 9003
Inspection & Testing
ISO 9004
Provides guidelines on the technical, administrative and human factors affecting the
product or services.
BENEFITS OF ISO 9000 STANDARDS :
Achievement of international standard of quality.
Value for money.
Customer satisfaction.
Higher productivity.
Increased profitability
Improved corporate image
Access to global market
Growth of the organization
Higher morale of employees
CLAUSES (ELEMENTS) OF ISO 9000 (During the year 1987)
4.1 Management Responsibility
Adequate resources for the verification activities
Need for trained personnel
Work and verification activities including audits
A Management Representative to be identified
Review the Quality System performance and customer complaints
periodically
4.2 Quality System
55. R PREM KUMAR AP / MECH – KIT, CBE
4.3 Contract review
4.4 Design Control
4.5 Documents Control
4.6 Purchasing
4.7 Purchaser – Supplied Product
4.8 Product Identification and Traceability
4.9 Process Control
4.10 Inspection and Testing
4.11 Inspection Measuring and Test Equipment
4.12 Inspection and Test Status
4.13 Control of Non – Conforming Product
4.14 Corrective Action
4.15 Handling, Storage, Packaging and Delivery
4.16 Quality Records
4.17 Internal Quality Audits
4.18 Training
4.19 Servicing
4.20 Statistical Techniques
CLAUSES (ELEMENTS) OF ISO 9000 (During the year 2000)
1. Scope
2. Normative Reference
3. Terms and Definitions
4. Quality Management System (QMS)
General Requirements
Documentation
5. Management Responsibility
Management Commitment
Customer Focus
Quality Policy
Planning
Responsibility, Authority and Communication
Management Review
6. Resource Management
Provision of Resources
Human Resources
Infrastructure
Work Environment
7. Product Realization
Planning of Product Realization
Customer related processes
Design and Development
Purchasing
Production and Service Provision
Control of Monitoring and Measuring devices
8. Monitoring and Measurement
General
56. R PREM KUMAR AP / MECH – KIT, CBE
Monitoring and Measurement
Control of Non-Conforming Product
Analysis of Data
Improvement
IMPLEMENTATION OF QUALITY MANAGEMENT SYSTEM :
1. Top Management Commitment
2. Appoint the Management Representative
3. Awareness
4. Appoint an Implementation Team
5. Training
6. Time Schedule
7. Select Element Owners
8. Review the Present System
9. Write the Documents
10. Install the New System
11. Internal Audit
12. Management Review
13. Pre-assessment
14. Registration
PITFALLS OF SUCCESSFUL IMPLEMENTATION :
1. Using a generic documentation program or another organization‟s
documentation program
2. Over-documentation or documentation that is too complex
3. Using External Consultants without involvement
4. Neglecting to obtain top management‟s involvement
5. Developing a system that does not represent what actually occurs
DOCUMENTATION
In every organization, the quality system must be documented properly. The
documentation of the system can be seen as a hierarchical format as shown.
1
POLICY
2
PROCEDURE
3
PRACTICE
4
PROOF
57. R PREM KUMAR AP / MECH – KIT, CBE
QUALITY AUDITING
The term Audit refers to a regular examination and checking of accounts or financial
records, settlement or adjustment of accounts.
It also refers to checking, inspection and examination of Production Processes.
PURPOSE OF QUALITY AUDIT :
To establish the adequacy of the system.
To determine the effectiveness of the system.
To afford opportunities for system analysis.
To help in problem solving.
To make decision making easier etc.
TYPES OF QUALITY AUDIT :
1. First – Party Audit.
2. Second – Party Audit.
3. Third – Party Audit.
Quality audit can also be classified on the basis of the area taken into account for the
audit such as
System Audit.
Process Audit.
Product Audit.
Adequacy Audit.
Compliance Audit.
ISO 14000 – ENVIRONMENTAL MANAGEMENT SYSTEM
The overall aim of the Environmental Management systems is to provide
protection to the environment and to prevent pollution.
The success of ISO 9000 along with increased emphasis on Environmental
issues were instrumental in ISO‟s decision to develop Environmental
Management Standards.
In 1991, ISO formed the Strategic Advisory Group on the Environment
(SAGE) which led to the formation of Technical Committee (TC) 207 in 1992.
Mission of TC207 is to develop standards for an Environmental Management
System (EMS) which was identified as ISO 14000.
TC 207 has Established six sub-committees
1. Environmental Management System (EMS)
2. Environmental Auditing (EA)
3. Environmental labeling (EL)
58. R PREM KUMAR AP / MECH – KIT, CBE
4. Environmental Performance Evaluation (EPE)
5. Life-Cycle Assessment (LCA)
6. Terms & Definitions
Environmental Management System (EMS) :
EMS has two Evaluation Standards. They are
1. Organization Evaluation Standards 2. Product Evaluation Standards
REQUIREMENT OF ISO 14001
There are six elements
1. GENERAL REQUIREMENTS
EMS should include policy, planning implementation & operation, checking
& corrective action, management review.
2. ENVIRONMENTAL POLICY (Should be based on mission)
The policy must be relevant to the organization‟s nature.
Management‟s Commitment (for continual improvement & preventing
pollution).
Should be a framework (for Environmental objectives & Targets).
Must be Documented, Implemented, & Maintained.
3. PLANNING
Environmental Aspects
Legal & other Requirements
Objectives & Targets
Environmental Management Programs
4. IMPLEMENTATION & OPERATION
Structure & Responsibility
Training, Awareness & Competency
Communication
EMS Documentation
Document Control
Operational Control
Emergency Preparedness & Response
5. CHECKING & CORRECTIVE ACTION
Monitoring & Measuring
Nonconformance & Corrective & Preventive action
Records
EMS Audit
59. R PREM KUMAR AP / MECH – KIT, CBE
6. MANAGENMENT REVIEW
Review of objectives & targets
Review of Environmental performance against legal & other requirement
Effectiveness of EMS elements
Evaluation of the continuation of the policy
BENEFITS OF ENVIRONMENTAL MANAGEMENT SYSTEM :
GLOBAL BENEFITS
Facilitate trade & remove trade barrier
Improve environmental performance of planet earth
Build consensus that there is a need for environmental management and a
common terminology for EMS
ORGANIZATIONAL BENEFITS
Assuring customers of a commitment to environmental management
Meeting customer requirement
Improve public relation
Increase investor satisfaction
Market share increase
Conserving input material & energy
Better industry/government relation
Low cost insurance, easy attainment of permits & authorization
*******