QUALMAN QUIZ # 1 Reviewer
•
1 like•1,352 views

SEVEN (7) CONCEPTS OF TQM Continous Improvement Six Sigma Employee Empowerment Benchmarking Just-in-Time Taguchi Concept Knowledge of TQM tools

Recommended
More Related Content
What's hot
What's hot (20)
Viewers also liked
Viewers also liked (17)
Similar to QUALMAN QUIZ # 1 Reviewer
Similar to QUALMAN QUIZ # 1 Reviewer (20)
More from Samantha Abalos
More from Samantha Abalos (14)
Recently uploaded
Recently uploaded (20)
QUALMAN QUIZ # 1 Reviewer
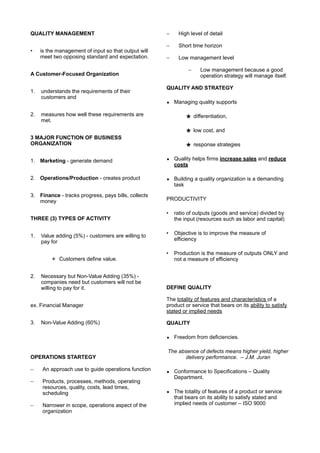
- 1. QUALITY MANAGEMENT • is the management of input so that output will meet two opposing standard and expectation. A Customer-Focused Organization 1. understands the requirements of their customers and 2. measures how well these requirements are met. 3 MAJOR FUNCTION OF BUSINESS ORGANIZATION 1. Marketing - generate demand 2. Operations/Production - creates product 3. Finance - tracks progress, pays bills, collects money THREE (3) TYPES OF ACTIVITY 1. Value adding (5%) - customers are willing to pay for ✴ Customers define value. 2. Necessary but Non-Value Adding (35%) - companies need but customers will not be willing to pay for it. ex. Financial Manager 3. Non-Value Adding (60%) OPERATIONS STARTEGY – An approach use to guide operations function – Products, processes, methods, operating resources, quality, costs, lead times, scheduling – Narrower in scope, operations aspect of the organization – High level of detail – Short time horizon – Low management level – Low management because a good operation strategy will manage itself. QUALITY AND STRATEGY • Managing quality supports ★ differentiation, ★ low cost, and ★ response strategies • Quality helps firms increase sales and reduce costs • Building a quality organization is a demanding task PRODUCTIVITY • ratio of outputs (goods and service) divided by the input (resources such as labor and capital) • Objective is to improve the measure of efficiency • Production is the measure of outputs ONLY and not a measure of efficiency DEFINE QUALITY The totality of features and characteristics of a product or service that bears on its ability to satisfy stated or implied needs QUALITY • Freedom from deficiencies. The absence of defects means higher yield, higher delivery performance. – J.M. Juran • Conformance to Specifications – Quality Department. • The totality of features of a product or service that bears on its ability to satisfy stated and implied needs of customer – ISO 9000
- 2. QUALITY BASED ON DIFFERENT VIEWS • User-based – better performance, more features • Manufacturing-based – conformance to standards, making it right the first time • Product-based – specific and measurable attributes of the product MEASURING QUALITY “We cannot control what we cannot quantify” WHAT IS VALUE? • Adding form fit, or function to the product or service. VALUE DEFINITION • Customer Value: A task or activity for which the customer would be willing to pay. • Business Value: A task that is required to build a window but for which the customer is not willing to pay • Non-Value Add (WASTE): A task that is not required and should be eliminated because it is wasteful ✴ Do not be mistaken to reduce value-adding activities TWO (2) WAYS TO IMPROVE PROFITABILITY 1. Sales gain via a. Improved response b. Flexible pricing c. Improved reputation 2. Reduce cost via a. Increase productivity b. Lower rework and scarp cost c. Lower warranty cost IMPLICATIONS OF QUALITY 1. Company reputation • Perception of new products • Employment practices • Supplier relations 2. Product liability • Reduce risk 3. Global implications • Improved ability to compete KEY DIMENSIONS OF QUALITY 1. Performance 2. Features 3. Reliability 4. Conformance 5. Durability 6. Serviceability 7. Aesthetics 8. Perceived quality 9. Value COST OF QUALITY • Prevention costs - reducing the potential for defects • Appraisal costs - evaluating products, parts, and services • Internal failure - producing defective parts or service before delivery • External costs - defects discovered after delivery TOTAL QUALITY MANAGEMENT (TQM) • Encompasses entire organization, from supplier to customer • Stresses a commitment by management to have a continuing, companywide drive toward excellence in all aspects of products and services that are important to the customer
- 3. SEVEN (7) CONCEPTS OF TQM 1. Continous Improvement 2. Six Sigma 3. Employee Empowerment 4. Benchmarking 5. Just-in-Time 6. Taguchi Concept 7. Knowledge of TQM tools CONTINUOUS IMPROVEMENT • Continual Improvement in all aspects • Involves all operations and work center including supplier and customer SHEWHART’S PDCA MODEL 1. Plan - Identify what to improve and make a plan 2. Do - test the plan 3. Check - is the plan working 4. Act - implement the plan SIX SIGMA Two (2) meanings: 1. Statistical definition of a process that is 99.9997% capable, 3.4 defects per million opportunities (DPMO) ✴ Opportunity refers to possible aspects of quality of one product 2. a methodology designed to reduce defects, lower cost, improve customer satisfaction ✴ You want all product as near as possible to the tolerance area (x) since the graph has the tendency to shift. METHODOLOGY OF SIX SIGMA 1. Define critical output and identify gaps of improvement. 2. Measure the work and collect process data 3. Analyze data 4. Improve the process 5. Control the new process to make sure new performance is maintained QUALITY CIRCLE • Groups of people who meet regularly to solve problems • Trained in planning, problem solving, and statistical methods • Often led by a facilitator • Very effective when done properly EMPLOYEE EMPOWERMENT • Getting employees involved in product and process improvements • 85% of quality problems are due to process and material • Techniques • Build communication networks that include employees • Develop open, supportive supervisors • Move responsibility to employees • Build a high-morale organization • Create formal team structures BENCHMARKING Selecting best practices to use as a standard for performance. • compare to competitors • only use if your company is big enough ★ Determine what to benchmark ★ Form a benchmark team
- 4. ★ Identify benchmarking partners ★ Collect and analyze benchmarking information ★ Take action to match or exceed the benchmark BEST PRACICES IN RESOLVING CUSTOMER COMPLAINS ‣ Make it easy for clients to complain ‣ Respond quickly to complaints ‣ Resolve complaints on first contact ‣ Use computers to manage complaints ‣ Recruit the best for customer service jobs JUST IN TIME (JIT) • ’Pull’ system of production scheduling including supply management • Production only when signaled • Allows reduced inventory levels • Inventory costs money and hides process and material problems • Encourages improved process and product quality ✴ Not about speed. It’s about Flow. ✴ Faster Speed = Proper Rhythm JIT relationship to quality: 1. cuts the cost of quality 2. improves quality ‣ does not only apply to perishable goods ‣ w/o JIT cost of inventory increases. HOW TO ACHIEVE JIT? 1. Value - adding function to product or service 2. Value Stream 3. Flow - to produce and move on item at a time through a series of processing steps as continuously as possible without stopping or changing pace 4. Pull - doing thing only when it is required by the next process. - Strives to eliminate over prodiction and is the essential concept of JIT - Nothing is produce until a customer wants it. 5. Perfection - “lean” is a continuous, evolutionary process of change and adaptation - not a singular, idealized vision or technology-driven goal state. - LEAN is CHANGE TAGUCHI CONCEPT Engineering and experimental design methods to improve product and process design ‣ Identify key component and process variables affecting product variation Taguchi Concepts ‣ Quality robustness ‣ Quality loss function ‣ Target-oriented quality QUALITY ROBUSTNESS Ability to produce products uniformly in adverse manufacturing and environmental conditions • Remove the effects of adverse conditions • Small variations in materials and process do not destroy product quality TOOLS OF TQM Tools for Generating Ideas • Check sheets - an organized method of gathering data • Scatter diagrams - graphs the relationship of two variables • Cause-and-effect diagrams - a tool that identifies the process elements (cause) that
- 5. might affect outcome (effect). Ex. fish bone diagrams • Why-Why Diagram - just keep asking why until you reach an answer. Ex. Tree Diagram Tools to Organize the Data • Pareto charts - A graph to identify and plot problems or defects in descending order of frequency. - 80% of the contribution is the cause of the problem • Flowcharts - a chart that describe the steps of a process Tools for Identifying Problems • Histogram - A distribution showing the frequency of occurrences of a variable • Statistical process control chart - A chart with time on the horizontal axis to plot values of a statistic Check List Scatter Diagram Cause and Effect Diagram Why - Why Diagram Pareto Chart Flow Chart Histogram Statistical Process Control Chart
- 6. STATISTICAL PROCESS CONTROL • Assumed that variability is inherent in every process • natural process or common cause • special or assignable cause • Provides a signal to detect assignable causes • Detects and eliminate assignable cause of variation Four (4) Key Steps 1. Measure the process 2. When a change is indicated, find the assignable cause 3. Eliminate or incorporate the cause 4. Restart the revised process INSPECTION ❖ Involves examining items to see if an item is good or defective • Detect a defective product ❖ Does not correct deficiencies in process or product • It is expensive ❖ Issues • When to inspect • Where in process to inspect WHEN AND WHERE TO INSPECT 1. At the supplier’s plant while the supplier is producing 2. At your facility upon receipt of goods from the supplier 3. Before costly or irreversible processes 4. During the step-by-step production process 5. When production or service is complete 6. Before delivery to your customer 7. At the point of customer contact INSPECTION ❖ Many problems • Worker fatigue • Measurement error • Process variability ❖ Cannot inspect quality into a product ❖ Robust design, empowered employees, and sound processes are better solutions SOURCE OF INSPECTION • Also known as source control • The next step in the process is your customer • Ensure perfect product to your customer Poka-yoke is the concept of foolproof devices or techniques designed to pass only acceptable product ATTRIBUTES VS VARIABLES • Attributes ‣ Items are either good or bad, acceptable or unacceptable ‣ Does not address degree of failure • Variables ‣ Measures dimensions such as weight, speed, height, or strength ‣ Falls within an acceptable range • Use different statistical techniques TQM IN SEVICE Service quality is more difficult to measure than the quality of goods Service quality perceptions depend on ‣ Intangible differences between products ‣ Intangible expectations customers have of those products
- 7. SERVICE QUALITY The operations manager must recognize: 1. the tangible components of service is important 2. the service process is important 3. service is judged according to customer expectations 4. expectations will occur DETERMINANTS OF SERVICE QUALITY 1. Reliability 2. Responsiveness 3. Competence 4. Access 5. Courtesy 6. Communication 7. Credibility 8. Security 9. Understanding/ knowing the customer 10. Tangibles SERVICE RECOVERY STATEGY Managers should have a plan for when services fail Marriott’s LEARN routine • Listen • Empathize • Apologize • React • Notify