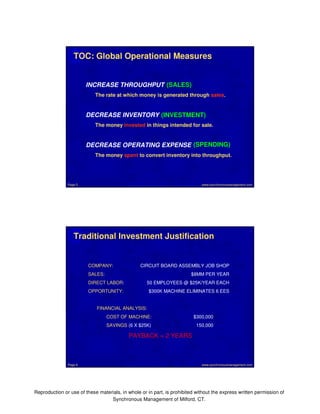
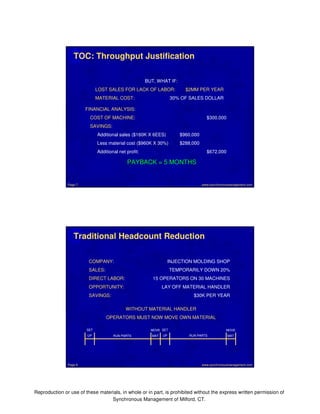
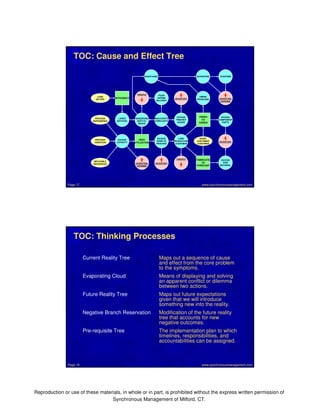
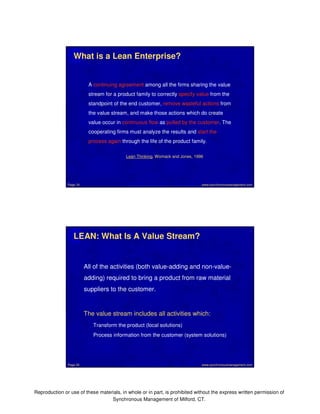
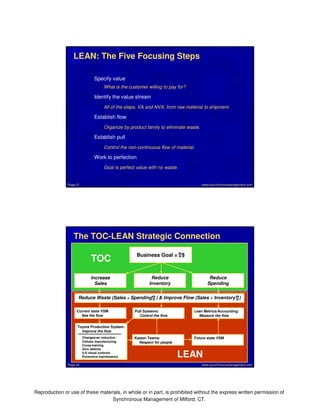
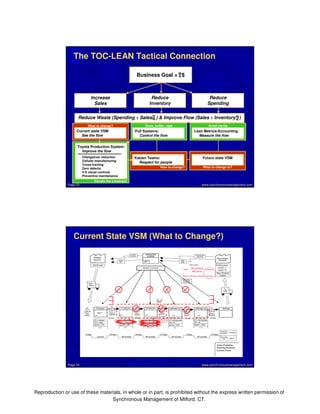
The document discusses the relationship between the Theory of Constraints (TOC) and Lean Manufacturing. It defines basic TOC concepts and explores how TOC and Lean can be synergistic. The key connection is that TOC aims to increase throughput and reduce inventory and expenses, while Lean seeks to reduce waste and improve flow, which supports the TOC goals. Applying both approaches together can help organizations maximize profits through continuous improvement efforts.
This document provides an overview of Lean fundamentals and tools. It discusses the history and evolution of manufacturing, the key principles of Lean thinking around value, value streams, flow, pull and perfection. It then describes the basic Lean tools for identifying and eliminating waste, including takt time, time observation, bar charts, spaghetti diagrams, standard work, visual management and pull systems. The goal of these tools is to optimize workflow, reduce waste and enable continuous improvement through establishing standard processes and engaging employees.
The document discusses the Theory of Constraints (TOC), a management paradigm that views any system as being limited by a small number of constraints. It explains that TOC uses the "five focusing steps" to identify the system's constraint, exploit it, subordinate everything else to it, elevate it, and ensure it does not reoccur. The document provides details on each step and emphasizes that TOC views continuous improvement as an ongoing process of addressing constraints through efficient management and leadership.
Lean manufacturing aims to maximize customer value and minimize waste. It involves using minimal inventory, having short lead times from customer order to product shipment, and eliminating sources of waste. The key aspects of lean manufacturing include just-in-time production, continuous flow, standardized work, and built-in quality. Toyota pioneered the Toyota Production System, which focuses on eliminating waste and respecting people.
Webinar held on July 15, 2009
Lean Fundamentals Overview
Presented by: Michael E. Parker
Description:
Utilizing my one-on-one training by lean experts from Toyota Motor Corporation (TMC) in Japan's Toyota City, you'll receive an overview on the main fundamentals that drive the lean management philosophy and learn how you can begin implementing these philosophies in your business. Whether you are a small business owner, entrepreneur, mid-level to senior-level manager or director, you will gain valuable insight on the critical business issues you are facing today and how to utilize lean management principles to recognize areas to reduce costs, add value and change your processes for the better.
We will discuss these key fundamentals of lean management:
o Cost Reduction Principle
o Lead-Time Reduction
o 7 Forms of Waste
o Just-In-Time
o Built-in-Quality (Jidoka)
o Level Scheduling (Heijunka)
o Pull Systems (Kanban)
o Kaizen
The document describes a workshop on introducing lean principles to software development. It begins with an agenda and introduction to lean concepts. Participants then take part in hands-on exercises simulating production processes to experience issues like waste, uneven workflow, and inflexibility without lean. The exercises demonstrate how lean tools like kanban, pull systems, and multitasking can address these issues and improve flow. The workshop emphasizes that lean is not just tools but a long-term philosophy of continuous improvement respecting people.
This document discusses lean production methods for 1-piece flow versus batch and queue production. It notes that a bottleneck will always exist in any process, and that bottlenecks can move. It recommends managing a buffer before the bottleneck and avoiding high work-in-process, which can mask the bottleneck. The document also discusses benefits of 1-piece flow such as workers being able to help each other and learn different tasks, and improving bottleneck operations.
The document provides an overview of Lean manufacturing and the Toyota Production System. It discusses how Toyota implemented Lean principles beginning in the 1950s to become highly efficient and profitable. The core concepts of Lean include eliminating waste, reducing lead times, and continuous improvement. Lean aims to optimize flow and pull production using tools like just-in-time, standard work, and visual management. Kaizen events are used to rapidly improve processes by multidisciplinary teams identifying and eliminating sources of waste.
This document provides an overview of lean manufacturing training. It defines lean manufacturing as eliminating waste to improve efficiency. Key aspects include identifying value from the customer's perspective, streamlining processes, and producing only what is needed when it is needed. Lean aims to deliver high quality products with minimal costs and resources. The training teaches lean tools and principles to help organizations achieve continuous process improvement. Attendees learn how to recognize and remove waste to enhance productivity, quality, and profits. The goals of lean are to satisfy customers while running operations profitably.
This document provides information on value stream mapping (VSM), including:
1. VSM is a visual tool that maps the flow of materials and information needed to bring a product to a customer. It identifies value-added and non-value added activities to improve process flow and eliminate waste.
2. There are three main types of value streams: raw material to finished product, concept to launch, and order to cash.
3. A current state map visually depicts the actual state of the current process flow, including metrics like cycle times and changeover times.
4. A future state map is then created to design an improved process flow based on eliminating waste and improving flow, with goals and an
This document discusses ways to reduce setup and changeover time through SMED (Single Minute Exchange of Die) techniques without significant capital expenditures. It outlines the goals of setup reduction as reducing lead times and costs while improving flexibility, productivity, and customer service. Key techniques mentioned include separating internal and external setup steps, standardizing processes, improving tool and equipment design, visual controls, and cross-training operators. Critical success factors include eliminating waste, empowering operators, applying 5S principles, encouraging teamwork, producing in small lot sizes, and focusing on continuous improvement.
The document describes the steps to construct a value stream map (VSM). It involves defining the current state map by gathering information on physical and information flows, cycle times, bottlenecks and defects. The future state map is then created by mapping an improved process and an implementation plan is made to achieve this. Key steps include identifying the product family, start/end points, gathering data on times, flows, inspections and linking this to create a current state map with production lead times. Future state suggestions aim to reduce changeovers and level production.
Kaizen focuses on continuous improvement through small changes involving all employees. It emphasizes good processes that produce good results through fair practices and a zero tolerance policy for deviations. Kaizen aims to eliminate waste by following 5S practices and making small, incremental changes rather than large, infrequent changes. The Kaizen process involves identifying problems, planning and implementing solutions, and ensuring goals continue to be met through an ongoing cycle of assessment and improvement.
Value Stream Mapping is a key component of Value Stream Management – the process by which Lean concepts and tools are utilized to minimize waste and promote one piece flow pulled by customer demand through the entire operation.
Lean Quick Changeover (SMED) Training ModuleFrank-G. Adler
The Lean Quick Changeover (SMED) Training Module v2.0 includes:
1. MS PowerPoint Presentation including 65 slides covering an Introduction to Lean Management, The Seven Lean Wastes, Lean Kaizen Events, and a Step-by-Step Changeover Time Reduction (SMED) Process.
2. MS Excel Changeover Time Analysis Worksheet Template
This presentation is for the students of Bainbridge Graduate Institute in the Sustainable Operations Course, MGT-564. It provides a high level overview of the most basic tools used by Toyota and lean manufacturing. This is a SlideCast which means there is an AUDIO TRACK, so please turn on your speakers. The presentation is 33 minutes long.
Know about Just-In-Time and Lean manufacturing system. Find benefits and difference between JIT and Lean Manufacturing by Nilesh Arora, a founder of AddValue Consulting Inc.
The document outlines the 14 management principles of the Toyota Way. The two pillars are continuous improvement and respect for people. The principles include developing a long-term vision, creating continuous process flow, using pull systems to avoid overproduction, leveling out workload, building a culture of stopping to fix problems, using visual controls, developing exceptional people and teams, respecting suppliers, going to see problems firsthand, making decisions by consensus, and becoming a learning organization.
This document provides 12 questions to ask during a "Gemba walk" to help identify opportunities for process improvement. The questions focus on understanding the value created, the current process, normal/abnormal states, what is working well/not being maintained/broken, what is not understood/documented, and what is creating waste, strain, or unevenness. Asking these questions while directly observing the process can help identify issues and enhancement opportunities.
The document discusses pull systems and how they work. It defines pull systems as methods for controlling the flow of resources by replacing only what has been consumed. It contrasts this with push systems, which provide resources based on forecasts. It provides examples of how pull signals like cards or containers can be used to trigger the replenishment of consumed materials.
Lean manufacturing aims to eliminate waste by focusing on value-added activities. It was developed based on the Toyota Production System and considers seven types of waste. Key Lean principles include specifying value from the customer perspective, making value flow without interruptions, and continuously improving processes through eliminating waste. Techniques like 5S, standard work, visual management, and value stream mapping are used to implement Lean.
Download the presentation together with train-the-trainer guide and workshop templates at http://wcm.nu
This presentation is made by Oskar Olofsson, WCM Consulting AB
Make changes in the background template if you want to change the appearance
The document summarizes a value stream mapping project for a pilot plant producing a new product. The pilot plant runs trials of compounds developed in R&D to test commercial production feasibility. It aims to deliver 50kg of the product per month to customers in 3kg batches on a weekly schedule. The value stream mapping shows that raw materials currently sit in the warehouse for 10 days before processing, and intermediate and finished products also accumulate inventory before pulling by customers. Areas for improvement include reducing inventory times, increasing uptime of key processes like reaction and distillation, and decreasing changeover times across processes.
Value stream mapping is a tool originally developed by Toyota to improve manufacturing processes. It uses symbols and flow charts to depict the current and future state of process flows. The goal is to understand how a product or service currently moves through all steps from beginning to end, then design a leaner future state to eliminate waste. Key aspects include drawing current and future state maps, determining TAKT time to match production pace to customer demand, and developing an implementation plan to achieve the future state.
This chapter discusses strategic capacity planning in operations management. It defines strategic capacity planning as determining overall capacity levels of facilities, equipment, and labor force size. The chapter covers topics like capacity utilization rates, economies and diseconomies of scale, experience curves, capacity flexibility, determining capacity requirements through forecasting, and using decision trees to analyze capacity planning options. Maintaining the appropriate capacity levels is important for balancing production needs while ensuring good service quality.
Chapter 18 management (10 th edition) by robbins and coulterMd. Abul Ala
This document provides an overview of chapter 18 from the textbook "Managing Operations" by Stephen P. Robbins and Mary Coulter. It covers the key topics in operations management including defining operations management, the role of operations managers in improving productivity, value chain management, quality initiatives like ISO 9000 and Six Sigma, and current issues like the role of technology and mass customization. The learning outcomes at the start list the main sections and key concepts covered in the chapter.
The document discusses the Theory of Constraints (TOC), which aims to improve flow, increase throughput, and reduce variation in systems by identifying, exploiting, and elevating their constraints. It outlines TOC's key assumptions and measures, and explains how TOC is similar to concepts in Kanban and Lean. The document suggests applying TOC to software development by focusing on flow rather than resource utilization, identifying potential bottlenecks, using cross-skilling to reduce waste, and removing failure demand to increase throughput.
Capsim Strategic Management Simulation: First Place. We simulated developing silicon wafers for 6 rounds representing 6 years. We chose broad differentiation as a a strategy. Even though I was CEO for round 5 & 6, I drove the strategy starting round 1
This document provides an overview of the Theory of Constraints (TOC). It defines key TOC concepts like constraints, throughput, inventory, operating expense, and the five focusing steps. It also explains tools like the drum-buffer-rope concept, Little's Law, takt time, and cycle time. An example shows how to identify the constraint in a process. The goal of TOC is to strengthen the weakest link in a system by first identifying and then improving the constraint.
The Theory of Constraints (TOC) is a management philosophy that views an organization as being limited in achieving more of its goals by a very small number of constraints. The core of TOC is that an organization must first identify its constraints, then exploit, subordinate everything else to, elevate, and repeat this process for the next constraint. This involves using buffers, focusing on throughput, operating expenses, and inventory, and making sure constrained resources are never idle and prioritized over non-constrained resources. A real example demonstrated how a medical products plant actively managed constraints by adding capacity or shifting focus to the next constraint.
ADV Slides: Why Organizations Don’t Change When They Need ToDATAVERSITY
So you have a great idea for the data in your organization. Maybe it’s been acknowledged by some prominent leaders, but nothing ever happens. When the speaker has done his Action Plans for organizations over the years, he’s heard more questions from clients directed elsewhere in the organization about how to get the initiatives moving than he has heard about the initiatives he is creating. Organizations are mostly not good at moving good ideas forward.
Why does this happen and what can be done about it? The speaker will share his experience with utilizing his favorite skill – getting things done in enterprises.
Dislodge the logjams, make data a key asset, and make your organization an attractive, progressive place for data talent in 2021.
Business Technology Management, Inc. (BTM) was founded in 1987, and over the years has taught and implemented its proprietary business improvement methodology called Flow Management Technology (FMT) for businesses worldwide. FMT is a powerful and well-proven methodology that has helped small and large organizations to dramatically increase resources' output, assets utilization and overall throughput while simultaneously reducing inventory, lead time, and cost; all without the need for capital expenditure. FMT can be implemented in any organization regardless of type, size, product or service provided and will lead to improved business performance by 30% to 50% within less than a year. BTM has implemented FMT at a broad spectrum of industries including automotive, electronics, apparel, aerospace, tools & equipment, as well as Engineering processes, Product Development, Purchasing, Project Management, Logistics, Distribution and various service industries.
The basis of FMT is viewing the entire organization as a flow system and addressing the fact that every organization is an extremely dynamic environment where chaos constantly appears, and causes moving bottlenecks, fire fighting, late deliveries, excess inventories, etc. In order to overcome the cumulative effect of chaos, FMT analyzes processes in the organization using Pareto principles and statistical techniques, and as in hydraulic systems, builds key control mechanisms into the process to control the flow through the pipeline and to act as shock absorbers and flow accelerators. In addition, a variety of feedback control loops are installed to monitor lead times, inventories, and customer deliveries. This allows focused process improvement that dramatically increases resources' output and asset utilization. As a result, performance is shifted to a new dimension—throughput increases in order of magnitude while inventory, lead times, and cost are reduced simultaneously without investment in capital equipment. Bottlenecks are eliminated, their associated fire fighting disappears, and a new level of flexibility and customer service is achieved. FMT applies to all organizations regardless of type, size, product or service. In addition, by understanding product velocity and the organization's hidden capacities, a new business decision-making tool is introduced to identify profitable opportunities that are overlooked by current accounting systems.
Successfully Achieving And Delivering ResultsThrough Rigorous Project Select...shawncarner
This document discusses the need for rigorous project prioritization tools and processes at Genentech and provides examples of project prioritization approaches used at different sites within Genentech. It highlights the benefits of standardized, transparent prioritization processes, including better use of resources, managing change capacity, and increased understanding and quantification of project impacts. Examples of prioritization tools and processes currently used at different sites are presented, along with next steps to further improve and standardize prioritization across sites.
Impact from the Jiangsu explosion on Chemical Business in ChinaJohnny Browaeys - 庄博闻
This document discusses using data and technology to improve business and supply chain resilience in China. It describes how companies can use environmental data and monitoring to conduct risk screening of suppliers and operations. This allows companies to identify which entities may face issues like relocation or closure due to changing policies. Companies can then take proactive steps to mitigate risks and ensure the resilience of their business operations and supply chains. The document also introduces Greenment, a Chinese environmental consulting firm that has developed proprietary databases and technology to help companies with these types of data-driven risk assessments and dynamic risk management.
2010 IFMA DC Sustainability - 2 Shades Of Greenmchobot
Facilities professionals are struggling with balancing environmental impacts and financial impacts. This presentation goes over three key challenges and offers some ideas on how to approach sustainability in a pragmatic way.
- The Organization’s Environment
- The Changing Environment
- Adapting to a Changing Environment
- Framework for Response to Environment
- Dependence on External Resources
- Influencing External Resources
5 Key Elements to Drive Flow - Part 3: Continuous ImprovementPam Bednar
Continuous Improvement is the focus of the third installment in our series, the 5 Key Elements to Drive Flow. This episode reviews best practice approaches for Continuous Improvement and its impact on Demand-Driven Manufacturing flow.
Lean manufacturing aims to eliminate waste in processes to improve value for customers. It involves analyzing information and material flows to continuously improve processes. Key aspects of lean include just-in-time production, standardized work, visual controls, quality at the source, and reducing set-up times and batch sizes. The Toyota Production System developed these lean principles to allow for producing many models in low volumes. Lean identifies seven types of waste including transportation, inventory, motion, waiting, overproduction, overprocessing, and defects. Implementing cells, kanban systems, and focusing on continuous improvement can help eliminate waste.
The document discusses how work is being transformed by new technologies that allow work to be done from anywhere. It argues that companies need to embrace flexible, mobile work arrangements in order to reduce costs by up to 40% while improving productivity, worker satisfaction, and organizational agility. New communication technologies are changing where and how work gets done, with over two-thirds of knowledge work now performed outside of traditional offices. The document provides examples of companies that have successfully implemented mobile work programs with significant benefits.
080324 Miller Opportunity Matrix Asq Presentationrwmill9716
The document describes a methodology called the "Opportunity Matrix" used by Six Sigma teams at Solutia to systematically identify and address root causes impacting manufacturing process performance. The method involves brainstorming by process experts to develop a list of potential issues, ranking them to create the matrix, and having team members champion high-priority causes. Examples are given of four teams that successfully applied this approach to improve yields and reduce costs, including identifying issues like head pressure variations on winders. In conclusion, the approach continues to generate over $10 million in annual savings for Solutia.
This document outlines ChemCo's change management plan to address lack of engagement, standardization, and communication through Kotter's 8-step model. The plan aims to empower employees, innovate processes, and align the company. Key elements include forming a guiding coalition, developing a strategic vision to empower and innovate, communicating the vision, removing barriers like silos and outdated systems, celebrating short-term wins, and instituting permanent change to increase engagement and profitability. The expected outcomes include $120 million in annual cost savings through 1.15% efficiencies at each of ChemCo's 21 manufacturing sites.
The document analyzes a company's workers compensation claims department performance using data and predictive analytics. It summarizes the results of an audit of over 800 claims which found issues with data integrity, initial investigations, and reserving practices. The analysis identified groups like female workers that were under-reserved and high cost occupational groups. It recommends the company focus on improving processes in areas like claim intake, investigations, reserving, and expense management to better measure and improve performance.
The document provides an overview of the Six Sigma approach for process improvement. It discusses key Six Sigma concepts like defects per million opportunities (DPMO) and six sigma quality levels. The document also presents examples and tools used in the Six Sigma DMAIC problem-solving methodology. These include value stream mapping, control charts, Pareto diagrams, cause-and-effect diagrams and more. Implementation of Six Sigma requires top management support, a steering group, training Black Belts and Green Belts, and applying tools and methods to process improvement projects.
Chaplin School of Hospitality and Tourism ManagementInternship Lea.docxcravennichole326
Chaplin School of Hospitality and Tourism ManagementInternship Lean 6σ Process Improvement Project
Improving the Speed, Accuracy, Reliability, Cost Effectiveness and Flow of the (Y) process.
A picture of you in front of your company here.
Executive Summary
Executive Summary
Please describe your project in this box. If it does not fit in the box, it is too long, and you must shorten it. Shoot for the 5W’s and the H, but be brief. (Who, what, when, where, why, how)
Table of Contents
i
Executive Summaryi
Message from the Professoriii
Why we are using this method in the advanced internship classiii
About Lean 6σiii
Criteria for the Projectiii
Define1
1.1Project Charter and Financial Estimate1
1.2 Current State Process Map2
Measure3
2.1 Data Collection Plan3
2.2 Collection Results4
Analyze5
3.1 Voice of the Customer5
3.2 Voice of the Business5
3.3 Voice of the Employee (WIFM)5
3.4 Waste Analysis – DOWNTIME6
4.1 Addressing gaps in VOC needs7
Improve
4.2Addressing gaps VOB needs7
4.3 Addressing VOE concerns/ Alternate WIFM7
4.4Reduction of Waste8
4.5 Summary of Recommended
Solution
s8
Control9
5.1 Modification to Procedures Manuals (Or Establishment of Internal Controls)9
Lessons Learned10
Supervisor’s Critique11
Message from the Professor
Why we are using this method in the advanced internship class
Our internship students are within a semester or two of entering the workforce as managers. FIU’s Hospitality and Tourism Management School has included a structured internship as part of the curriculum for over a decade to assist students with this transition into management. A substantial part of the course has always included a project where the students were to improve the host company’s operations in a meaningful and lasting way.About Lean 6σ
This project is a scaled down Lean 6σ ( six sigma) project designed to be completed within the term of the semester. Lean 6σ is a continuous process improvement method which has grown in use in U.S. and international corporations since the 1970’s. Employed to great success at companies like Motorola, this method aims to refine a company’s existing processes through data based analysis and evidence based decision making.
U.S.-based quality professionals who complete any Six Sigma training earn on average $12,642 more than those without it. 2011 QP Salary Survey*Criteria for the Project
· The project must be based on a real need in the company, and have the support of the student’s supervisor.
· Must be able to be completed to in 10 weeks or (40 hours)
This template is the intellectual property of Jason L. Stiles, Ph.D. All rights reserved.
2
Define
A description of the current process and proposed financial benefits
1.1 Project Charter and Financial Estimate
Project Charte ...
This document discusses approaches to implementing Manufacturing Execution Systems (MES). It begins by defining MES and describing the ISA-95 manufacturing operations model. It then contrasts two approaches: the "big bang" implementation of all MES functionality at once versus incremental implementation by selecting individual capabilities. The document advocates for the incremental approach, arguing it has advantages in terms of cost, change management, implementation complexity and return on investment analysis. It provides guidance on developing a long-term roadmap for MES implementation, including establishing goals, identifying opportunities and building implementation plans in a collaborative manner.
This document discusses approaches to implementing Manufacturing Execution Systems (MES). It begins by defining MES and describing the traditional "big bang" implementation approach versus a more incremental "evolutionary" approach. The incremental approach is recommended, where individual MES capabilities are selected and implemented over time in smaller projects. The document provides guidance on developing a long-term roadmap by understanding business goals, mapping manufacturing processes, and identifying initial high-impact opportunities. It emphasizes taking a process-centric view and including relevant stakeholders.
Leveraging Gap Analysis for Continuous ImprovementCIToolkit
Gap analysis compares two different states of something, the current state and the future state. It is mainly used to assess where a company or process is today, where it needs to be in the future, and what needed to be there. Gap analysis is also known as need analysis or need assessment.
Understanding Inductive Bias in Machine LearningSUTEJAS
This presentation explores the concept of inductive bias in machine learning. It explains how algorithms come with built-in assumptions and preferences that guide the learning process. You'll learn about the different types of inductive bias and how they can impact the performance and generalizability of machine learning models.
The presentation also covers the positive and negative aspects of inductive bias, along with strategies for mitigating potential drawbacks. We'll explore examples of how bias manifests in algorithms like neural networks and decision trees.
By understanding inductive bias, you can gain valuable insights into how machine learning models work and make informed decisions when building and deploying them.
Literature Review Basics and Understanding Reference Management.pptxDr Ramhari Poudyal
Three-day training on academic research focuses on analytical tools at United Technical College, supported by the University Grant Commission, Nepal. 24-26 May 2024
Presentation of IEEE Slovenia CIS (Computational Intelligence Society) Chapte...University of Maribor
Slides from talk presenting:
Aleš Zamuda: Presentation of IEEE Slovenia CIS (Computational Intelligence Society) Chapter and Networking.
Presentation at IcETRAN 2024 session:
"Inter-Society Networking Panel GRSS/MTT-S/CIS
Panel Session: Promoting Connection and Cooperation"
IEEE Slovenia GRSS
IEEE Serbia and Montenegro MTT-S
IEEE Slovenia CIS
11TH INTERNATIONAL CONFERENCE ON ELECTRICAL, ELECTRONIC AND COMPUTING ENGINEERING
3-6 June 2024, Niš, Serbia
We have compiled the most important slides from each speaker's presentation. This year’s compilation, available for free, captures the key insights and contributions shared during the DfMAy 2024 conference.
Advanced control scheme of doubly fed induction generator for wind turbine us...IJECEIAES
This paper describes a speed control device for generating electrical energy on an electricity network based on the doubly fed induction generator (DFIG) used for wind power conversion systems. At first, a double-fed induction generator model was constructed. A control law is formulated to govern the flow of energy between the stator of a DFIG and the energy network using three types of controllers: proportional integral (PI), sliding mode controller (SMC) and second order sliding mode controller (SOSMC). Their different results in terms of power reference tracking, reaction to unexpected speed fluctuations, sensitivity to perturbations, and resilience against machine parameter alterations are compared. MATLAB/Simulink was used to conduct the simulations for the preceding study. Multiple simulations have shown very satisfying results, and the investigations demonstrate the efficacy and power-enhancing capabilities of the suggested control system.
A review on techniques and modelling methodologies used for checking electrom...nooriasukmaningtyas
The proper function of the integrated circuit (IC) in an inhibiting electromagnetic environment has always been a serious concern throughout the decades of revolution in the world of electronics, from disjunct devices to today’s integrated circuit technology, where billions of transistors are combined on a single chip. The automotive industry and smart vehicles in particular, are confronting design issues such as being prone to electromagnetic interference (EMI). Electronic control devices calculate incorrect outputs because of EMI and sensors give misleading values which can prove fatal in case of automotives. In this paper, the authors have non exhaustively tried to review research work concerned with the investigation of EMI in ICs and prediction of this EMI using various modelling methodologies and measurement setups.
Embedded machine learning-based road conditions and driving behavior monitoringIJECEIAES
Car accident rates have increased in recent years, resulting in losses in human lives, properties, and other financial costs. An embedded machine learning-based system is developed to address this critical issue. The system can monitor road conditions, detect driving patterns, and identify aggressive driving behaviors. The system is based on neural networks trained on a comprehensive dataset of driving events, driving styles, and road conditions. The system effectively detects potential risks and helps mitigate the frequency and impact of accidents. The primary goal is to ensure the safety of drivers and vehicles. Collecting data involved gathering information on three key road events: normal street and normal drive, speed bumps, circular yellow speed bumps, and three aggressive driving actions: sudden start, sudden stop, and sudden entry. The gathered data is processed and analyzed using a machine learning system designed for limited power and memory devices. The developed system resulted in 91.9% accuracy, 93.6% precision, and 92% recall. The achieved inference time on an Arduino Nano 33 BLE Sense with a 32-bit CPU running at 64 MHz is 34 ms and requires 2.6 kB peak RAM and 139.9 kB program flash memory, making it suitable for resource-constrained embedded systems.
A SYSTEMATIC RISK ASSESSMENT APPROACH FOR SECURING THE SMART IRRIGATION SYSTEMSIJNSA Journal
The smart irrigation system represents an innovative approach to optimize water usage in agricultural and landscaping practices. The integration of cutting-edge technologies, including sensors, actuators, and data analysis, empowers this system to provide accurate monitoring and control of irrigation processes by leveraging real-time environmental conditions. The main objective of a smart irrigation system is to optimize water efficiency, minimize expenses, and foster the adoption of sustainable water management methods. This paper conducts a systematic risk assessment by exploring the key components/assets and their functionalities in the smart irrigation system. The crucial role of sensors in gathering data on soil moisture, weather patterns, and plant well-being is emphasized in this system. These sensors enable intelligent decision-making in irrigation scheduling and water distribution, leading to enhanced water efficiency and sustainable water management practices. Actuators enable automated control of irrigation devices, ensuring precise and targeted water delivery to plants. Additionally, the paper addresses the potential threat and vulnerabilities associated with smart irrigation systems. It discusses limitations of the system, such as power constraints and computational capabilities, and calculates the potential security risks. The paper suggests possible risk treatment methods for effective secure system operation. In conclusion, the paper emphasizes the significant benefits of implementing smart irrigation systems, including improved water conservation, increased crop yield, and reduced environmental impact. Additionally, based on the security analysis conducted, the paper recommends the implementation of countermeasures and security approaches to address vulnerabilities and ensure the integrity and reliability of the system. By incorporating these measures, smart irrigation technology can revolutionize water management practices in agriculture, promoting sustainability, resource efficiency, and safeguarding against potential security threats.
Introduction- e - waste – definition - sources of e-waste– hazardous substances in e-waste - effects of e-waste on environment and human health- need for e-waste management– e-waste handling rules - waste minimization techniques for managing e-waste – recycling of e-waste - disposal treatment methods of e- waste – mechanism of extraction of precious metal from leaching solution-global Scenario of E-waste – E-waste in India- case studies.
DEEP LEARNING FOR SMART GRID INTRUSION DETECTION: A HYBRID CNN-LSTM-BASED MODELgerogepatton
As digital technology becomes more deeply embedded in power systems, protecting the communication
networks of Smart Grids (SG) has emerged as a critical concern. Distributed Network Protocol 3 (DNP3)
represents a multi-tiered application layer protocol extensively utilized in Supervisory Control and Data
Acquisition (SCADA)-based smart grids to facilitate real-time data gathering and control functionalities.
Robust Intrusion Detection Systems (IDS) are necessary for early threat detection and mitigation because
of the interconnection of these networks, which makes them vulnerable to a variety of cyberattacks. To
solve this issue, this paper develops a hybrid Deep Learning (DL) model specifically designed for intrusion
detection in smart grids. The proposed approach is a combination of the Convolutional Neural Network
(CNN) and the Long-Short-Term Memory algorithms (LSTM). We employed a recent intrusion detection
dataset (DNP3), which focuses on unauthorized commands and Denial of Service (DoS) cyberattacks, to
train and test our model. The results of our experiments show that our CNN-LSTM method is much better
at finding smart grid intrusions than other deep learning algorithms used for classification. In addition,
our proposed approach improves accuracy, precision, recall, and F1 score, achieving a high detection
accuracy rate of 99.50%.
ACEP Magazine edition 4th launched on 05.06.2024Rahul
This document provides information about the third edition of the magazine "Sthapatya" published by the Association of Civil Engineers (Practicing) Aurangabad. It includes messages from current and past presidents of ACEP, memories and photos from past ACEP events, information on life time achievement awards given by ACEP, and a technical article on concrete maintenance, repairs and strengthening. The document highlights activities of ACEP and provides a technical educational article for members.
2. Operations Strategy in a Global Environment.ppt
Theory of Constraints and Lean
1. The Theory of Constraints &
Lean Manufacturing
Don Guild
Synchronous Management, Milford, CT
P: 203-877-1287 E: synchronous@att.net
www.synchronousmanagement.com
Reproduction or use of these materials, in whole or in part, is prohibited without the express
written permission of Synchronous Management of Milford, CT.
Objectives
• Define basic Theory of Constraints concepts
• Examine the application of TOC
• Explore the linkage between TOC and LEAN
• How to gain synergy of TOC and LEAN
www.synchronousmanagement.Page 2 com
Reproduction or use of these materials, in whole or in part, is prohibited without the express written permission of
Synchronous Management of Milford, CT.
2. What is the Theory of Constraints?
A business philosophy which seeks to strive
towards the global objective, or goal, of a system
through an understanding of the underlying cause
and effect.
Theory of Constraints, Eli Goldratt, 1990
www.synchronousmanagement.Page 3 com
TOC: What is the Goal?
GOAL = $
NET PROFIT
(Absolute)
RETURN ON
INVESTMENT
(Relative)
CASH FLOW
(Survival)
THROUGHPUT INVENTORY
OPERATING
EXPENSE
Page 4 www.synchronousmanagement.com
Reproduction or use of these materials, in whole or in part, is prohibited without the express written permission of
Synchronous Management of Milford, CT.
3. TOC: Global Operational Measures
INCREASE THROUGHPUT
(SALES)
The rate at which money is generated through sales.
DECREASE INVENTORY
(INVESTMENT)
The money invested in things intended for sale.
DECREASE OPERATING EXPENSE
(SPENDING)
The money spent to convert inventory into throughput.
www.synchronousmanagement.Page 5 com
Traditional Investment Justification
COMPANY: CIRCUIT BOARD ASSEMBLY JOB SHOP
SALES: $8MM PER YEAR
DIRECT LABOR: 50 EMPLOYEES @ $25K/YEAR EACH
OPPORTUNITY: $300K MACHINE ELIMINATES 6 EES
FINANCIAL ANALYSIS:
COST OF MACHINE: $300,000
SAVINGS (6 X $25K) 150,000
PAYBACK = 2 YEARS
Page 6 www.synchronousmanagement.com
Reproduction or use of these materials, in whole or in part, is prohibited without the express written permission of
Synchronous Management of Milford, CT.
4. TOC: Throughput Justification
BUT, WHAT IF:
LOST SALES FOR LACK OF LABOR: $2MM PER YEAR
MATERIAL COST: 30% OF SALES DOLLAR
FINANCIAL ANALYSIS:
COST OF MACHINE: $300,000
SAVINGS:
Additional sales ($160K X 6EES) $960,000
Less material cost ($960K X 30%) $288,000
Additional net profit: $672,000
PAYBACK = 5 MONTHS
www.synchronousmanagement.Page 7 com
Traditional Headcount Reduction
COMPANY: INJECTION MOLDING SHOP
SALES: TEMPORARILY DOWN 20%
DIRECT LABOR: 15 OPERATORS ON 30 MACHINES
OPPORTUNITY: LAY OFF MATERIAL HANDLER
SAVINGS: $30K PER YEAR
WITHOUT MATERIAL HANDLER
OPERATORS MUST NOW MOVE OWN MATERIAL
SET
UP RUN PARTS
MOVE
MAT
SET
UP RUN PARTS
Page 8 www.synchronousmanagement.com
Reproduction or use of these materials, in whole or in part, is prohibited without the express written permission of
Synchronous Management of Milford, CT.
MOVE
MAT
5. TOC: Inventory Reduction
WITH MATERIAL HANDLER
SET UP MORE OFTEN & RUN SMALLER BATCHES
SET
UP
SET
UP
www.synchronousmanagement.Page 9 com
TOC: What is a System?
The total business, taken as a whole.
Not a division, cost center, or department.
The level at which financial ownership exists.
Reproduction or use of these materials, in whole or in part, is prohibited without the express written permission of
Synchronous Management of Milford, CT.
SET
UP
SET
RUN PARTS UP RUN PARTS RUN PARTS RUN PARTS
RESULTS
INVENTORY REDUCTION: $300,000
COST REDUCTION (10%): $30K PER YEAR
Page 10 www.synchronousmanagement.com
6. TOC: What is a Constraint?
A constraint is anything that limits a system from
achieving higher performance versus its goal.
Logistical: Physical, e.g. bottleneck, plant layout, long
changeovers.
Managerial: Policy, e.g. efficiency, utilization, allocations,
absorption.
Behavioral: Human, e.g. resistance to change, lack of
understanding, politics.
www.synchronousmanagement.Page 11 com
TOC: What are the Elements of TOC?
• Global operational measures
• Five focusing steps
• Process of ongoing improvement
• Drum, buffer, rope
• Cause and effect trees
• Thinking processes
• Throughput accounting
Page 12 www.synchronousmanagement.com
Reproduction or use of these materials, in whole or in part, is prohibited without the express written permission of
Synchronous Management of Milford, CT.
7. TOC: The Five Focusing Steps
Identify the system’s constraints.
Usually very few, but at least one
Decide how to exploit the system’s constraints.
Don’t waste the constraint
Subordinate everything else to the constraints.
Non-constraints supply only what constraints need
Elevate the system’s constraints.
Open up the capacity of the constraints
If a constraint has been broken, repeat the process, but
avoid inertia.
Another constraint will limit performance
www.synchronousmanagement.Page 13 com
TOC: Process of Ongoing Improvement
What to change?
Diagnosis: Description of "current reality" and the core
problem that will have a major impact
To what to change?
Description of “desired state” and strategy to attain it
How to change?
Detailed plans for what needs to happen in the group
effort to implement the change
Page 14 www.synchronousmanagement.com
Reproduction or use of these materials, in whole or in part, is prohibited without the express written permission of
Synchronous Management of Milford, CT.
8. TOC: Drum, Buffer, Rope
Drum
Focusing step: Identify the constraint
What to do: Schedule the constraint to capacity
Buffer
Focusing step: Exploit the constraint
What to do: Protect the constraint against Murphy
Rope
Focusing step: Subordinate non-constrained resources
What to do: Release raw materials to drum schedule
www.synchronousmanagement.Page 15 com
TOC: Cause and Effect Tree
SHORTAGES EXPEDITING OVERTIME
REALITY POLICY RESULT
TIMING
PROBLEMS
IMPACT ON
BUSINESS
GOAL
PROCESS
DEPENDENCE
PROCESS
VARIATION
HIGH
UTILIZATION
EXCESS
COMPONENT
PARTS
INVENTORY
INVENTORY
Reproduction or use of these materials, in whole or in part, is prohibited without the express written permission of
Synchronous Management of Milford, CT.
LONG
SETUPS
INFLEXIBLE
RESOURCES
SHORT
CUSTOMER
LEADTIMES
EFFICIENCY
EXCESS
CAPACITY
OPERATING
EXPENSE
EXCESS
WORK IN
PROCESS
LONG
PRODUCTION
LEADTIMES
EXCESS
RAW
MATERIAL
INVENTORY
LARGE
BATCHES
WANDERING
BOTTLE-NECKS
INACCURATE
FORECASTS
EXCESS
FINISHED
GOODS
POOR
ONTIME
DELIVERY
THRUPUT
OPERATING
EXPENSE
THRUPUT
FINISH
TO
ORDER
FABRICATE
TO
FORECAST
9. TOC: Cause and Effect Tree
PROCESS
DEPENDENCE
PROCESS
VARIATION
SHORTAGES EXPEDITING OVERTIME
HIGH
UTILIZATION
EXCESS
COMPONENT
PARTS
INVENTORY
INVENTORY
TIMING
PROBLEMS
www.synchronousmanagement.Page 17 com
TOC: Thinking Processes
Current Reality Tree Maps out a sequence of cause
and effect from the core problem
to the symptoms.
Evaporating Cloud Means of displaying and solving
an apparent conflict or dilemma
between two actions.
Future Reality Tree Maps out future expectations
given that we will introduce
something new into the reality.
Negative Branch Reservation Modification of the future reality
tree that accounts for new
negative outcomes.
Pre-requisite Tree The implementation plan to which
timelines, responsibilities, and
accountabilities can be assigned.
Reproduction or use of these materials, in whole or in part, is prohibited without the express written permission of
Synchronous Management of Milford, CT.
LONG
SETUPS
INFLEXIBLE
RESOURCES
SHORT
CUSTOMER
LEADTIMES
EFFICIENCY
EXCESS
CAPACITY
OPERATING
EXPENSE
EXCESS
WORK IN
PROCESS
LONG
PRODUCTION
LEADTIMES
EXCESS
RAW
MATERIAL
INVENTORY
LARGE
BATCHES
WANDERING
BOTTLE-NECKS
INACCURATE
FORECASTS
EXCESS
FINISHED
GOODS
POOR
ONTIME
DELIVERY
THRUPUT
OPERATING
EXPENSE
THRUPUT
FINISH
TO
ORDER
FABRICATE
TO
FORECAST
Page 18 www.synchronousmanagement.com
10. What is a Lean Enterprise?
A continuing agreement among all the firms sharing the value
stream for a product family to correctly specify value from the
standpoint of the end customer, remove wasteful actions from
the value stream, and make those actions which do create
value occur in continuous flow as pulled by the customer. The
cooperating firms must analyze the results and start the
process again through the life of the product family.
Lean Thinking, Womack and Jones, 1996
www.synchronousmanagement.Page 19 com
LEAN: What Is A Value Stream?
All of the activities (both value-adding and non-value-adding)
required to bring a product from raw material
suppliers to the customer.
The value stream includes all activities which:
Transform the product (local solutions)
Process information from the customer (system solutions)
Page 20 www.synchronousmanagement.com
Reproduction or use of these materials, in whole or in part, is prohibited without the express written permission of
Synchronous Management of Milford, CT.
11. LEAN: The Five Focusing Steps
Specify value
What is the customer willing to pay for?
Identify the value stream
All of the steps, VA and NVA, from raw material to shipment.
Establish flow
Organize by product family to eliminate waste.
Establish pull
Control the non-continuous flow of material.
Work to perfection
Goal is perfect value with no waste.
www.synchronousmanagement.Page 21 com
The TOC-LEAN Strategic Connection
Reduce Waste (Sales ÷ Spending ) & Improve Flow (Sales ÷ Inventory )
Lean Metrics/Accounting:
Measure the flow
LEAN
Page 22 www.synchronousmanagement.com
Reproduction or use of these materials, in whole or in part, is prohibited without the express written permission of
Synchronous Management of Milford, CT.
TOC
Business Goal = $
Reduce
Spending
Reduce
Inventory
Increase
Sales
Kaizen Teams:
Respect for people
Future state VSM
Current state VSM
See the flow
Pull Systems:
Control the flow
Toyota Production System:
Improve the flow
Changeover reduction
Cellular manufacturing
Cross-training
Zero defects
5-S visual controls
Preventive maintenance
12. The TOC-LEAN Tactical Connection
Business Goal = $
Reduce Waste (Spending ÷ Sales ) & Improve Flow (Sales ÷ Inventory )
What to change? Drum, buffer, rope Avoid inertia
Elevate the constraint
Lean Metrics/Accounting:
Measure the flow
How to change? What to change to?
www.synchronousmanagement.Page 23 com
Current State VSM (What to Change?)
Reproduction or use of these materials, in whole or in part, is prohibited without the express written permission of
Synchronous Management of Milford, CT.
Reduce
Spending
Reduce
Inventory
Increase
Sales
Kaizen Teams:
Respect for people
Future state VSM
Current state VSM
See the flow
Pull Systems:
Control the flow
Toyota Production System:
Improve the flow
Changeover reduction
Cellular manufacturing
Cross-training
Zero defects
5-S visual controls
Preventive maintenance
Page 24 www.synchronousmanagement.com
13. Future State VSM (To What to Change?)
www.synchronousmanagement.Page 25 com
VSM Action Plan (How To Change?)
Page 26 www.synchronousmanagement.com
Reproduction or use of these materials, in whole or in part, is prohibited without the express written permission of
Synchronous Management of Milford, CT.
14. The Toyota Production System
Changeover reduction
Cellular manufacturing
Cross-training
Zero defects
5-S visual factory
Total productive maintenance
www.synchronousmanagement.Page 27 com
Changeover Details
The time required for removing the old tools, dies or fixtures; attaching
new tools, dies or fixtures and running the machine until a new part,
without defects, is produced.
Completion
of last
Good Part
Locate
tools,
dies or
fixtures
Attach
new
Run
Part
Enter
Offsets
Run
Part
Adjust
Completion
of first
Good Part
Page 28 www.synchronousmanagement.com
Reproduction or use of these materials, in whole or in part, is prohibited without the express written permission of
Synchronous Management of Milford, CT.
1st piece
inspection
Set-up Time
Set-up time includes run time and adjustment time until a good part is
produced. If a good part is produced with no adjustments, run time is part of
machine process time.
15. Cellular Manufacturing
PROCESS FOCUS PRODUCT FOCUS
RECEIVING
SHIPPING
STOCK
ROOM
TEST
= POU RAW MATERIAL
www.synchronousmanagement.Page 29 com
Cross-Training Matrix
Reproduction or use of these materials, in whole or in part, is prohibited without the express written permission of
Synchronous Management of Milford, CT.
CIRCUIT
BOARD
ASSEMBLY
FINAL
ASSEMBLY
SUB
ASSEMBLY
CABLE
ASSEMBLY
SHIPPING
CABLE
ASSY
CIRCUIT
BOARD
TEST
FINAL
ASSEMBLY
SUB
ASSEMBLY
= POU FINISHED GOODS
Page 30 www.synchronousmanagement.com
16. 5-S Visual Factory
Make waste in the workplace visible
Sort (seiri): separate & remove unneeded items
Set in order (seiton): arrange items for easy access
Shine (seiso): clean the work area
Standardize (seiketsu): detailed plan to maintain first 3-S’s
Sustain (shitsuke): ongoing commitment of workforce
www.synchronousmanagement.Page 31 com
Attaining Zero Defects
Define defects
Track rejects
Pareto analysis
Root cause analysis
Corrective action
Poka-yoke: error-proofing
Page 32 www.synchronousmanagement.com
Reproduction or use of these materials, in whole or in part, is prohibited without the express written permission of
Synchronous Management of Milford, CT.
17. Total Productive Maintenance (OEE)
A = Total Available Time
B = Uptime Downtime
B/A = Availability rate
C = Standard Output
D = Actual Output Speed loss
www.synchronousmanagement.Page 33 com
The Kaizen Approach
The Kaizen Event is a focused, short-term project to
improve a process.
1. Initial Analysis of Process:
• Event area selection
• Team selection
• Development of a contract and a mandate
2. Kaizen Blitz Event:
• Full day of training
• Process analysis & baseline measurement
• Development & implementation of new processes
• Formal presentation of the process and accomplishment
3. Follow Up:
• Debug the process
• Assure timely completion of all remaining action items
• Assure the new process is institutionalized
Reproduction or use of these materials, in whole or in part, is prohibited without the express written permission of
Synchronous Management of Milford, CT.
Minor stops
D/C = Performance rate
F = Good Output Quality
yields
E = Actual Output
E/F = Quality rate
OEE = B/A x D/C x E/F
Page 34 www.synchronousmanagement.com
18. The Five Steps of TOC and TPS
Identify the system’s constraints
Level-loading and EPEI
Exploit the constraint
Supermarkets, 5-S
(DRUM)
(BUFFER)
Subordinate all else to the constraint
Kanban
Elevate the constraint
TPM, SMED, OEE, 6SIGMA
Repeat the process – avoid inertia
Lean metrics
(ROPE)
www.synchronousmanagement.Page 35 com
Controlling Flow With Pull (or DBR?)
“The most significant source of waste is
overproduction, which means producing more,
sooner or faster than is required by the next
process.”
Learning to See
by Mike Rother & John Shook
Moving from push to pull production has the single
greatest impact on improving material flow and
eliminating waste.
Page 36 www.synchronousmanagement.com
Reproduction or use of these materials, in whole or in part, is prohibited without the express written permission of
Synchronous Management of Milford, CT.
19. ID Constraint: Level Load vs. Level Mix
LEVEL LOAD: GOOD LEVEL MIX: BETTER
ITEM MON TUE WED THU FRI
B 100
C 100
D 100
E 100
TOTAL 100 100 100 100 100
ITEM MON TUE WED THU FRI
A 20 20 20 20 20
C 20 20 20 20 20
D 20 20 20 20 20
E 20 20 20 20 20
www.synchronousmanagement.Page 37 com
The Replenishment Interval is . . .
. . . the shortest period (usually in days) over which a
resource can make some of every product.
. . . resource-specific, not product-specific.
. . . capacity-driven, not cost-driven.
. . . also known as Every Part Every Interval (EPEI).
Reproduction or use of these materials, in whole or in part, is prohibited without the express written permission of
Synchronous Management of Milford, CT.
A 100
B 20 20 20 20 20
TOTAL 100 100 100 100 100
What is the shortest replenishment interval over which a
resource can set up and make some of every part?
Page 38 www.synchronousmanagement.com
20. Setting the Replenishment Interval
Available resource time per day
Minus:
Time to cycle one day’s parts
Daily changeover time available
Divided into:
www.synchronousmanagement.Page 39 com
Example: A 3-Day Replenishment Interval
Reproduction or use of these materials, in whole or in part, is prohibited without the express written permission of
Synchronous Management of Milford, CT.
Equals:
Total changeovers on all parts
Equals:
Replenishment Interval in days
Available resource time per day
Time to cycle one day’s parts
Total changeovers on all parts
21. Example: A 3-Day Replenishment Interval
Some of every part . . .
Every three days!
www.synchronousmanagement.Page 41 com
Example: Acme Stamping SpotWeld 2
1 machines X 2 shifts X 460 minutes
31 736 (80% 920 mins/u70p5time) day
184
PART W/C C/O MINS C/T SECS
DAILY
DEMAND
DAILY
CYCLE TIME
Page 42 www.synchronousmanagement.com
Reproduction or use of these materials, in whole or in part, is prohibited without the express written permission of
Synchronous Management of Milford, CT.
MINS EPEI BATCH
LH BRACKET SPOTWELD2
RH BRACKET SPOTWELD2
TOTAL
10
10
46
46
600
320
EPEI = 20
31 = .65 days
20
460
245
705
.65
.65
300
210
22. Who Is The Constraint?
www.synchronousmanagement.Page 43 com
Exploit Constraint: Supermarkets
A strategically-placed inventory of an item, which:
• Triggers replenishment based on consumption of the item
• Protects the flow of material through the value stream
• Links the flow among value streams and loops
• Focuses additional lean improvements
Reproduction or use of these materials, in whole or in part, is prohibited without the express written permission of
Synchronous Management of Milford, CT.
Supplier
EPEI=
1 DAY
Process
C
EPEI =
2 DAYS
Customer
Process
B
EPEI =
5 DAYS
Process
A
EPEI =
3 DAYS
The longer the interval,
the more constrained the resource!
Page 44 www.synchronousmanagement.com
23. Sizing Supermarkets
SUPPLIER CUSTOMER
Average Demand During
Replenishment
Interval
Safety Stock
To Cover
Deviation From Average
Average Demand During
Replenishment
Lead Time
Replenishment Interval
CONSUMPTION PATTERN
All driven by the daily rate!
www.synchronousmanagement.Page 45 com
Total
Super
Market
aka
Standard
Inventory
Sizing Supermarkets
Average Demand During
Replenishment
Interval
Safety Stock
To Cover
Deviation From Average
Average Demand During
Replenishment
Lead Time
Order Quantity:
How Much to Order
Order Point:
When to Order
All driven by the daily rate!
Page 46 www.synchronousmanagement.com
Reproduction or use of these materials, in whole or in part, is prohibited without the express written permission of
Synchronous Management of Milford, CT.
24. Subordinate Non-Constraints: Kanban
Pull Signal
80/DAY
Process
A
Capy=100/day
www.synchronousmanagement.Page 47 com
Logistical Pull Techniques (Ropes)
Kanban: Card which signals consumption has taken place
Order point: Replenish fixed quantity when inventory reaches this level
Min/max: Replenish to max when inventory reaches min
Two-bin: Fill one container while working out of the other
Reorder report: Triggers replenishment based on perpetual inventory records
Breadman: Refill depleted shelf inventory
Vendor managed: Outside supplier replenishes inventory
Trigger board: Accumulates kanbans at supplier
Virtual kanban: Electronic version of trigger boards
FIFO lane: Visual control of first-in-first-out at secondary operations
Heijunka box: Visual load-leveling technique
Mixed-model: Smoothing of production volume & mix
Kanban post: Accumulates kanbans in the order received
Reproduction or use of these materials, in whole or in part, is prohibited without the express written permission of
Synchronous Management of Milford, CT.
Supplier
Capy=150/day
Process
C
Capy=120/day
Customer
Process
B
Capy=80/day
First-In-First-Out
DEMAND =
90/DAY
Pull Signal
80/DAY
No one goes faster than the slowest step in the system (constraint).
Page 48 www.synchronousmanagement.com
25. Pull Systems (DBR) Account For. . .
Demand constraints
Demand rates and variability
Competitive lead times and service levels
Supply constraints
Supplier lead times and reliability
Resource uptimes, changeover times and cycle times
Quality yield rates and startup scrap
Material logistics, containers, storage
www.synchronousmanagement.Page 49 com
How LEAN Addresses Cause/Effect
SHORTAGES
PROCESS
DEPENDENCE
PROCESS
VARIATION
LARGE
BATCHES
WANDERING
BOTTLE-NECKS
HIGH
UTILIZATION
INACCURATE
FORECASTS
EXCESS
WORK IN
PROCESS
EXCESS
FINISHED
GOODS
LONG
PRODUCTION
LEADTIMES
EXCESS
COMPONENT
PARTS
INVENTORY
FINISH
TO
ORDER
SHORT
CUSTOMER
LEADTIMES
Page 50 www.synchronousmanagement.com
Reproduction or use of these materials, in whole or in part, is prohibited without the express written permission of
Synchronous Management of Milford, CT.
LONG
SETUPS
INFLEXIBLE
RESOURCES
EFFICIENCY
EXCESS
CAPACITY
THRUPUT
OPERATING
EXPENSE
POOR
ONTIME
DELIVERY
INVENTORY
INVENTORY
THRUPUT
OVERTIME
OPERATING
EXPENSE
EXCESS
RAW
MATERIAL
EXPEDITING
TIMING
PROBLEMS
FABRICATE
TO
FORECAST
SMED
CELLS
SIX SIGMA
XTRAINING
LEAN METRICS PULL/KANBAN
26. A TOC/Lean Translator
TOC LEAN
Optimize system Lean value stream
T, I, OE Flow and waste
Identify constraint Level-loading and EPEI
Exploit constraint Supermarkets, 5-S
Subordinate to constraint Kanban
Elevate constraint TPM, SMED, OEE, 6SIGMA
Repeat – avoid inertia Lean metrics
What to change? Current state VSM
To what to change? Future state VSM
How to change? TPS AND Kaizen
Drum-buffer-rope Pull/Kanban
Effect-cause-effect 5-whys
www.synchronousmanagement.Page 51 com
Words of Caution
Theory of constraints:
• A system is the total business, taken as a whole. The level at which
financial owner ship exists.
Lean manufacturing:
• A value stream is all of the activities required to bring a product from
raw material suppliers to the customer.
Value stream waste is not reduced unless
total system spending decreases!
Page 52 www.synchronousmanagement.com
Reproduction or use of these materials, in whole or in part, is prohibited without the express written permission of
Synchronous Management of Milford, CT.
27. Continuous Improvement: Cost Accounting?
EFFICIENCIES
Amortize changeover costs
Encourages large batches
HIGH UTILIZATION
Over-activates non-bottleneck resources
Builds inventory ahead of constraints
OVERHEAD ALLOCATION
Assumes all costs are variable
Ignores fixed cost
OVERHEAD ABSORPTION
Encourages inventory build
Ignores impact of fixed costs
EARNED HOURS
Credit for partial completion
Encourages input – not output
www.synchronousmanagement.Page 53 com
Continuous Improvement: Throughput Accounting?
•Sales dollars per person
•On-time shipments to customer
•Dock-to-dock lead time
•First pass yield
•Target cost performance
•Average cost per unit shipped
•OEE at bottlenecks
•Average cross-training per person
Page 54 www.synchronousmanagement.com
Reproduction or use of these materials, in whole or in part, is prohibited without the express written permission of
Synchronous Management of Milford, CT.
28. Why Marry TOC with Lean?
• Global business strategy
• Sync value streams with each other
• Quantify constraints to better flow/less waste
• Springboard to continuous improvement
• Evolve the TOC/lean mindset - not cost reduction
• Crush the competition!
www.synchronousmanagement.Page 55 com
Reproduction or use of these materials, in whole or in part, is prohibited without the express written permission of
Synchronous Management of Milford, CT.