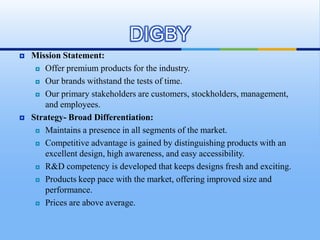
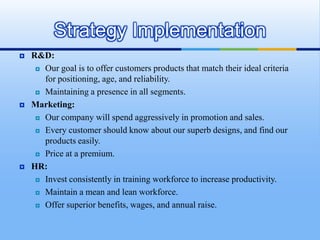
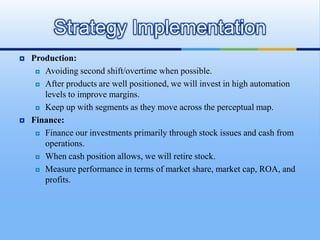
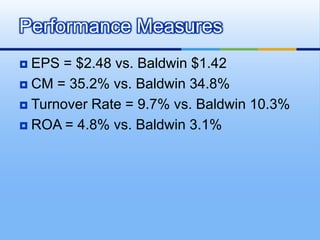
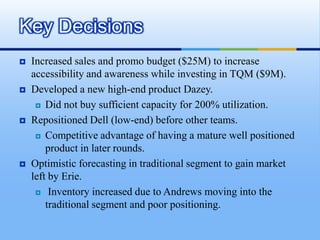
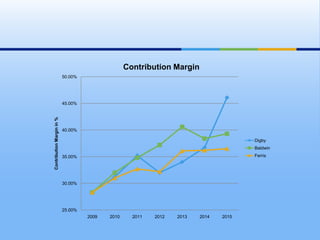
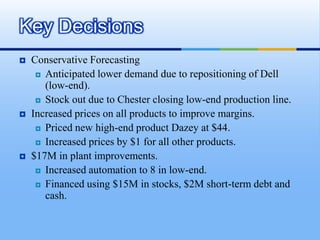
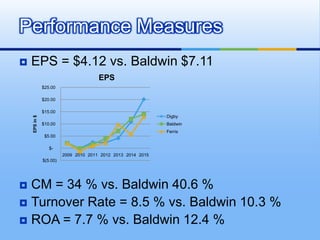
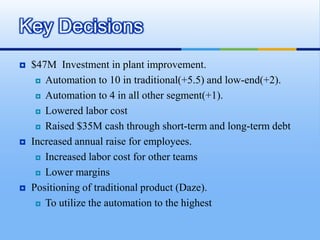
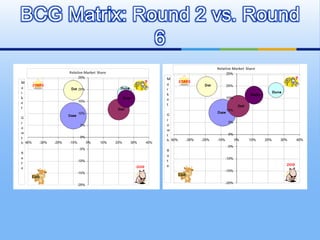
Digby
Shareholder’s Meeting: 2009 - 2015


     MGT 667 – Strategic Management
            Dr. Vinay Garg


           Bandar Al Mogesib
             Srinivas Damera
          Srinath Jayarama Raju
                Ihab Judeh
              Finy Mathew
DIGBY
   Mission Statement:
      Offer premium products for the industry.

      Our brands withstand the tests of time.

      Our primary stakeholders are customers, stockholders, management,

       and employees.
   Strategy- Broad Differentiation:
      Maintains a presence in all segments of the market.

      Competitive advantage is gained by distinguishing products with an

       excellent design, high awareness, and easy accessibility.
      R&D competency is developed that keeps designs fresh and exciting.

      Products keep pace with the market, offering improved size and

       performance.
      Prices are above average.
Strategy Implementation
   R&D:
      Our goal is to offer customers products that match their ideal criteria

       for positioning, age, and reliability.
      Maintaining a presence in all segments.

   Marketing:
      Our company will spend aggressively in promotion and sales.

      Every customer should know about our superb designs, and find our

       products easily.
      Price at a premium.

   HR:
      Invest consistently in training workforce to increase productivity.

      Maintain a mean and lean workforce.

      Offer superior benefits, wages, and annual raise.
Strategy Implementation
   Production:
      Avoiding second shift/overtime when possible.

      After products are well positioned, we will invest in high automation

       levels to improve margins.
      Keep up with segments as they move across the perceptual map.

   Finance:
      Finance our investments primarily through stock issues and cash from

       operations.
      When cash position allows, we will retire stock.

      Measure performance in terms of market share, market cap, ROA, and

       profits.
Round 1
CEO: Ihab Judeh
Key Decisions
   R&D to improve our product.
      Reposition High, Size and Performance to leading edge.

      Repositioned Traditional to center of the segment.

   TQM investment in Process Management
      Concurrent Engineering – reduced R&D cycle time by

       27%.
      Lowered material and labor cost.

   $6.5M in plant improvement.
      Increased automation on traditional and low-end which was

       financed by short-term debt.
Performance Measures
 EPS = $(0.06) vs. Baldwin $(0.07)
 CM = 31.2% vs. Baldwin 31.9%
 Turnover Rate = 10.4% vs. Baldwin 9.3%
 ROA = -0.1% vs. Baldwin -0.1%
Round 2
CEO: Srinath Raju
Key Decisions
   Investment in TQM ($10.5M):
      3.61% increase in demand vs. 1.30% for Ferris

      13% decrease in material and labor cost

   Lowered the price in every segment.
      Decrease in contribution margins

      Improved customer survey scores

   Labor negotiation
      Increased wages, benefits, profit sharing, and annual raise

      Increased labor cost and lowered margins for next round.
BCG Matrix: End of Round 2
Performance Measures
 EPS = $2.48 vs. Baldwin $1.42
 CM = 35.2% vs. Baldwin 34.8%

 Turnover Rate = 9.7% vs. Baldwin 10.3%

 ROA = 4.8% vs. Baldwin 3.1%
Round 3
CEO: Bandar Al Mogesib
Key Decisions
   Increased sales and promo budget ($25M) to increase
    accessibility and awareness while investing in TQM ($9M).
   Developed a new high-end product Dazey.
      Did not buy sufficient capacity for 200% utilization.

   Repositioned Dell (low-end) before other teams.
      Competitive advantage of having a mature well positioned

        product in later rounds.
   Optimistic forecasting in traditional segment to gain market
    left by Erie.
      Inventory increased due to Andrews moving into the
        traditional segment and poor positioning.
Contribution Margin
                           50.00%


                           45.00%
Contribution Margin in %


                           40.00%

                                                                                       Digby
                                                                                       Baldwin
                           35.00%                                                      Ferris


                           30.00%


                           25.00%
                                    2009   2010     2011   2012   2013   2014   2015
Round 4
CEO: Srinivas Damera
Key Decisions
   Conservative Forecasting
      Anticipated lower demand due to repositioning of Dell
       (low-end).
      Stock out due to Chester closing low-end production line.

   Increased prices on all products to improve margins.
      Priced new high-end product Dazey at $44.

      Increased prices by $1 for all other products.

   $17M in plant improvements.
      Increased automation to 8 in low-end.

      Financed using $15M in stocks, $2M short-term debt and
       cash.
Performance Measures
   EPS = $4.12 vs. Baldwin $7.11
                                       EPS
               $25.00

               $20.00

               $15.00
                                                              Digby
    EPS in $


               $10.00                                         Baldwin
                                                              Ferris
                $5.00

                  $-
                         2009 2010 2011 2012 2013 2014 2015
               $(5.00)


 CM = 34 % vs. Baldwin 40.6 %
 Turnover Rate = 8.5 % vs. Baldwin 10.3 %
 ROA = 7.7 % vs. Baldwin 12.4 %
Round 5
CEO: Finy Mathew
Key Decisions
   $47M Investment in plant improvement.
      Automation to 10 in traditional(+5.5) and low-end(+2).

      Automation to 4 in all other segment(+1).

      Lowered labor cost

      Raised $35M cash through short-term and long-term debt

   Increased annual raise for employees.
      Increased labor cost for other teams

      Lower margins

   Positioning of traditional product (Daze).
      To utilize the automation to the highest
Round 6
CEO: Finy Mathew
Key Decisions
   Reduce prices in all segment, except Size segment to increase
    customer survey scores.
   Continued R&D to improve high-end, size and performance.
       Moved the products to leading edge for differentiation.
   Forecasting for full capacity and production at 198% plant
    utilization.
   Avoided interest payment by retirement of debt.
      Long term – $37M

      Short term – $20M

   Retired stocks – $10M
BCG Matrix: End of Round 6
BCG Matrix: Round 2 vs. Round
              6
Performance Measures
 EPS = $20.10 vs. Baldwin $13.99
 CM = 46.1% vs. Baldwin 39.3%
 Turnover Rate = 7.7% vs. Baldwin 10.5%
 ROA = 29.3% vs. Baldwin 19.1%
 Productivity = 107 % vs. Baldwin103 %
Digby 2016 and beyond…

 Buy more capacity to meet future
  demands.
 Reduce labor and material cost by TQM
  and increasing productivity.
 Allow traditional product to mature before
  repositioning.
 Reduce prices without sacrificing margins.

 Establish a dividend policy
       $113M in retained earnings.
Thank You….


          Questions?

Strategy Digby Mgt667 001

  • 1.
    Digby Shareholder’s Meeting: 2009- 2015 MGT 667 – Strategic Management Dr. Vinay Garg Bandar Al Mogesib Srinivas Damera Srinath Jayarama Raju Ihab Judeh Finy Mathew
  • 2.
    DIGBY  Mission Statement:  Offer premium products for the industry.  Our brands withstand the tests of time.  Our primary stakeholders are customers, stockholders, management, and employees.  Strategy- Broad Differentiation:  Maintains a presence in all segments of the market.  Competitive advantage is gained by distinguishing products with an excellent design, high awareness, and easy accessibility.  R&D competency is developed that keeps designs fresh and exciting.  Products keep pace with the market, offering improved size and performance.  Prices are above average.
  • 3.
    Strategy Implementation  R&D:  Our goal is to offer customers products that match their ideal criteria for positioning, age, and reliability.  Maintaining a presence in all segments.  Marketing:  Our company will spend aggressively in promotion and sales.  Every customer should know about our superb designs, and find our products easily.  Price at a premium.  HR:  Invest consistently in training workforce to increase productivity.  Maintain a mean and lean workforce.  Offer superior benefits, wages, and annual raise.
  • 4.
    Strategy Implementation  Production:  Avoiding second shift/overtime when possible.  After products are well positioned, we will invest in high automation levels to improve margins.  Keep up with segments as they move across the perceptual map.  Finance:  Finance our investments primarily through stock issues and cash from operations.  When cash position allows, we will retire stock.  Measure performance in terms of market share, market cap, ROA, and profits.
  • 5.
  • 6.
    Key Decisions  R&D to improve our product.  Reposition High, Size and Performance to leading edge.  Repositioned Traditional to center of the segment.  TQM investment in Process Management  Concurrent Engineering – reduced R&D cycle time by 27%.  Lowered material and labor cost.  $6.5M in plant improvement.  Increased automation on traditional and low-end which was financed by short-term debt.
  • 7.
    Performance Measures  EPS= $(0.06) vs. Baldwin $(0.07)  CM = 31.2% vs. Baldwin 31.9%  Turnover Rate = 10.4% vs. Baldwin 9.3%  ROA = -0.1% vs. Baldwin -0.1%
  • 8.
  • 9.
    Key Decisions  Investment in TQM ($10.5M):  3.61% increase in demand vs. 1.30% for Ferris  13% decrease in material and labor cost  Lowered the price in every segment.  Decrease in contribution margins  Improved customer survey scores  Labor negotiation  Increased wages, benefits, profit sharing, and annual raise  Increased labor cost and lowered margins for next round.
  • 10.
    BCG Matrix: Endof Round 2
  • 11.
    Performance Measures  EPS= $2.48 vs. Baldwin $1.42  CM = 35.2% vs. Baldwin 34.8%  Turnover Rate = 9.7% vs. Baldwin 10.3%  ROA = 4.8% vs. Baldwin 3.1%
  • 12.
  • 13.
    Key Decisions  Increased sales and promo budget ($25M) to increase accessibility and awareness while investing in TQM ($9M).  Developed a new high-end product Dazey.  Did not buy sufficient capacity for 200% utilization.  Repositioned Dell (low-end) before other teams.  Competitive advantage of having a mature well positioned product in later rounds.  Optimistic forecasting in traditional segment to gain market left by Erie.  Inventory increased due to Andrews moving into the traditional segment and poor positioning.
  • 14.
    Contribution Margin 50.00% 45.00% Contribution Margin in % 40.00% Digby Baldwin 35.00% Ferris 30.00% 25.00% 2009 2010 2011 2012 2013 2014 2015
  • 15.
  • 16.
    Key Decisions  Conservative Forecasting  Anticipated lower demand due to repositioning of Dell (low-end).  Stock out due to Chester closing low-end production line.  Increased prices on all products to improve margins.  Priced new high-end product Dazey at $44.  Increased prices by $1 for all other products.  $17M in plant improvements.  Increased automation to 8 in low-end.  Financed using $15M in stocks, $2M short-term debt and cash.
  • 17.
    Performance Measures  EPS = $4.12 vs. Baldwin $7.11 EPS $25.00 $20.00 $15.00 Digby EPS in $ $10.00 Baldwin Ferris $5.00 $- 2009 2010 2011 2012 2013 2014 2015 $(5.00)  CM = 34 % vs. Baldwin 40.6 %  Turnover Rate = 8.5 % vs. Baldwin 10.3 %  ROA = 7.7 % vs. Baldwin 12.4 %
  • 18.
  • 19.
    Key Decisions  $47M Investment in plant improvement.  Automation to 10 in traditional(+5.5) and low-end(+2).  Automation to 4 in all other segment(+1).  Lowered labor cost  Raised $35M cash through short-term and long-term debt  Increased annual raise for employees.  Increased labor cost for other teams  Lower margins  Positioning of traditional product (Daze).  To utilize the automation to the highest
  • 20.
  • 21.
    Key Decisions  Reduce prices in all segment, except Size segment to increase customer survey scores.  Continued R&D to improve high-end, size and performance.  Moved the products to leading edge for differentiation.  Forecasting for full capacity and production at 198% plant utilization.  Avoided interest payment by retirement of debt.  Long term – $37M  Short term – $20M  Retired stocks – $10M
  • 22.
    BCG Matrix: Endof Round 6
  • 23.
    BCG Matrix: Round2 vs. Round 6
  • 24.
    Performance Measures  EPS= $20.10 vs. Baldwin $13.99  CM = 46.1% vs. Baldwin 39.3%  Turnover Rate = 7.7% vs. Baldwin 10.5%  ROA = 29.3% vs. Baldwin 19.1%  Productivity = 107 % vs. Baldwin103 %
  • 25.
    Digby 2016 andbeyond…  Buy more capacity to meet future demands.  Reduce labor and material cost by TQM and increasing productivity.  Allow traditional product to mature before repositioning.  Reduce prices without sacrificing margins.  Establish a dividend policy  $113M in retained earnings.
  • 26.
    Thank You…. Questions?