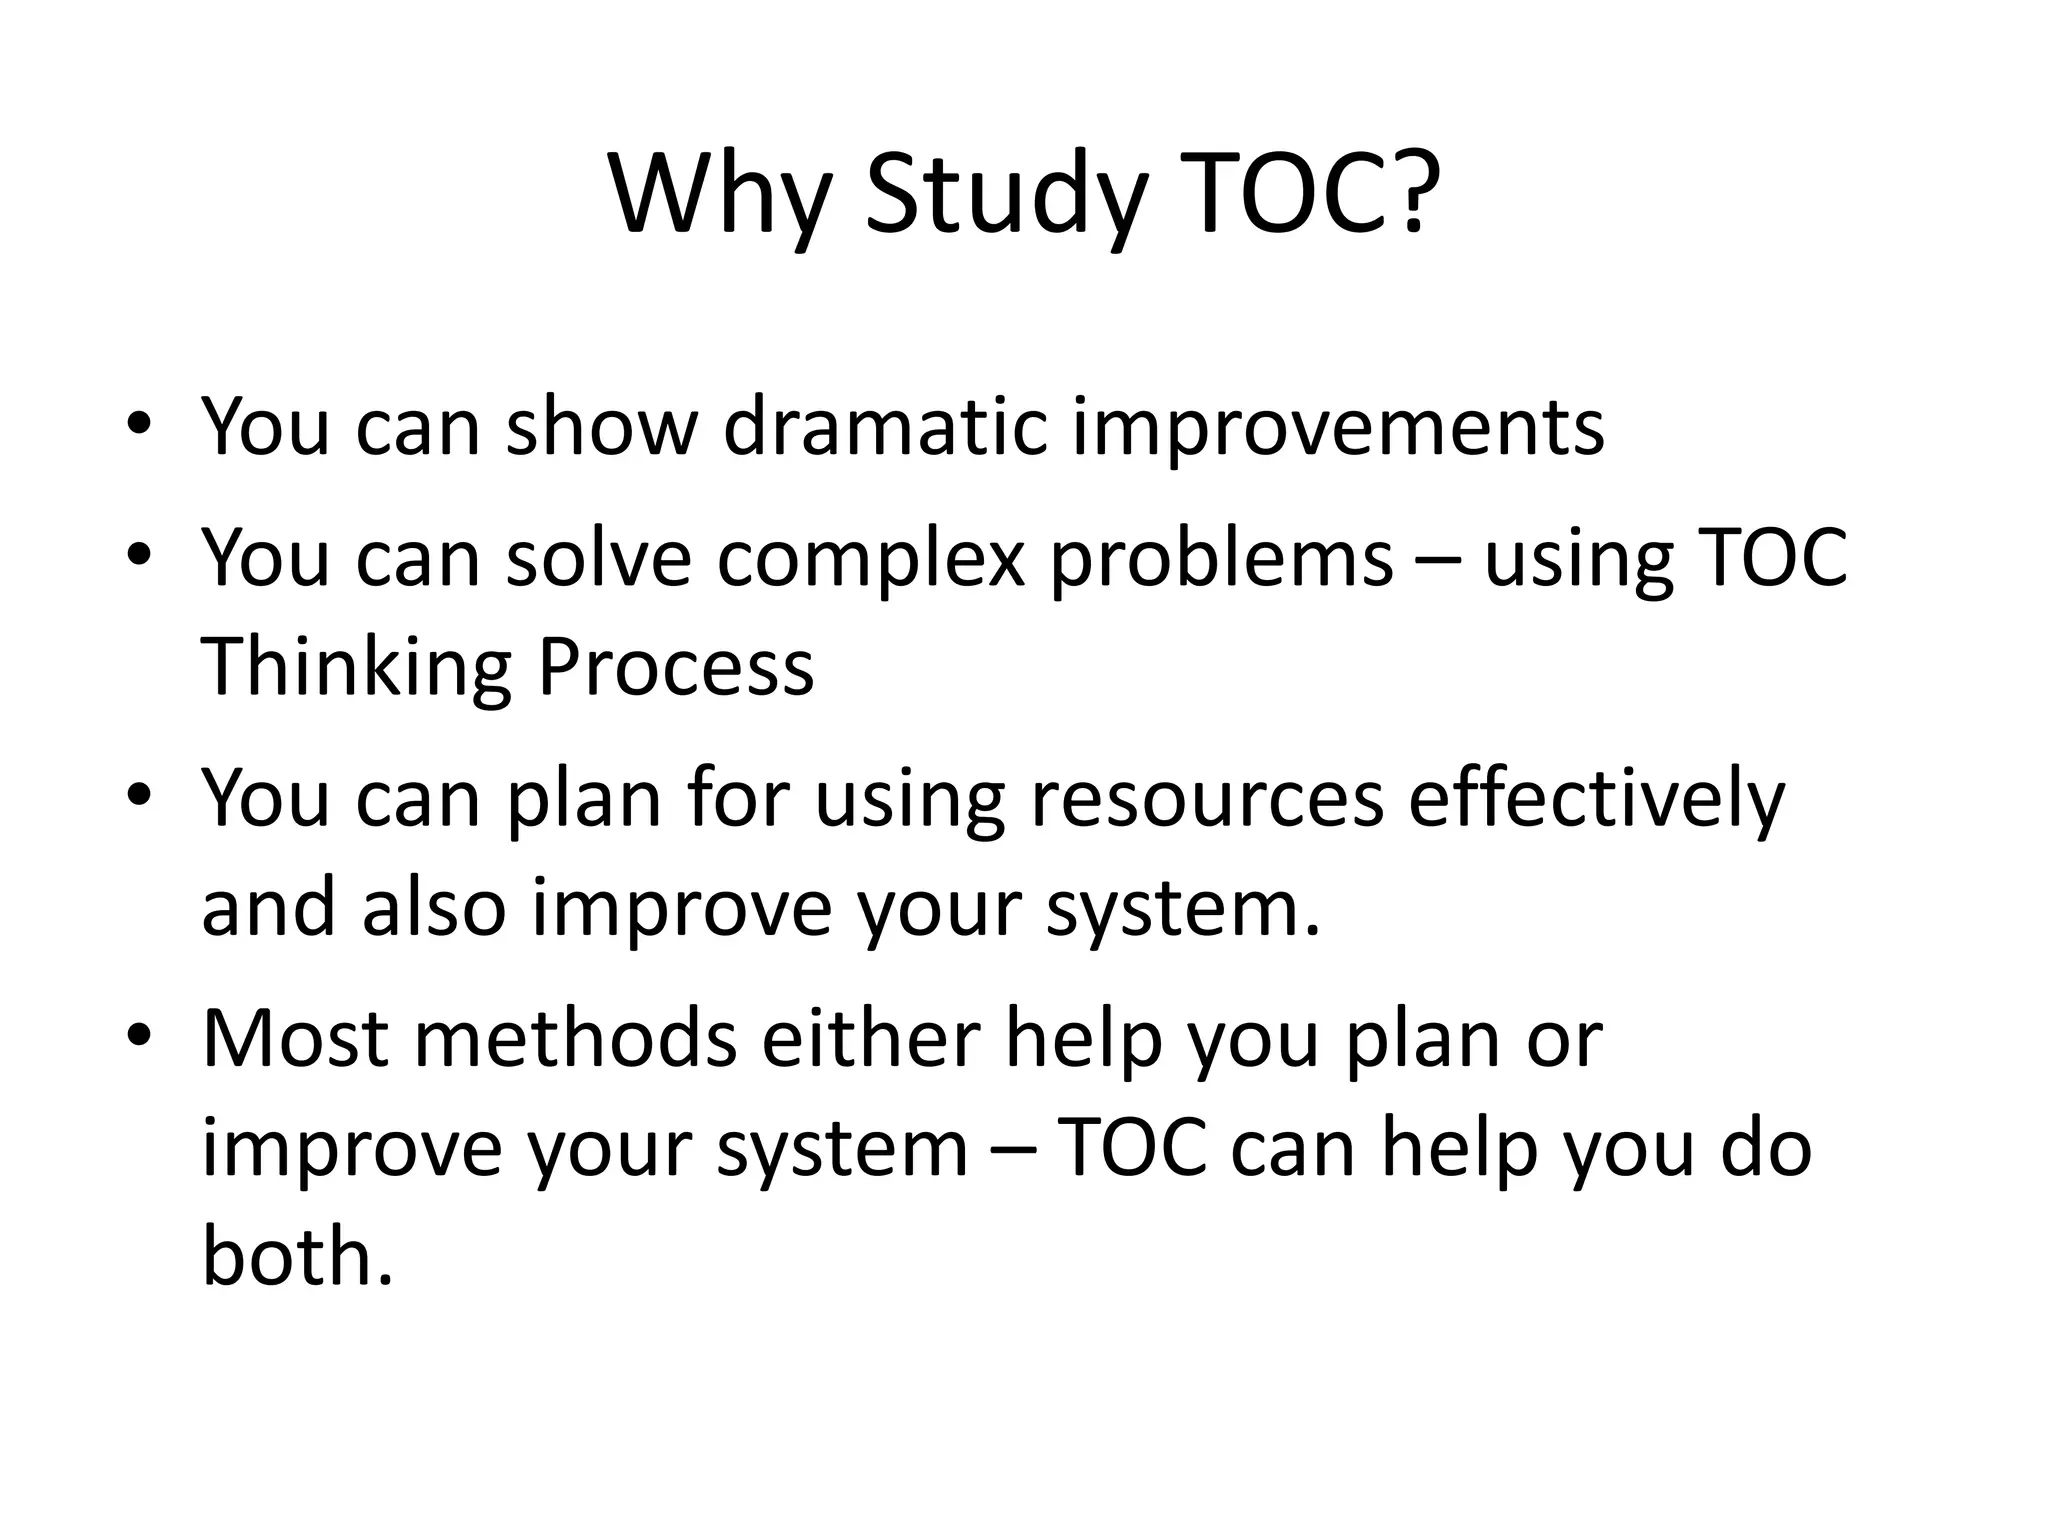
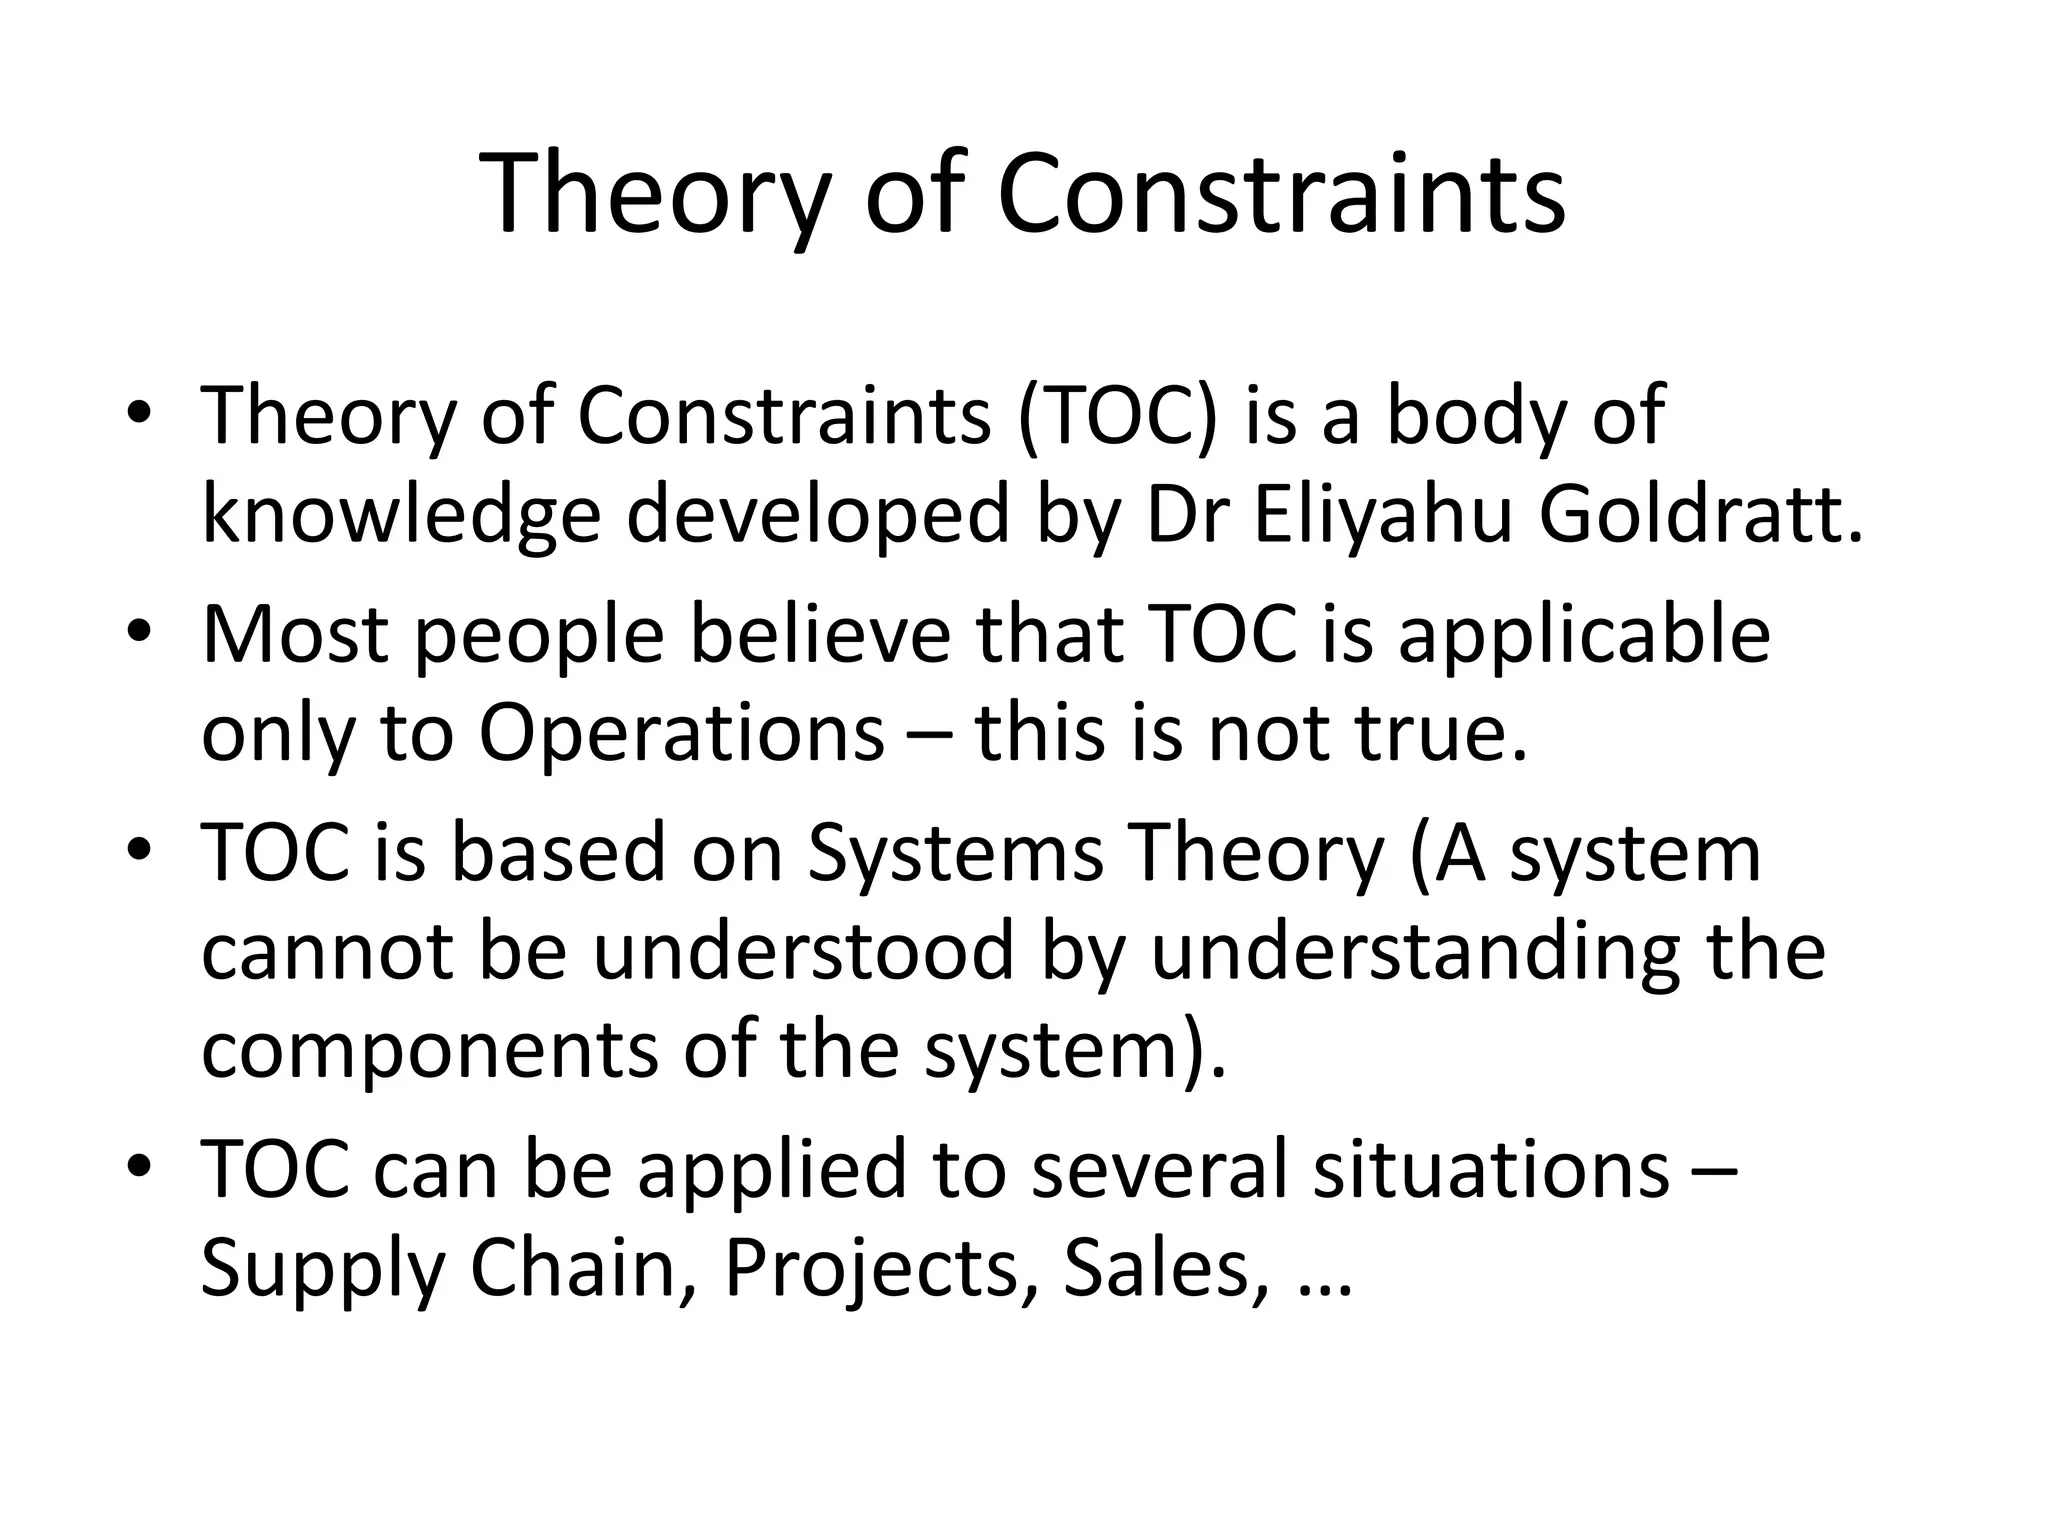
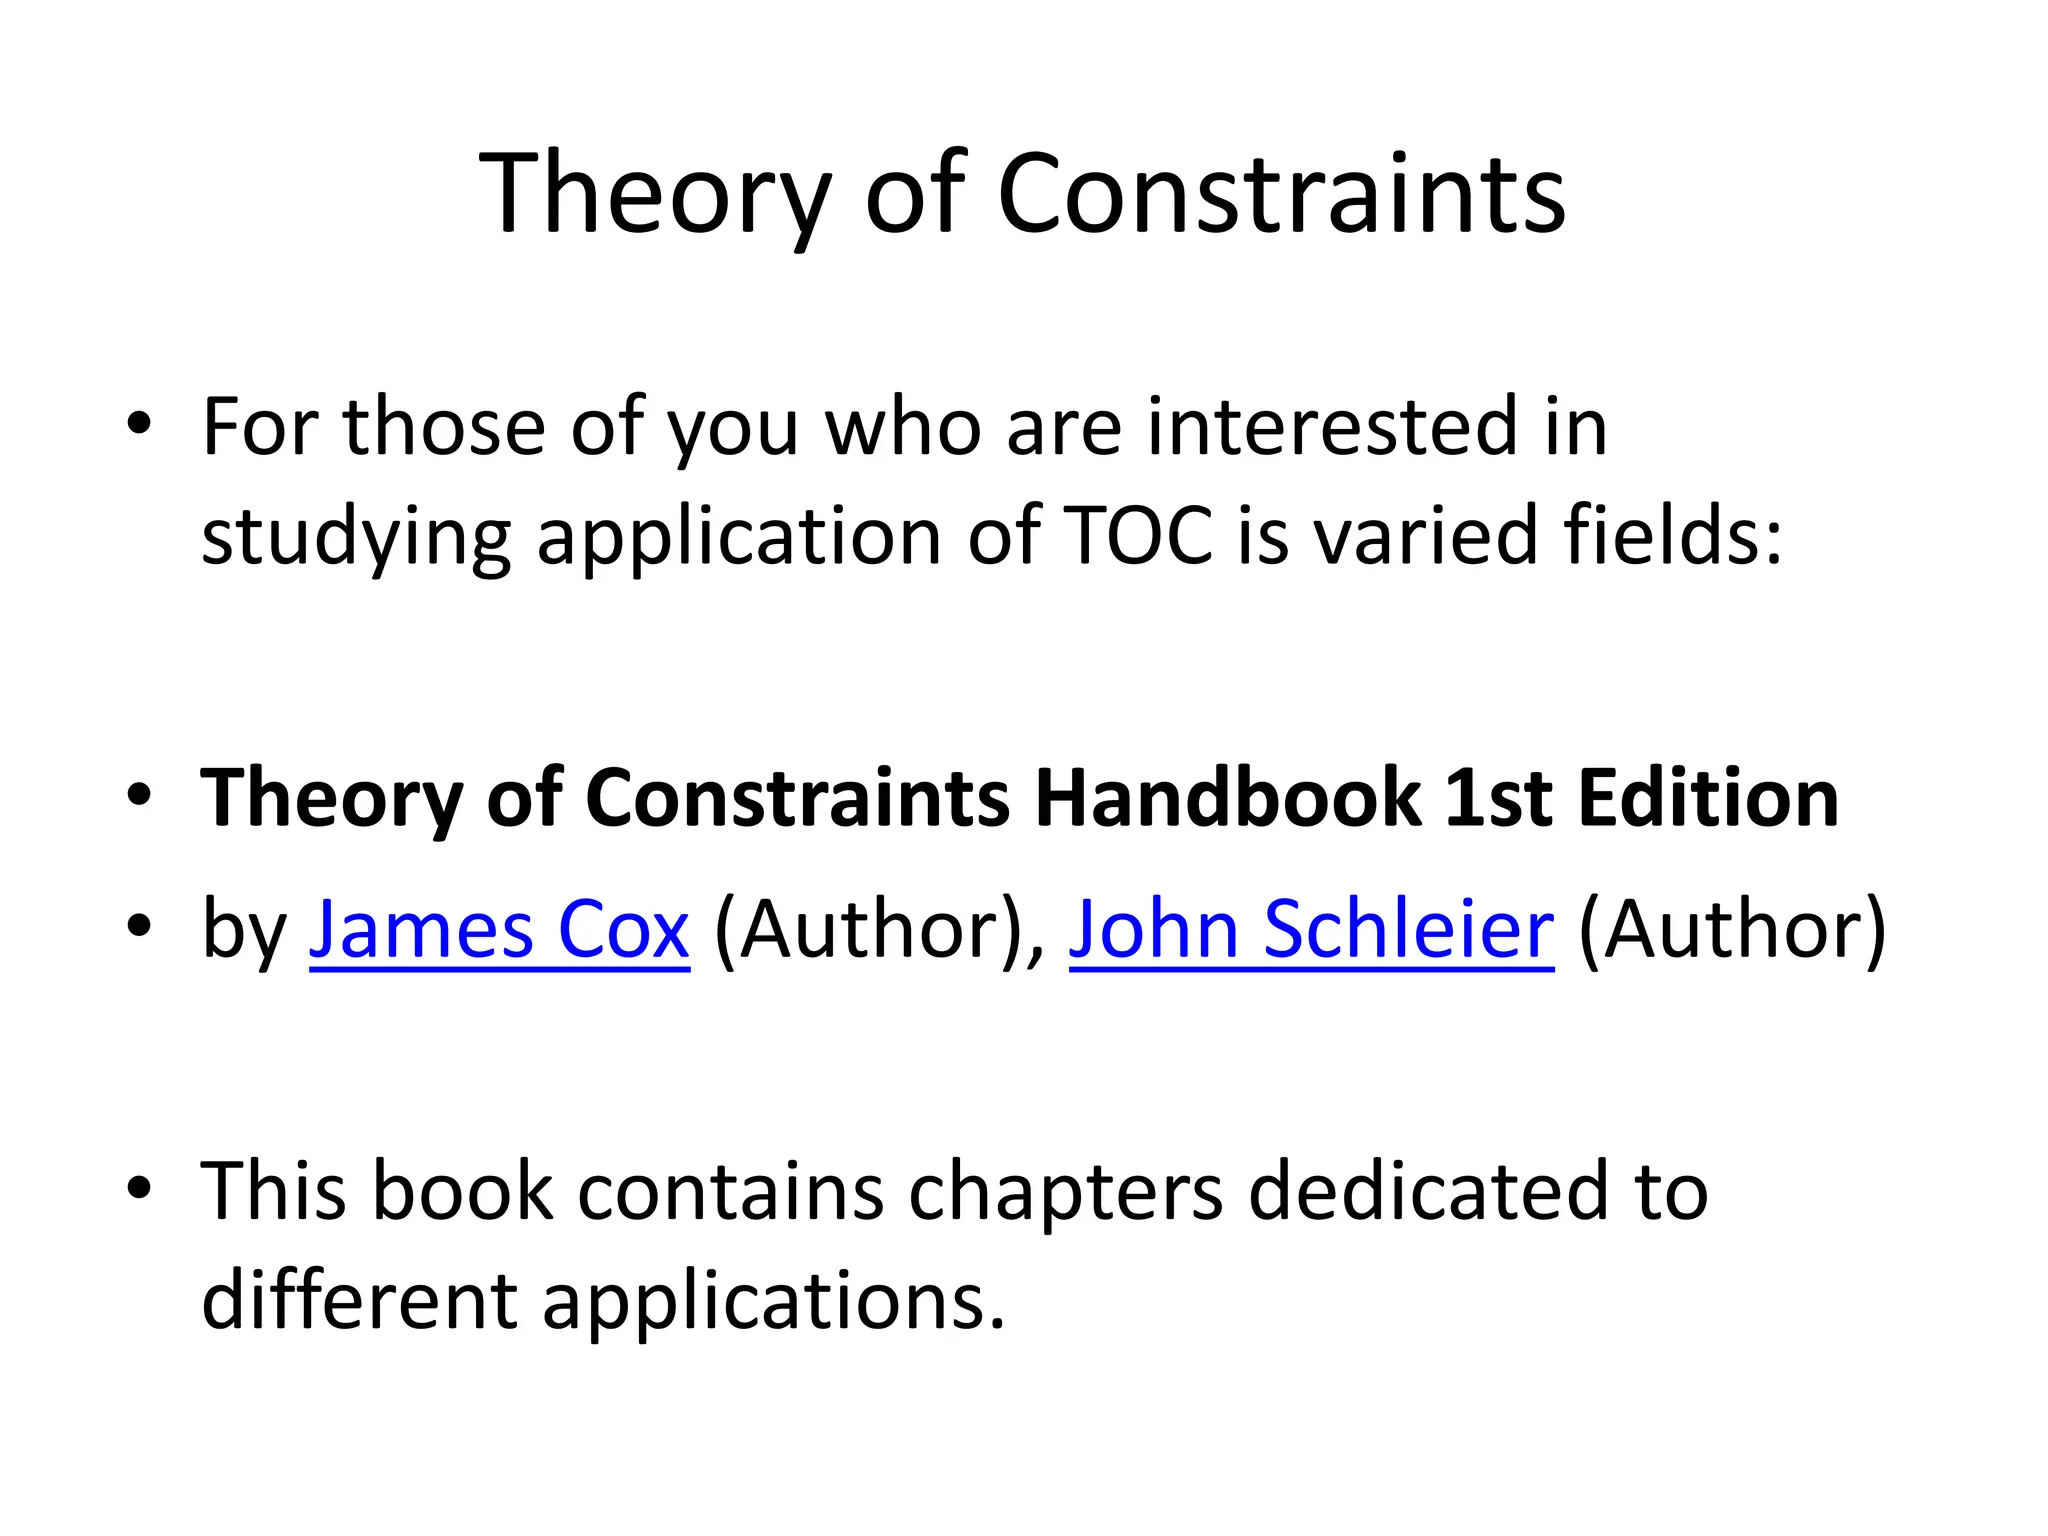
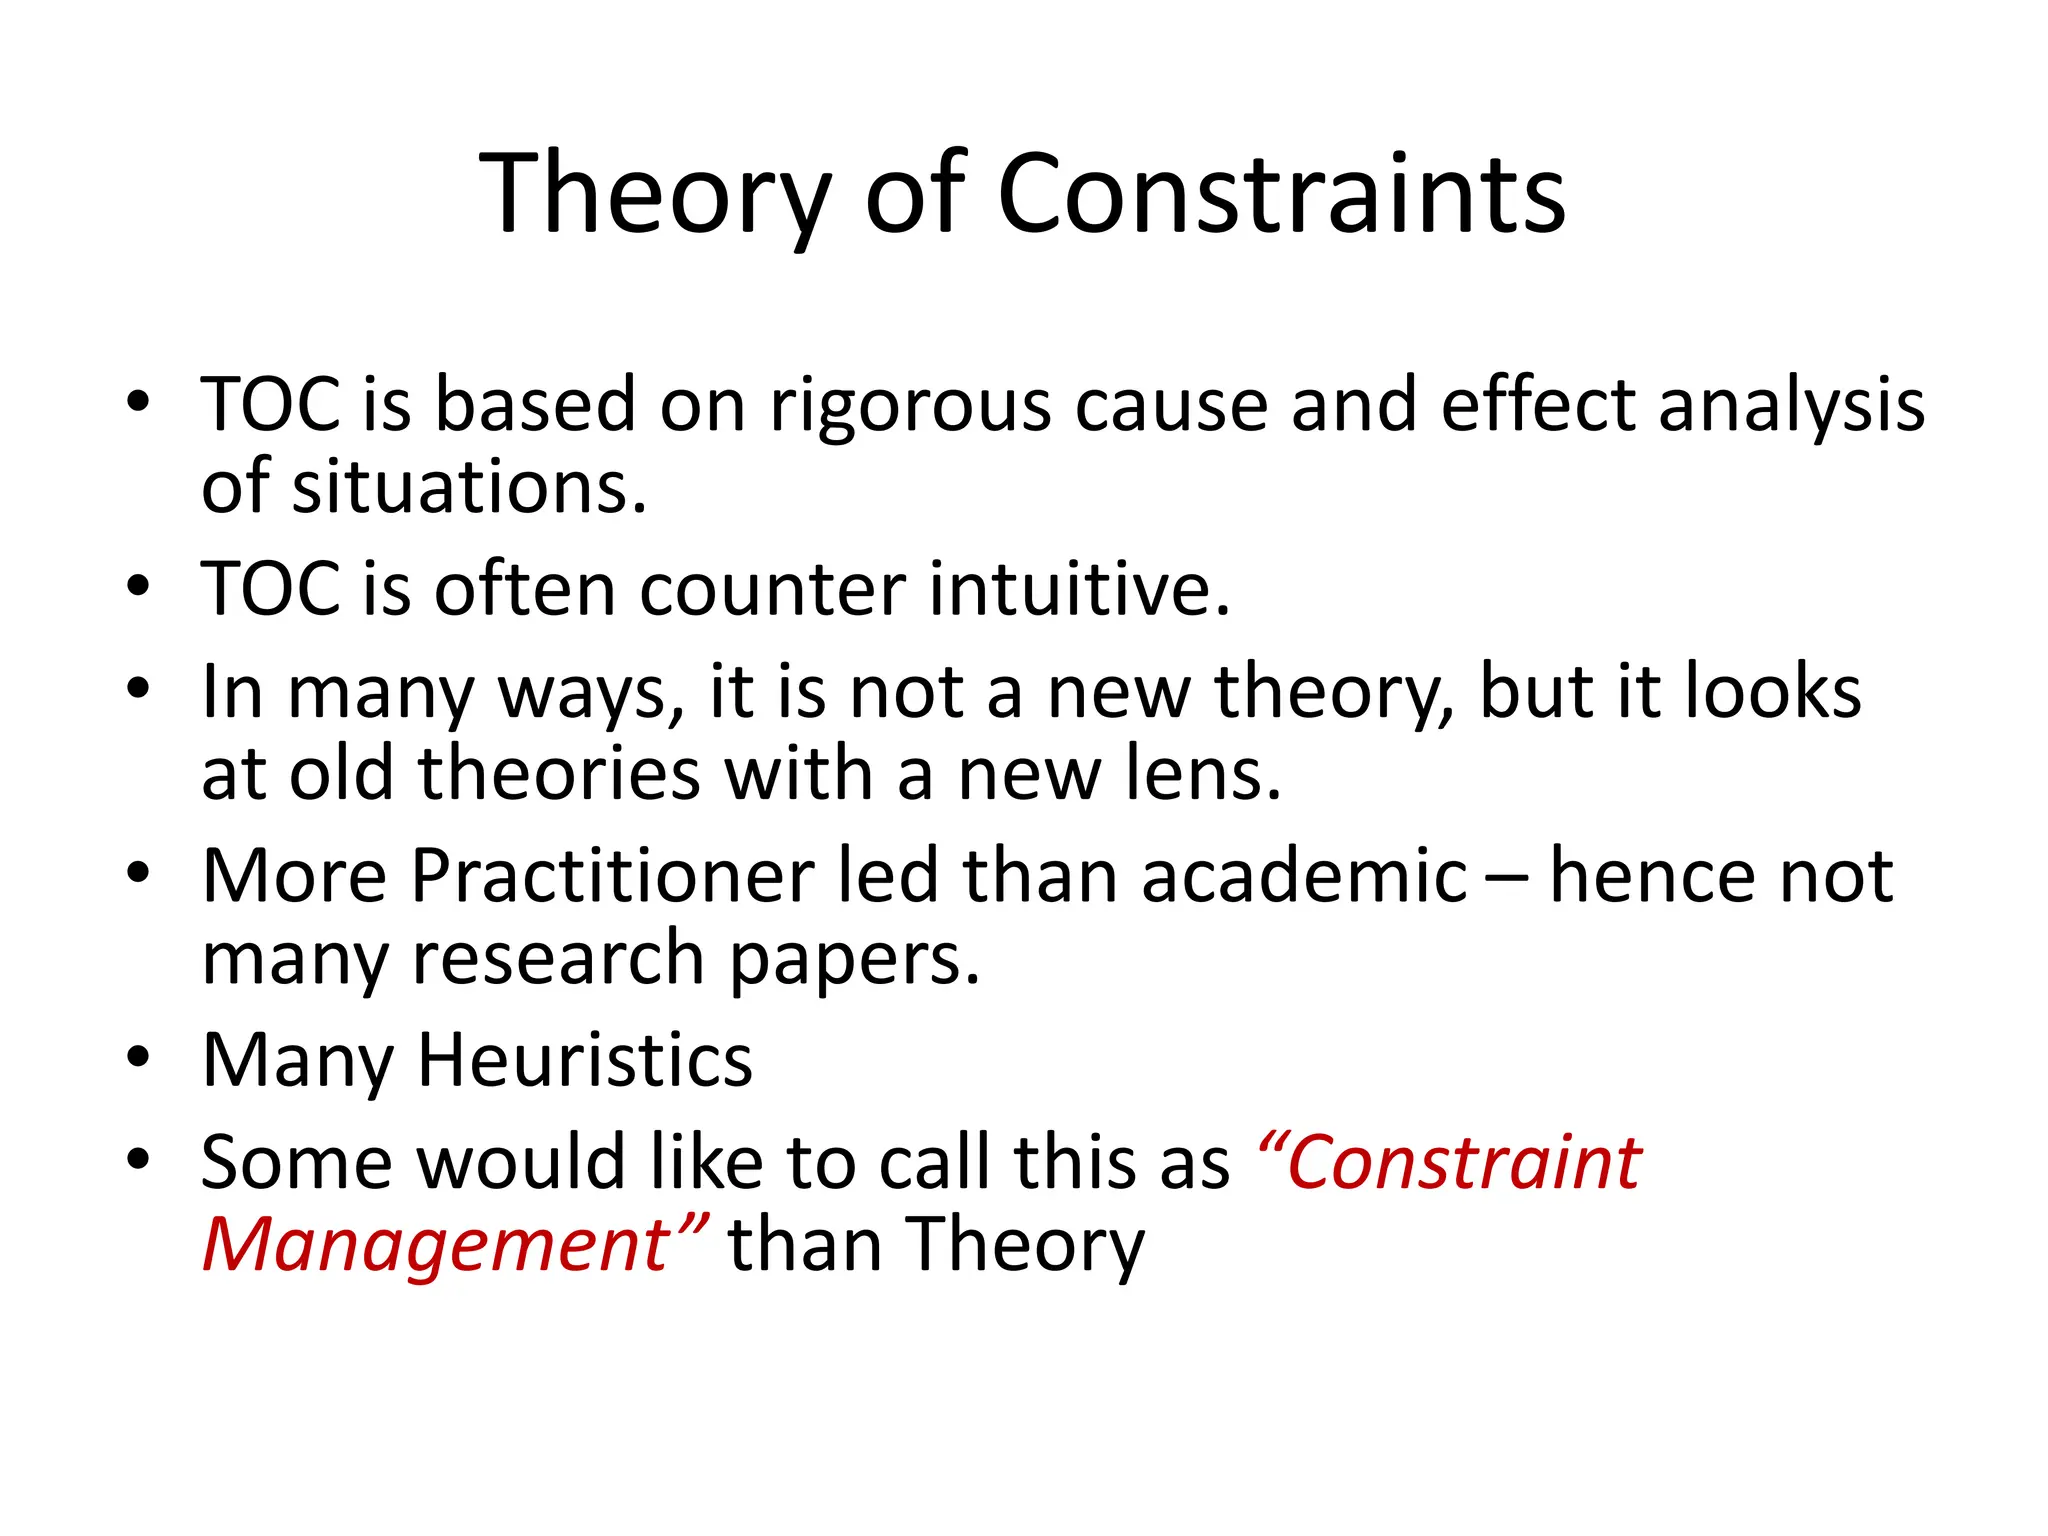
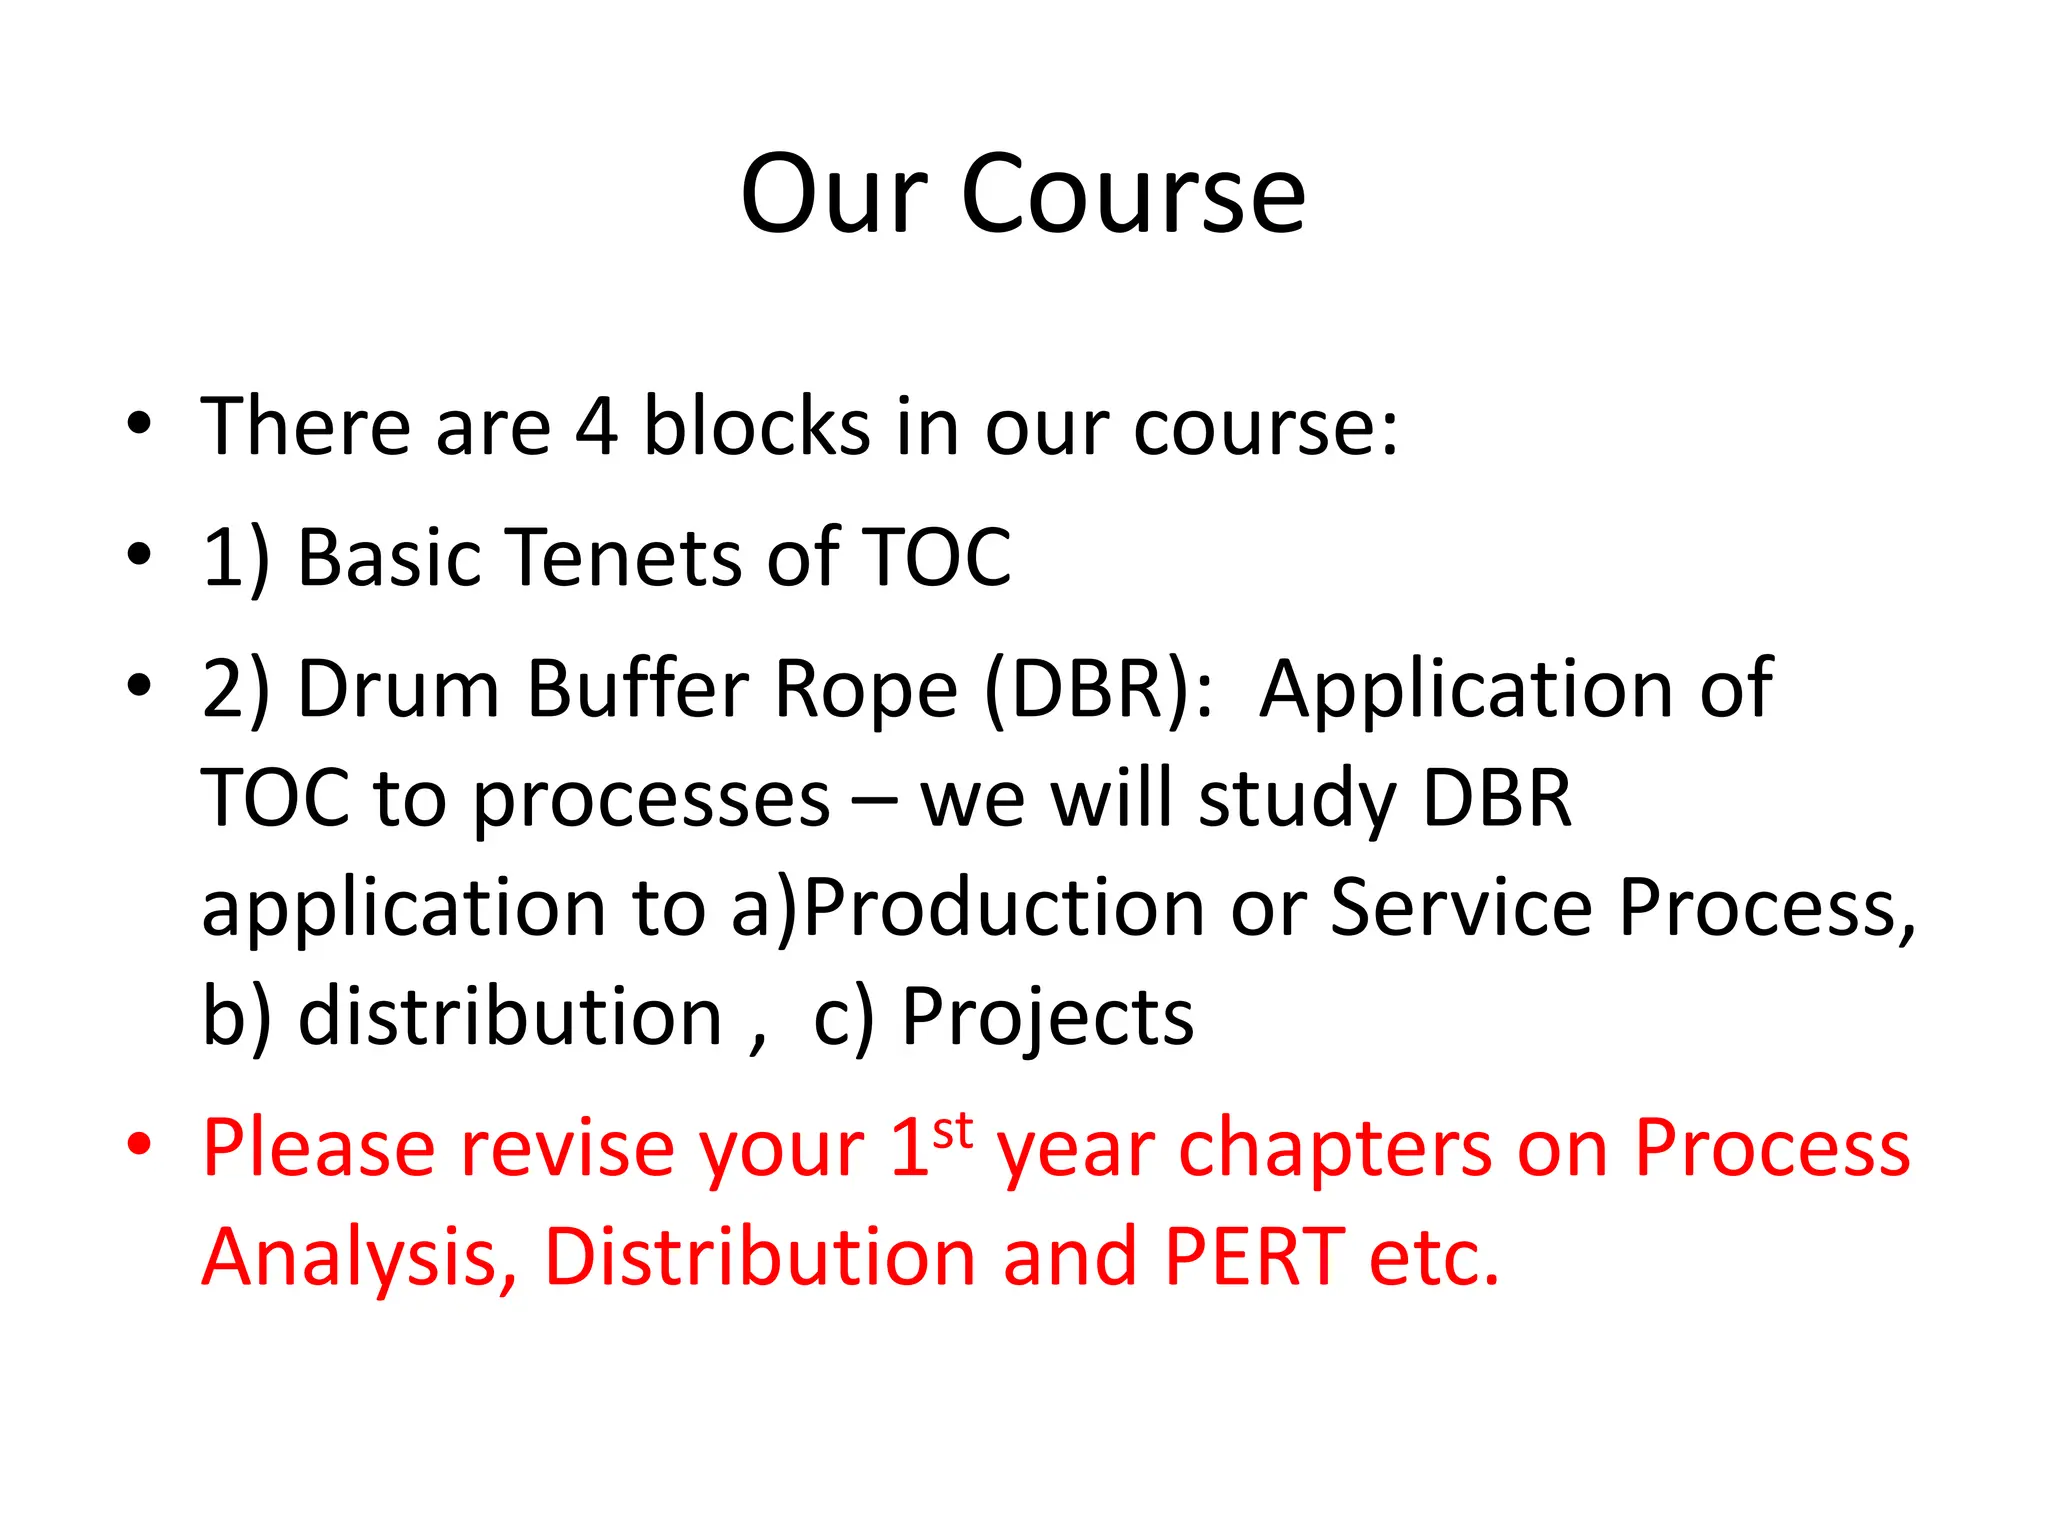
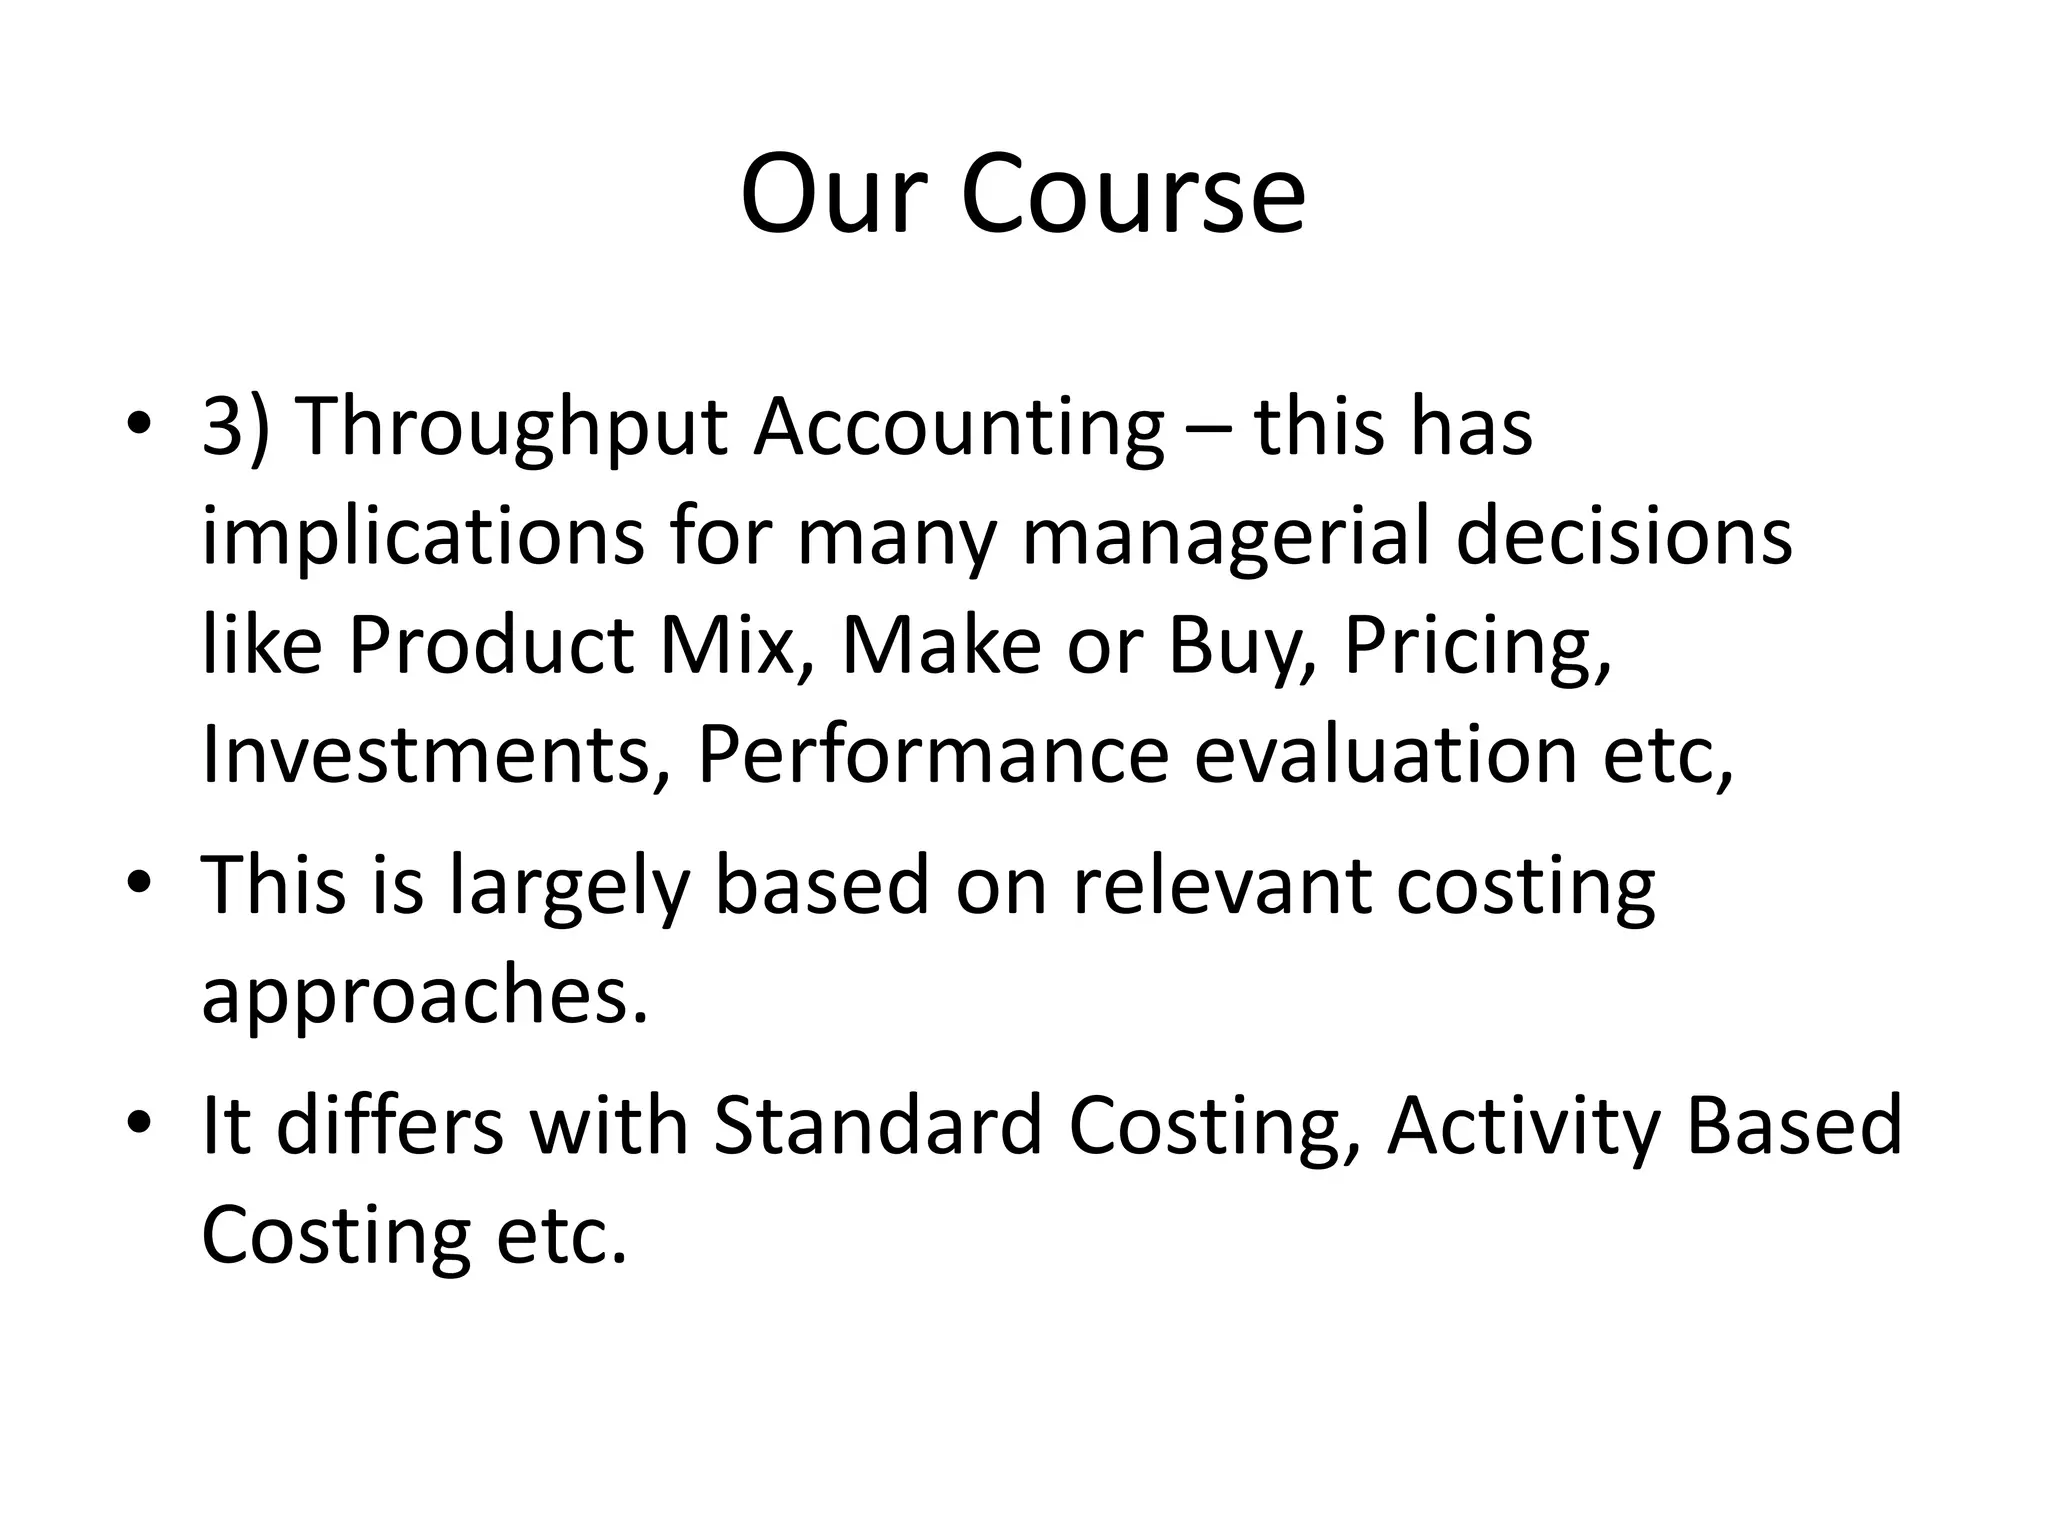
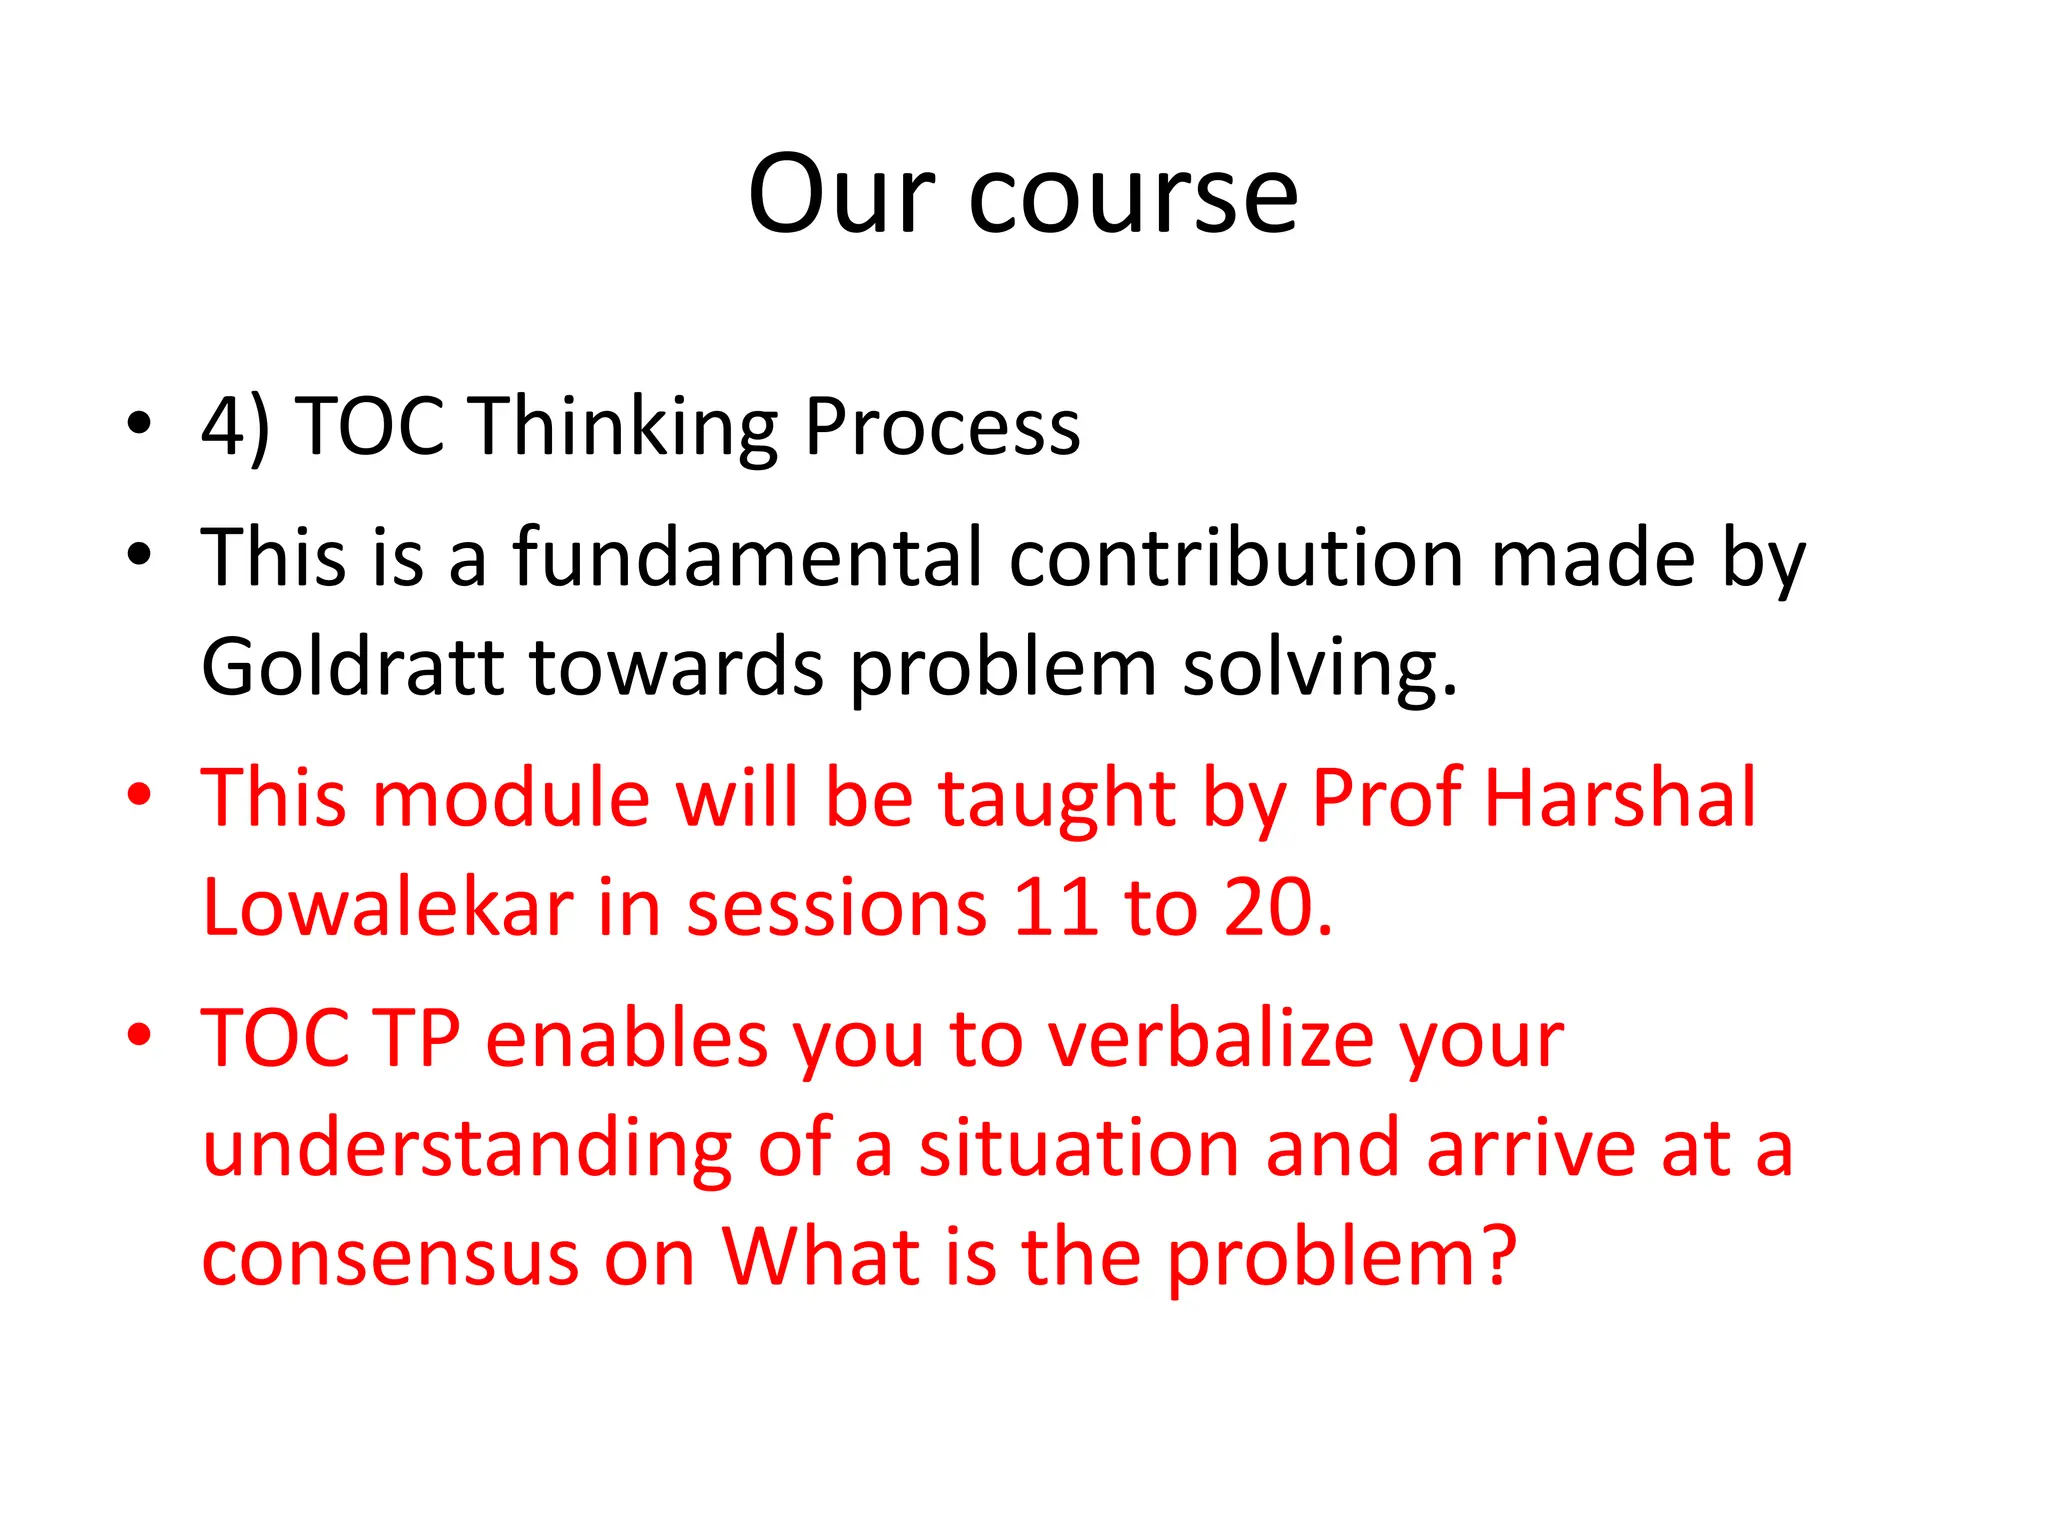
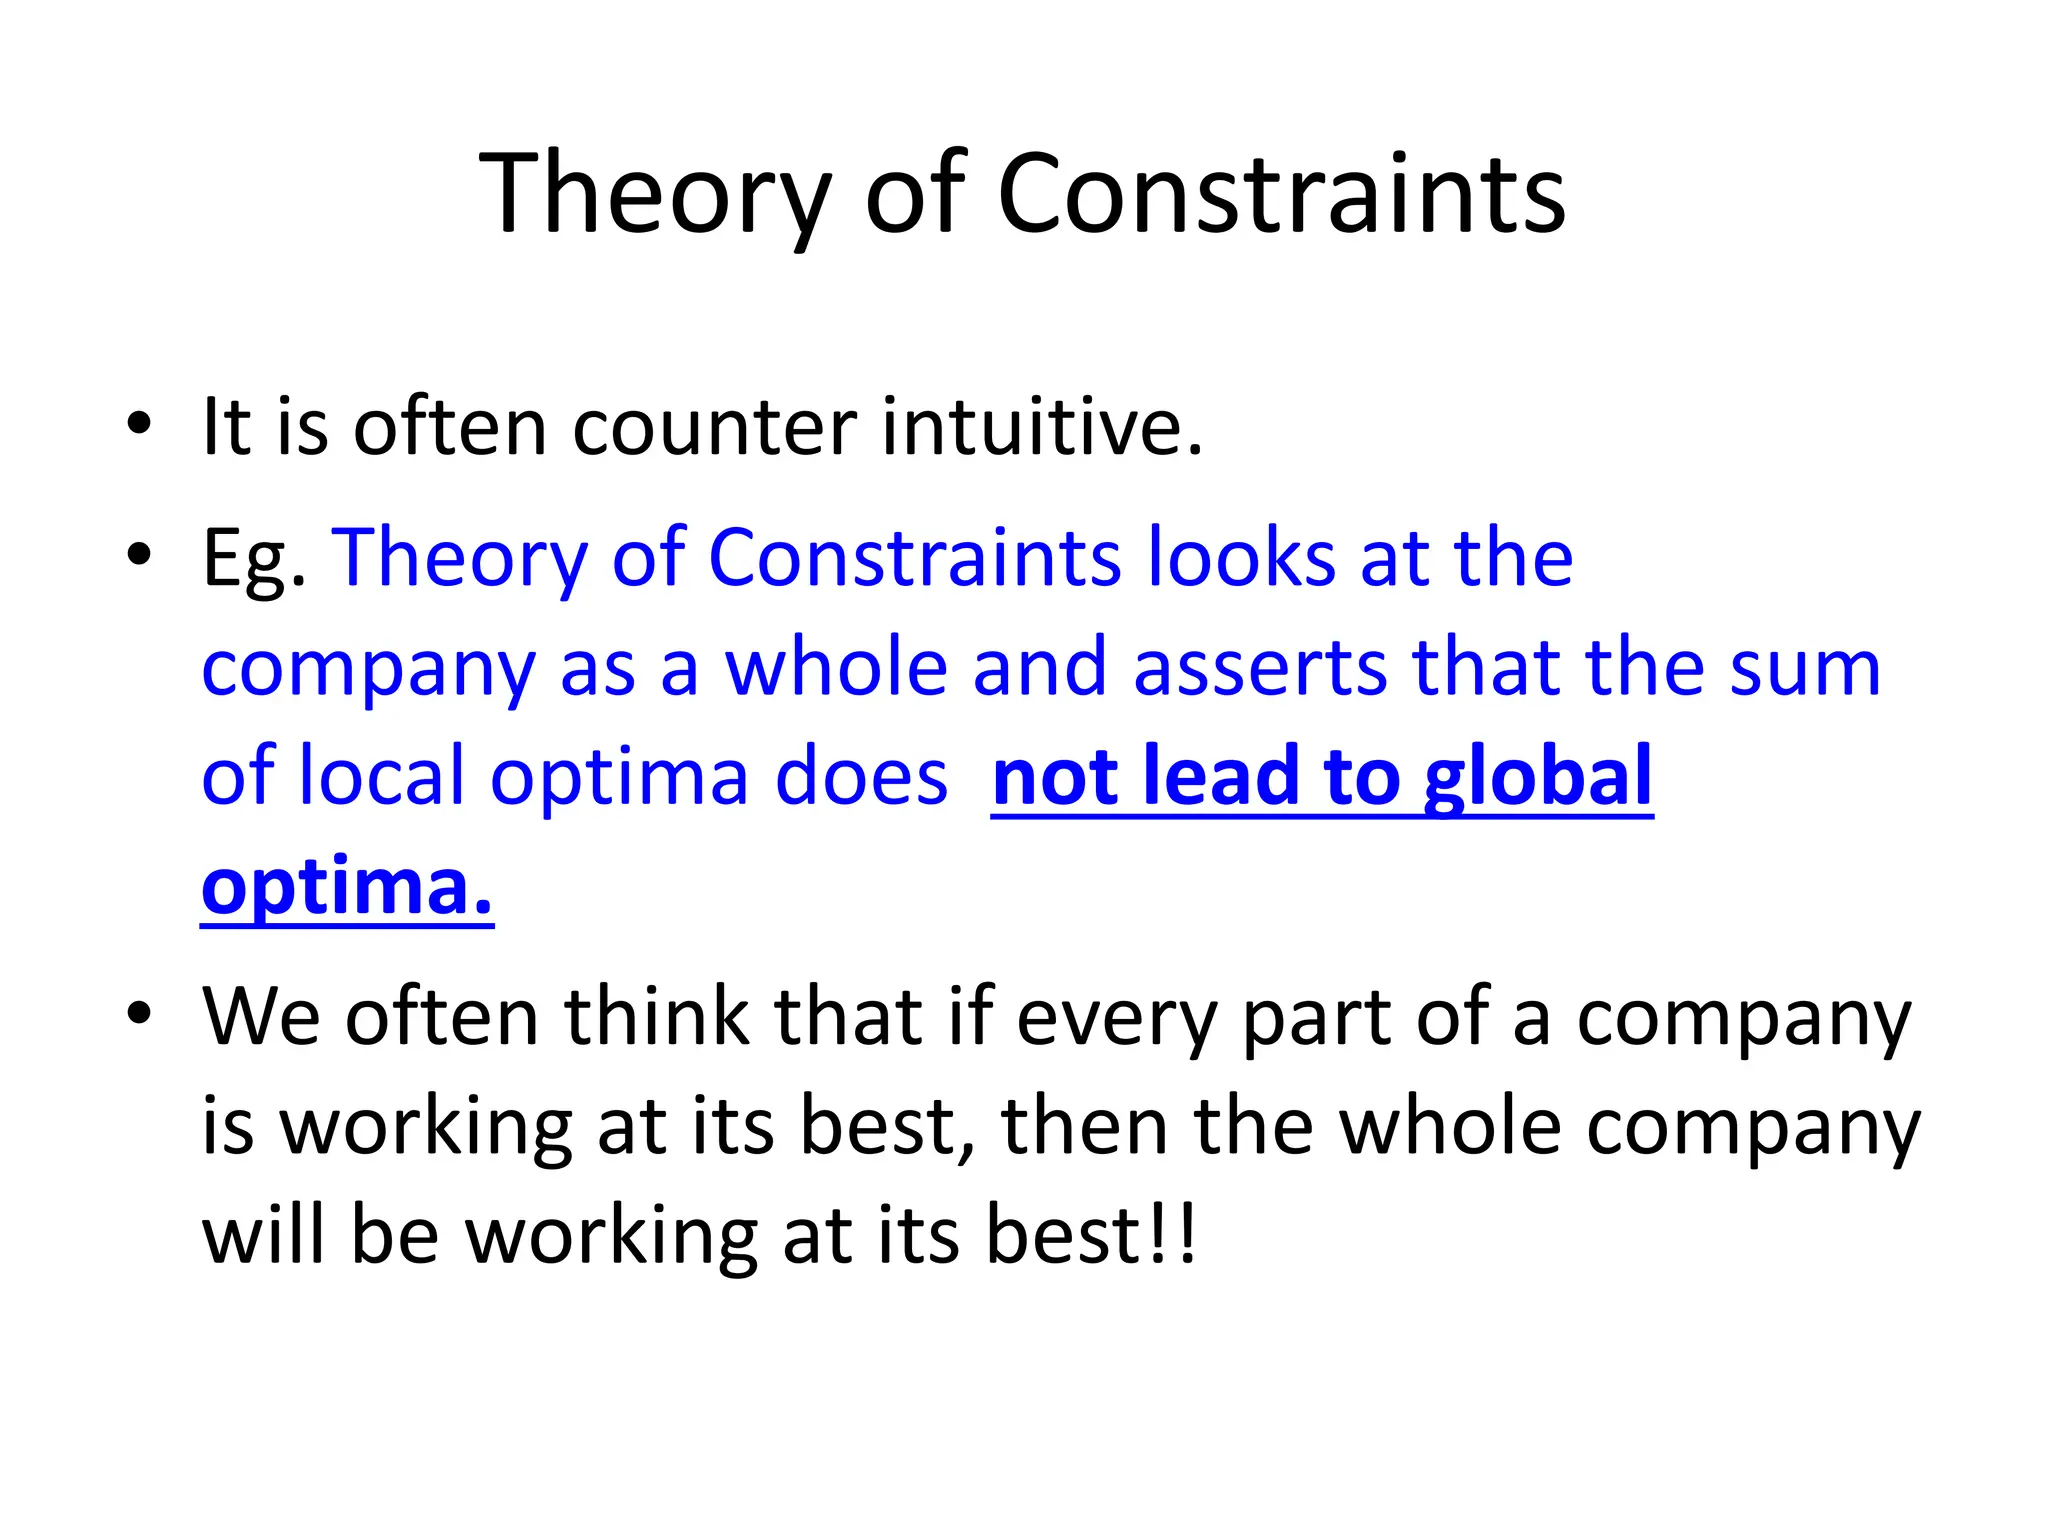
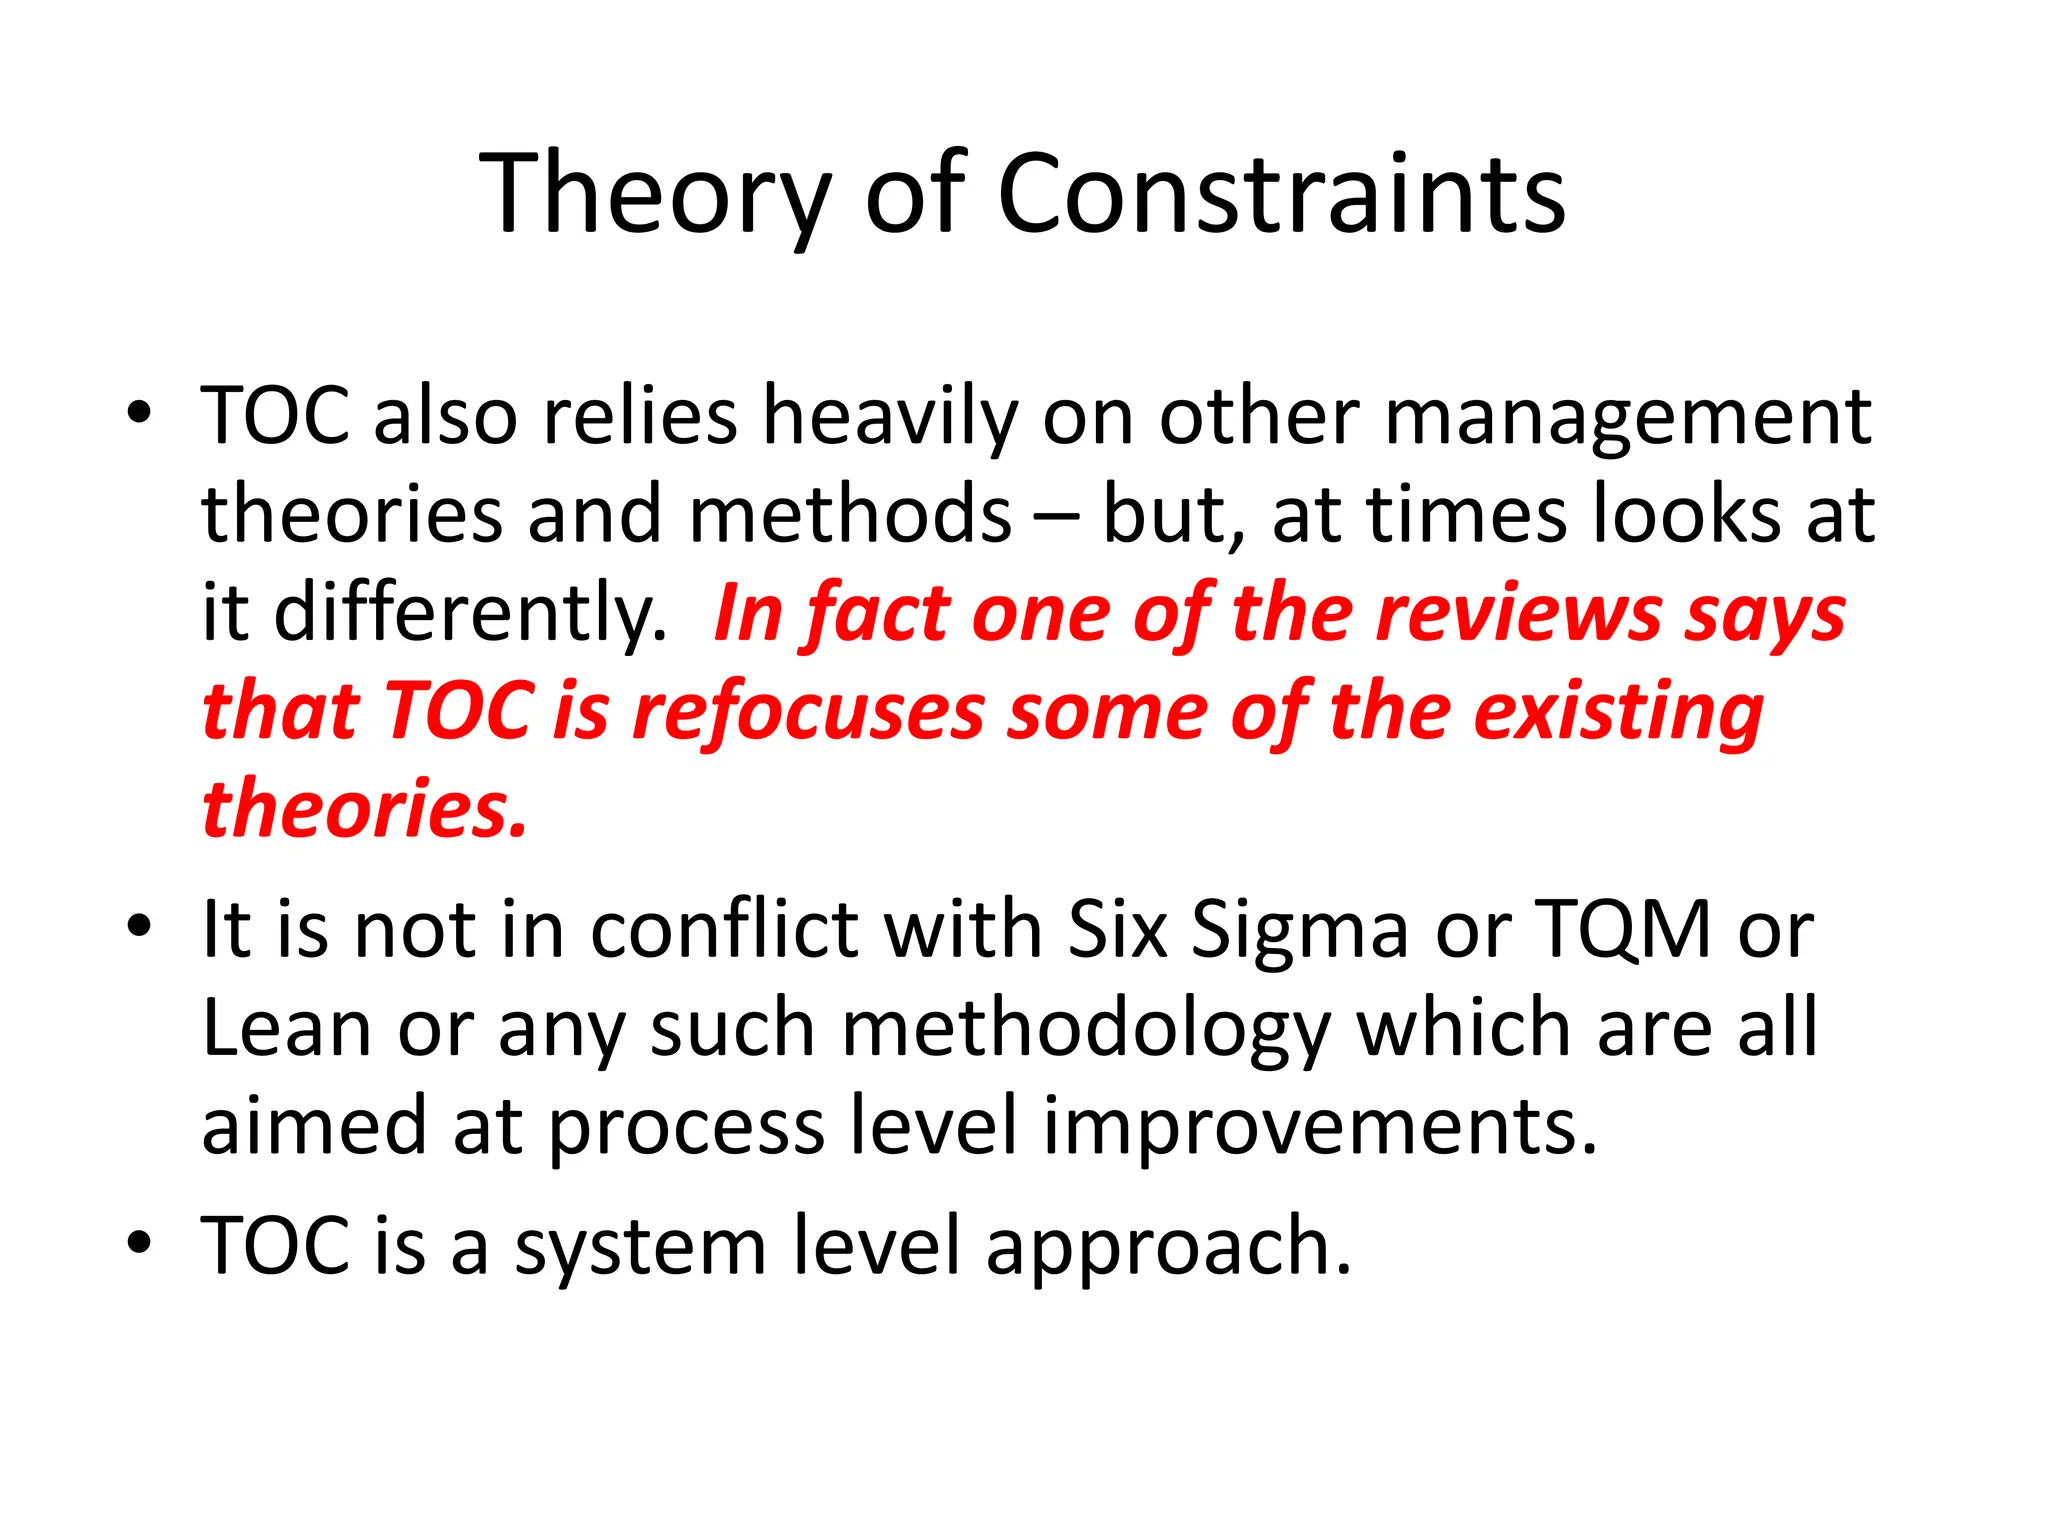
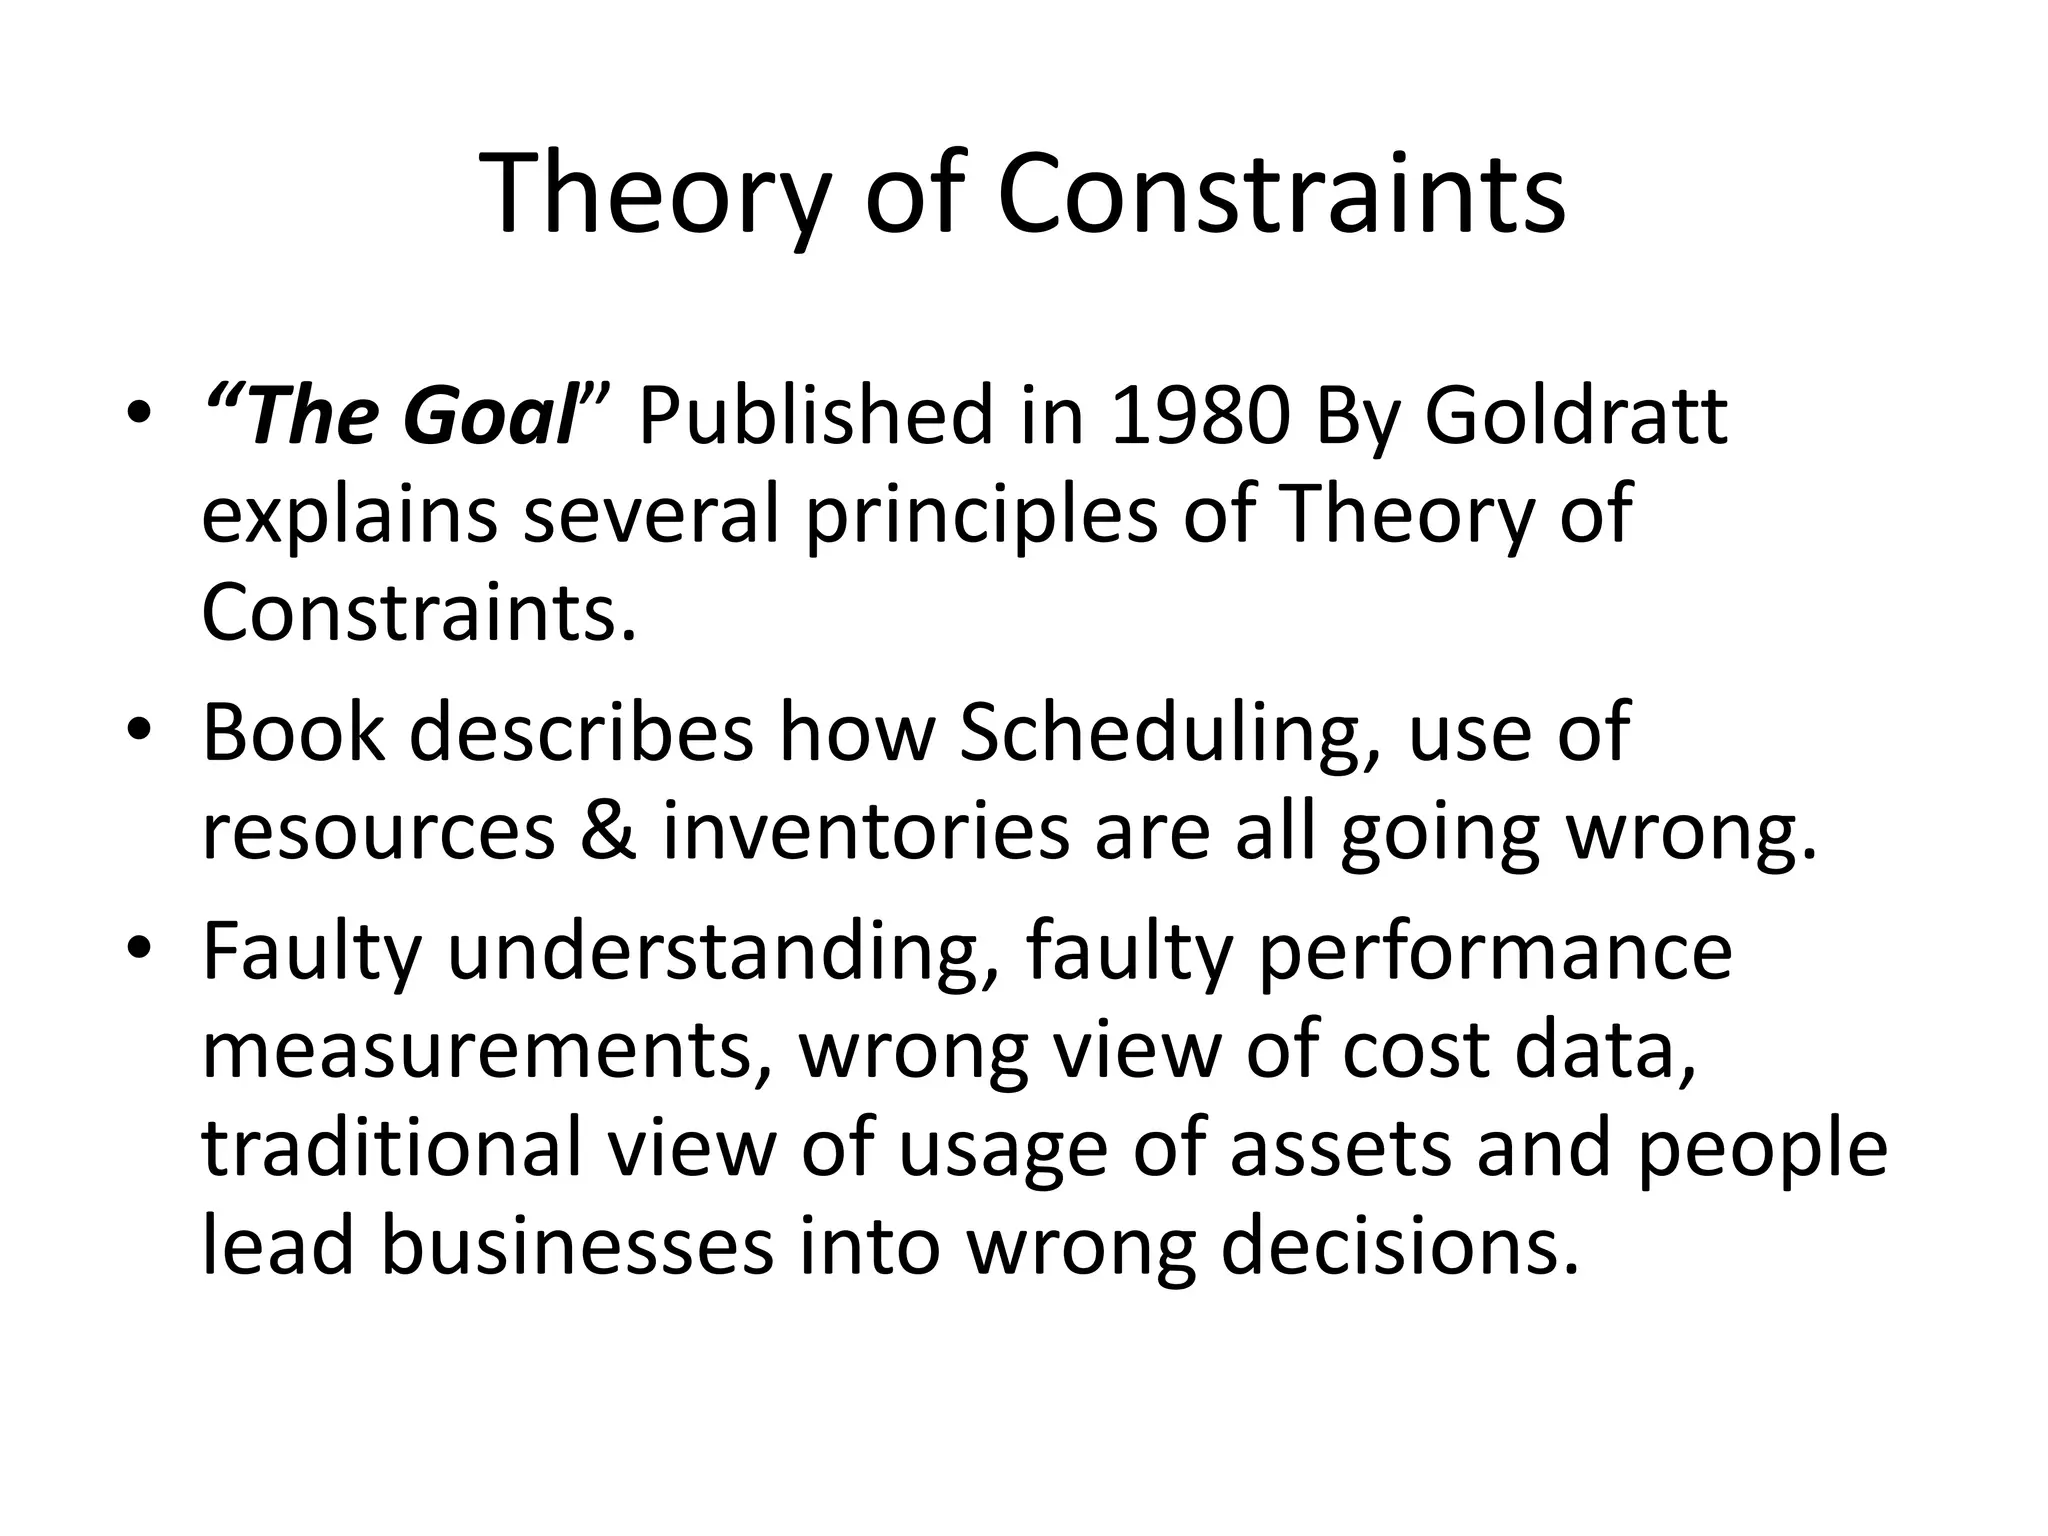
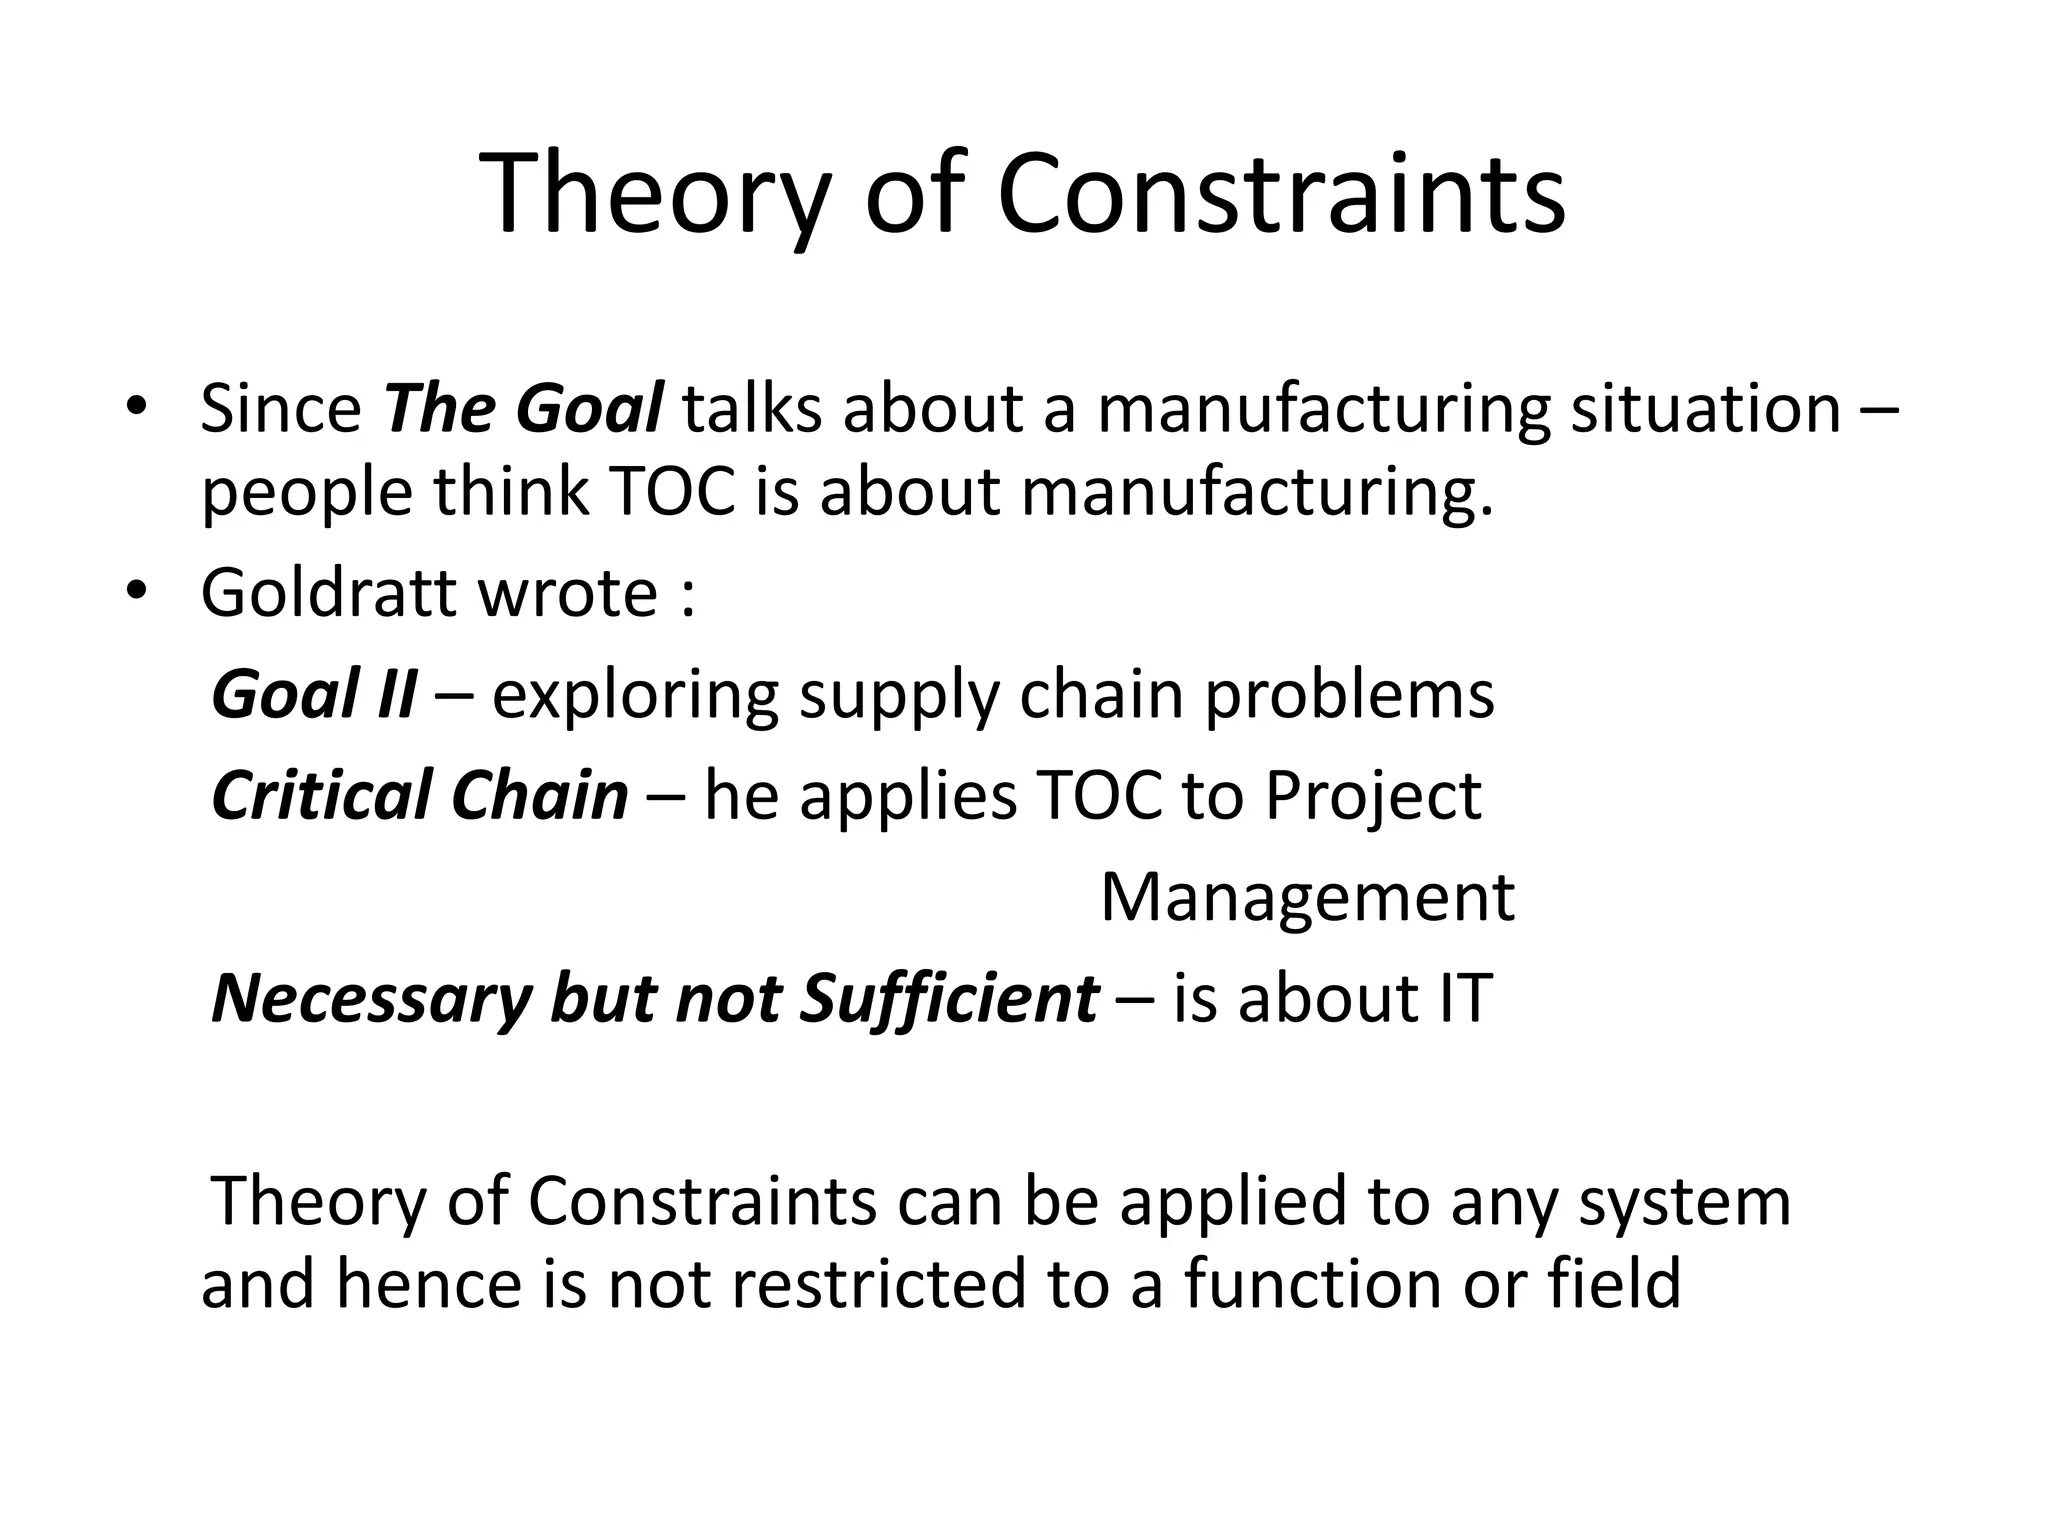
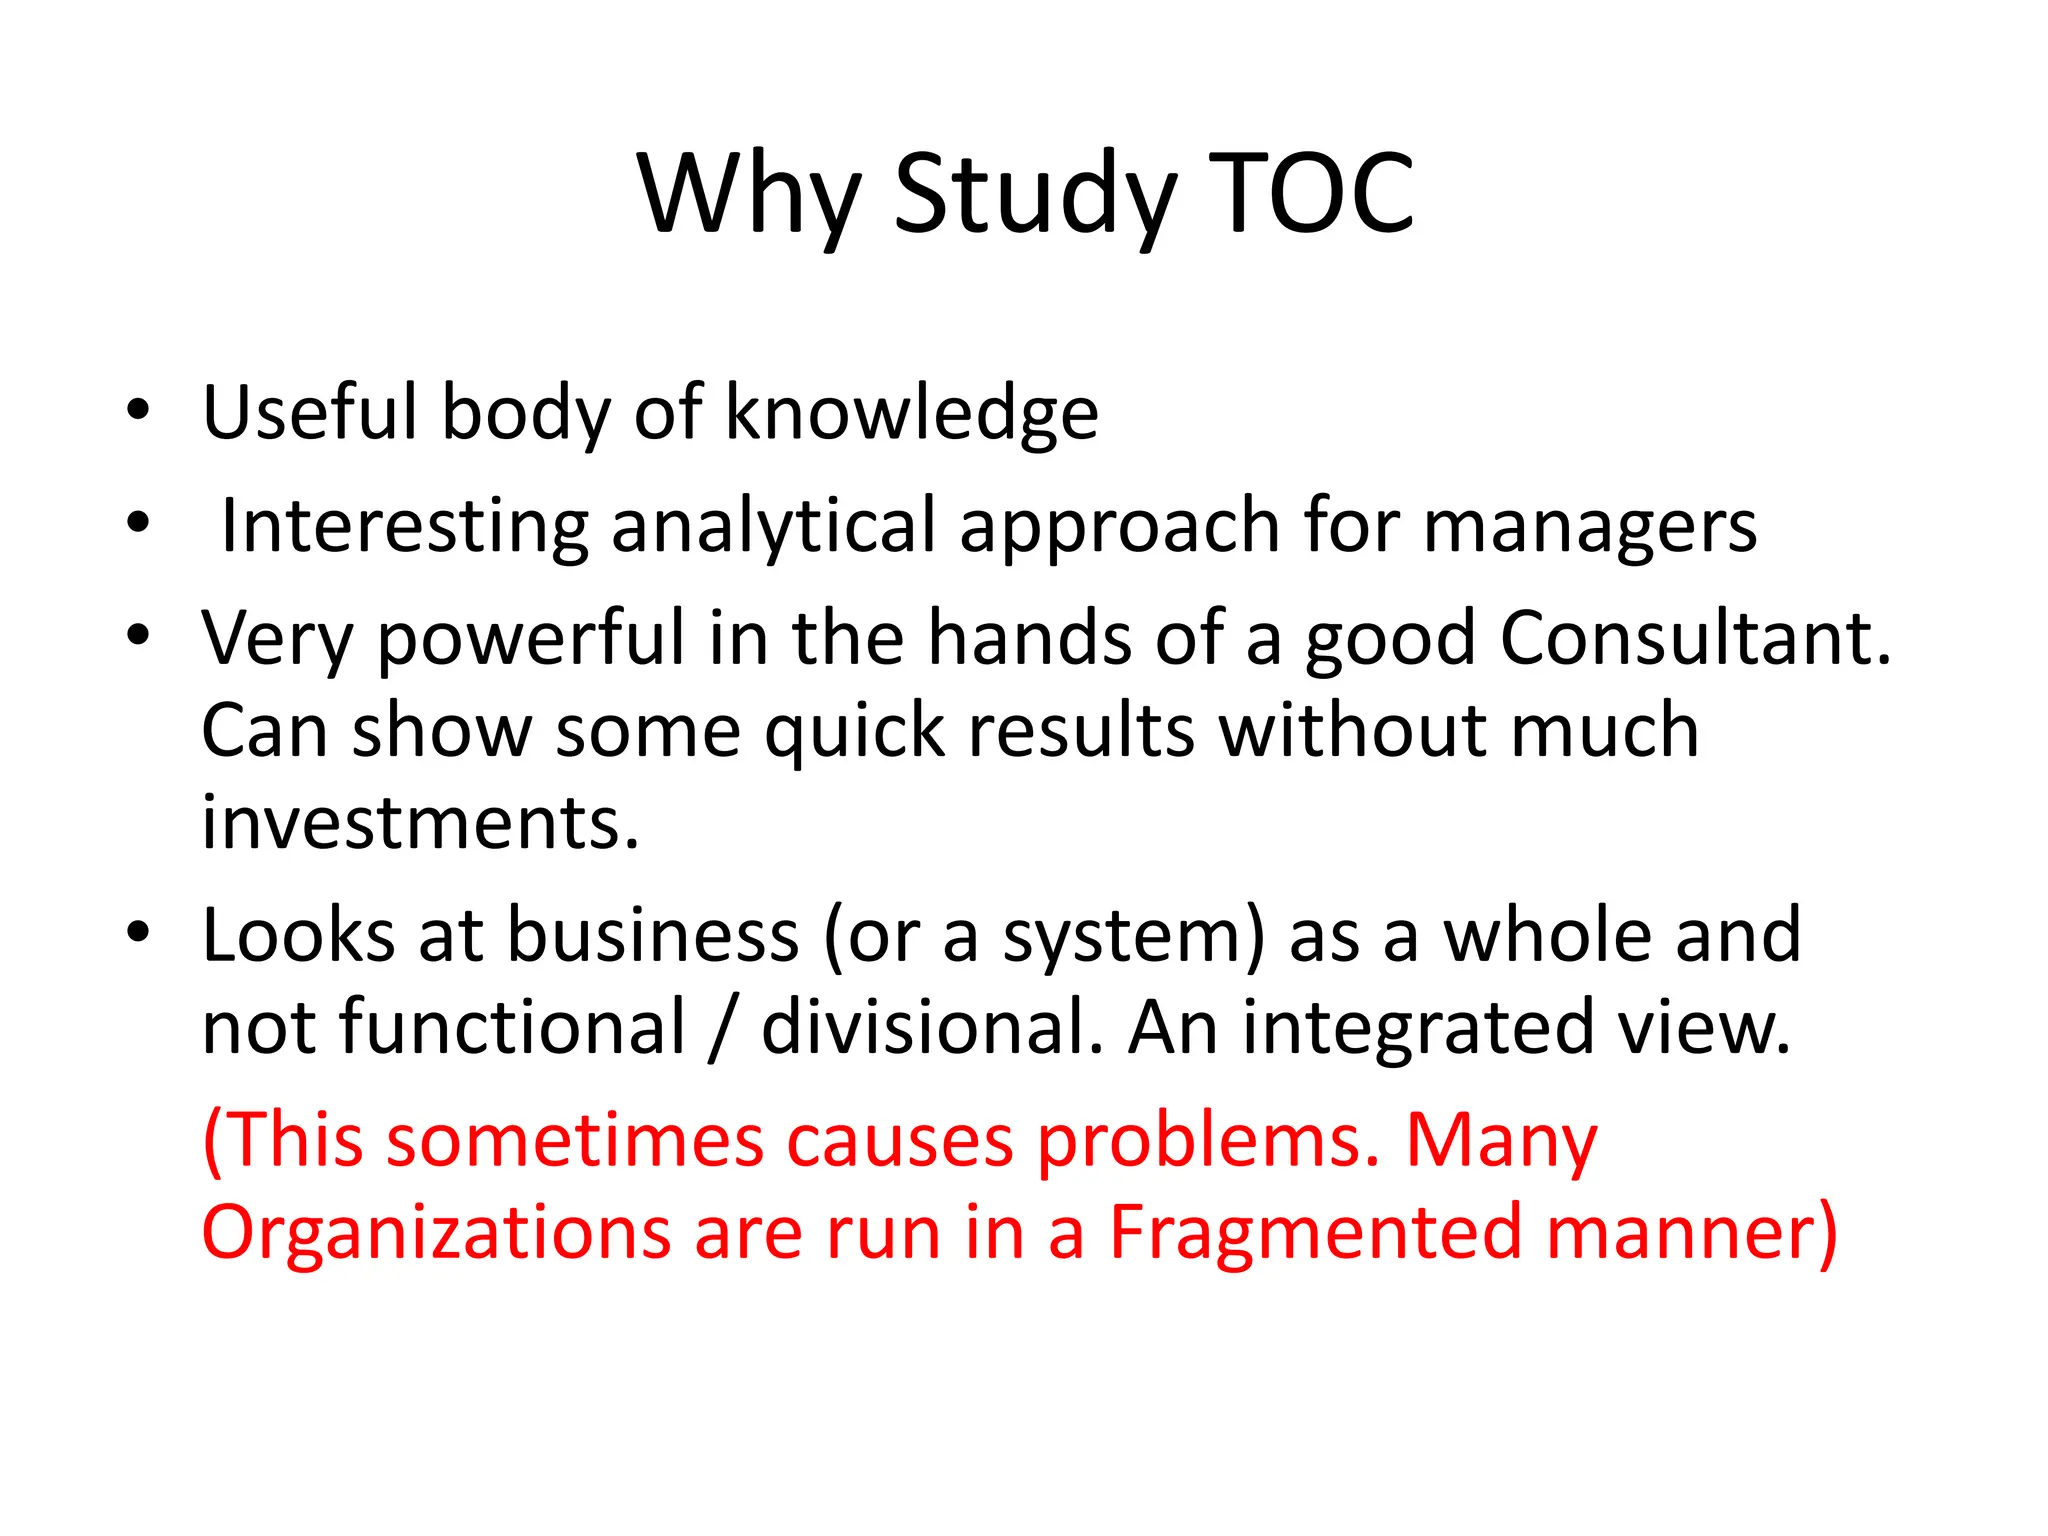
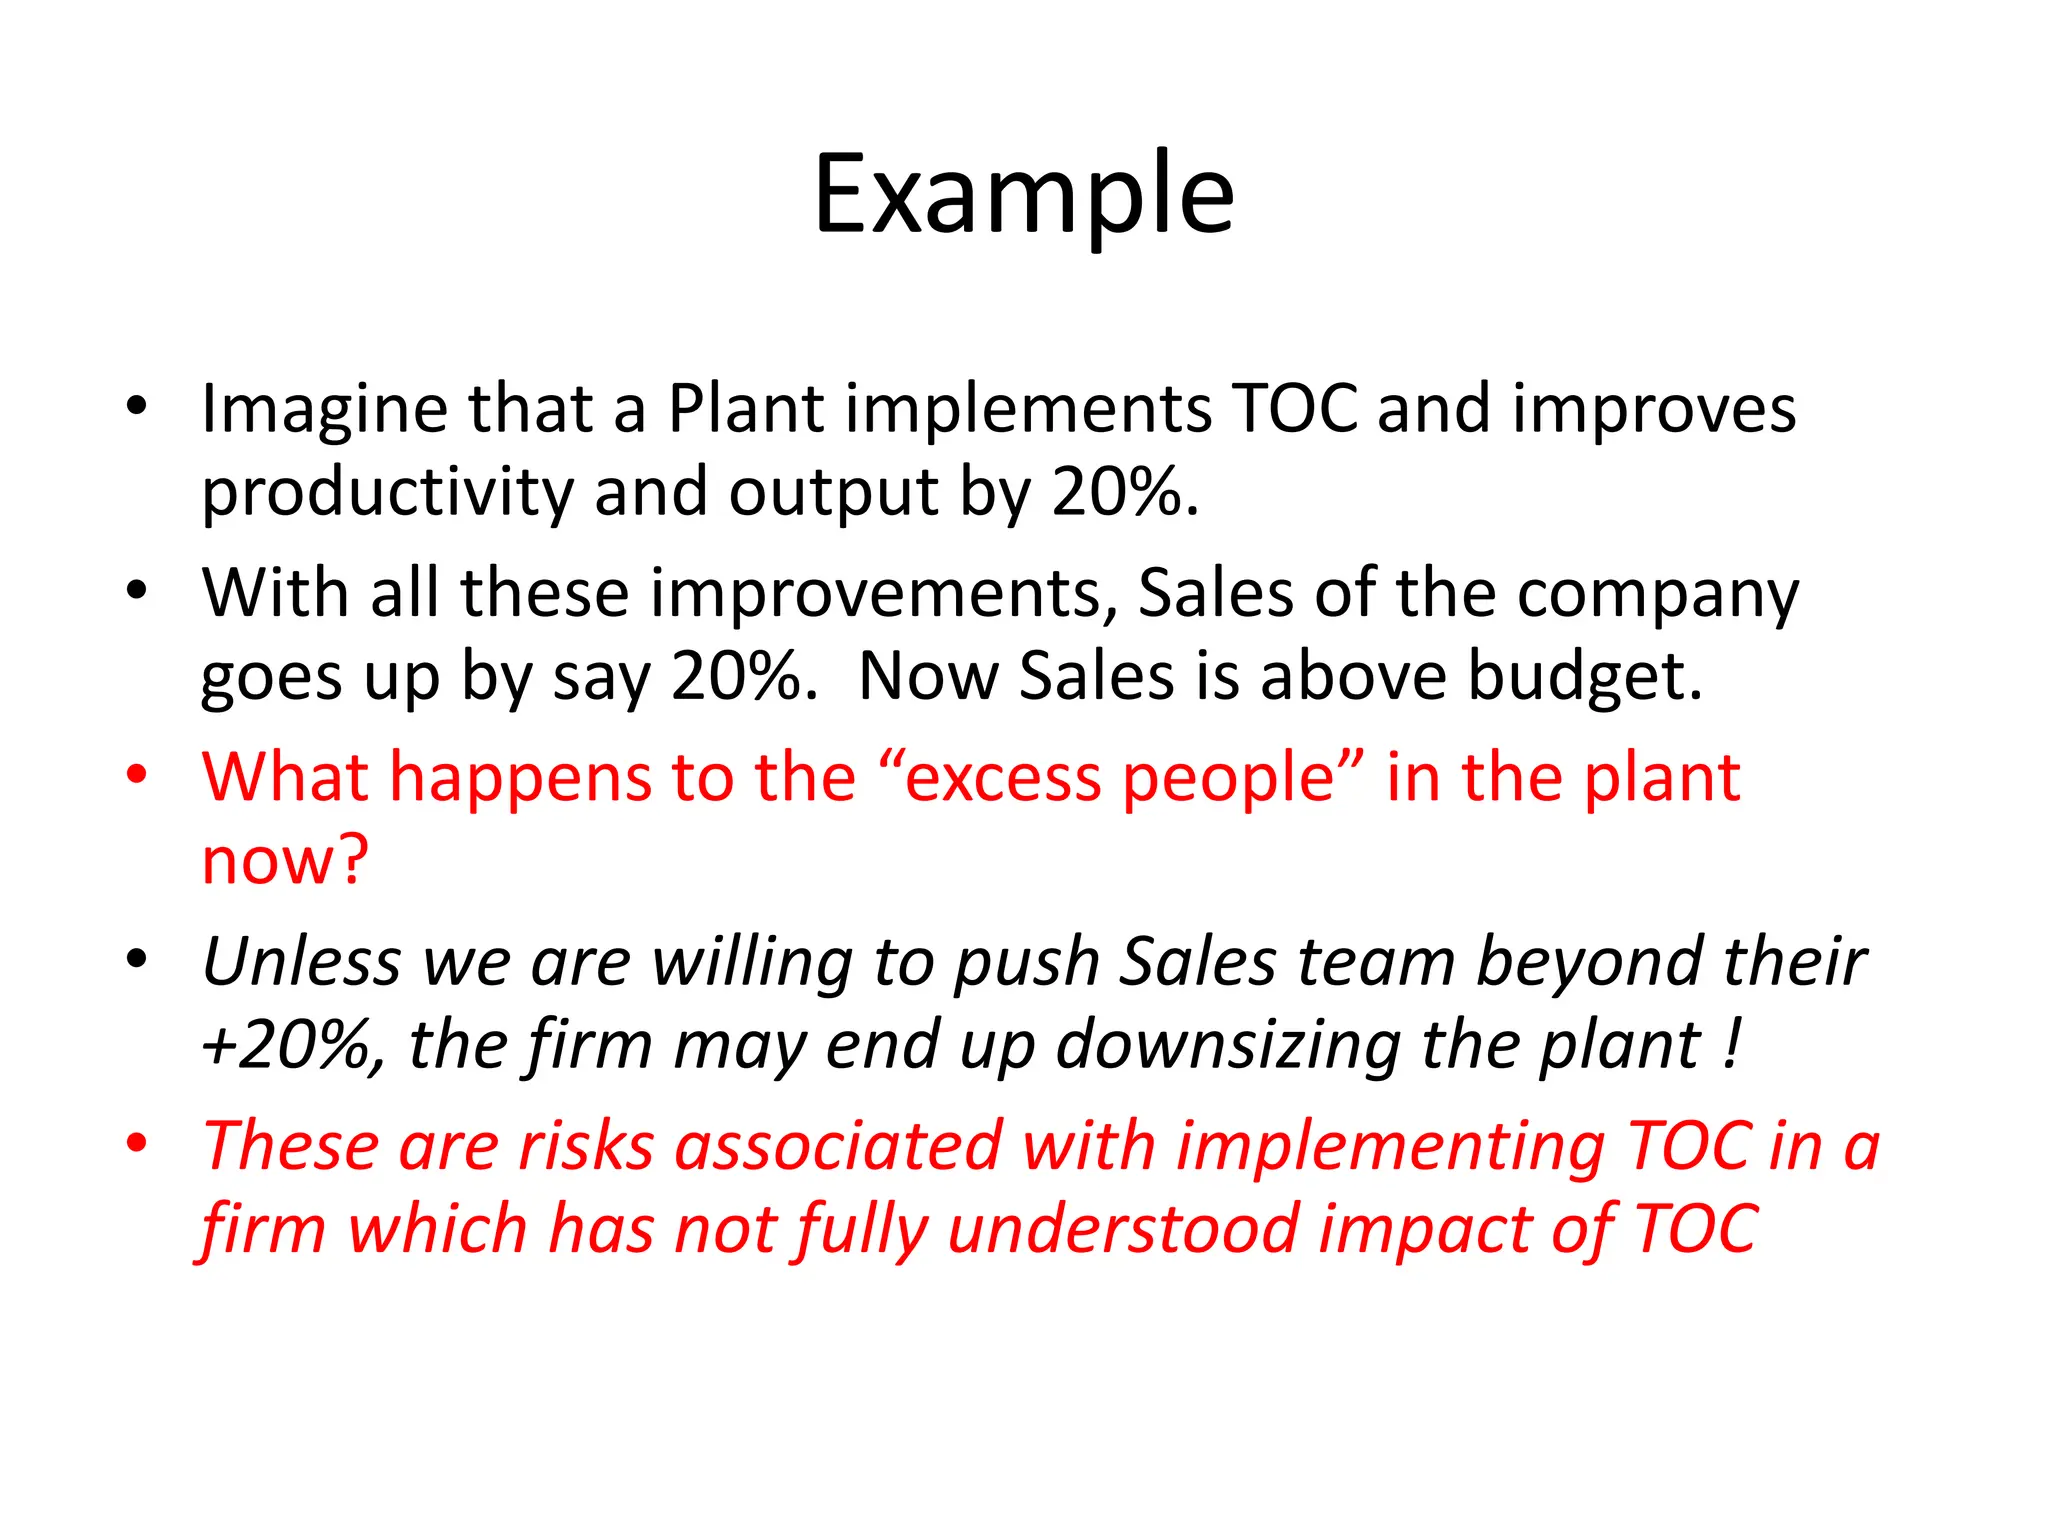
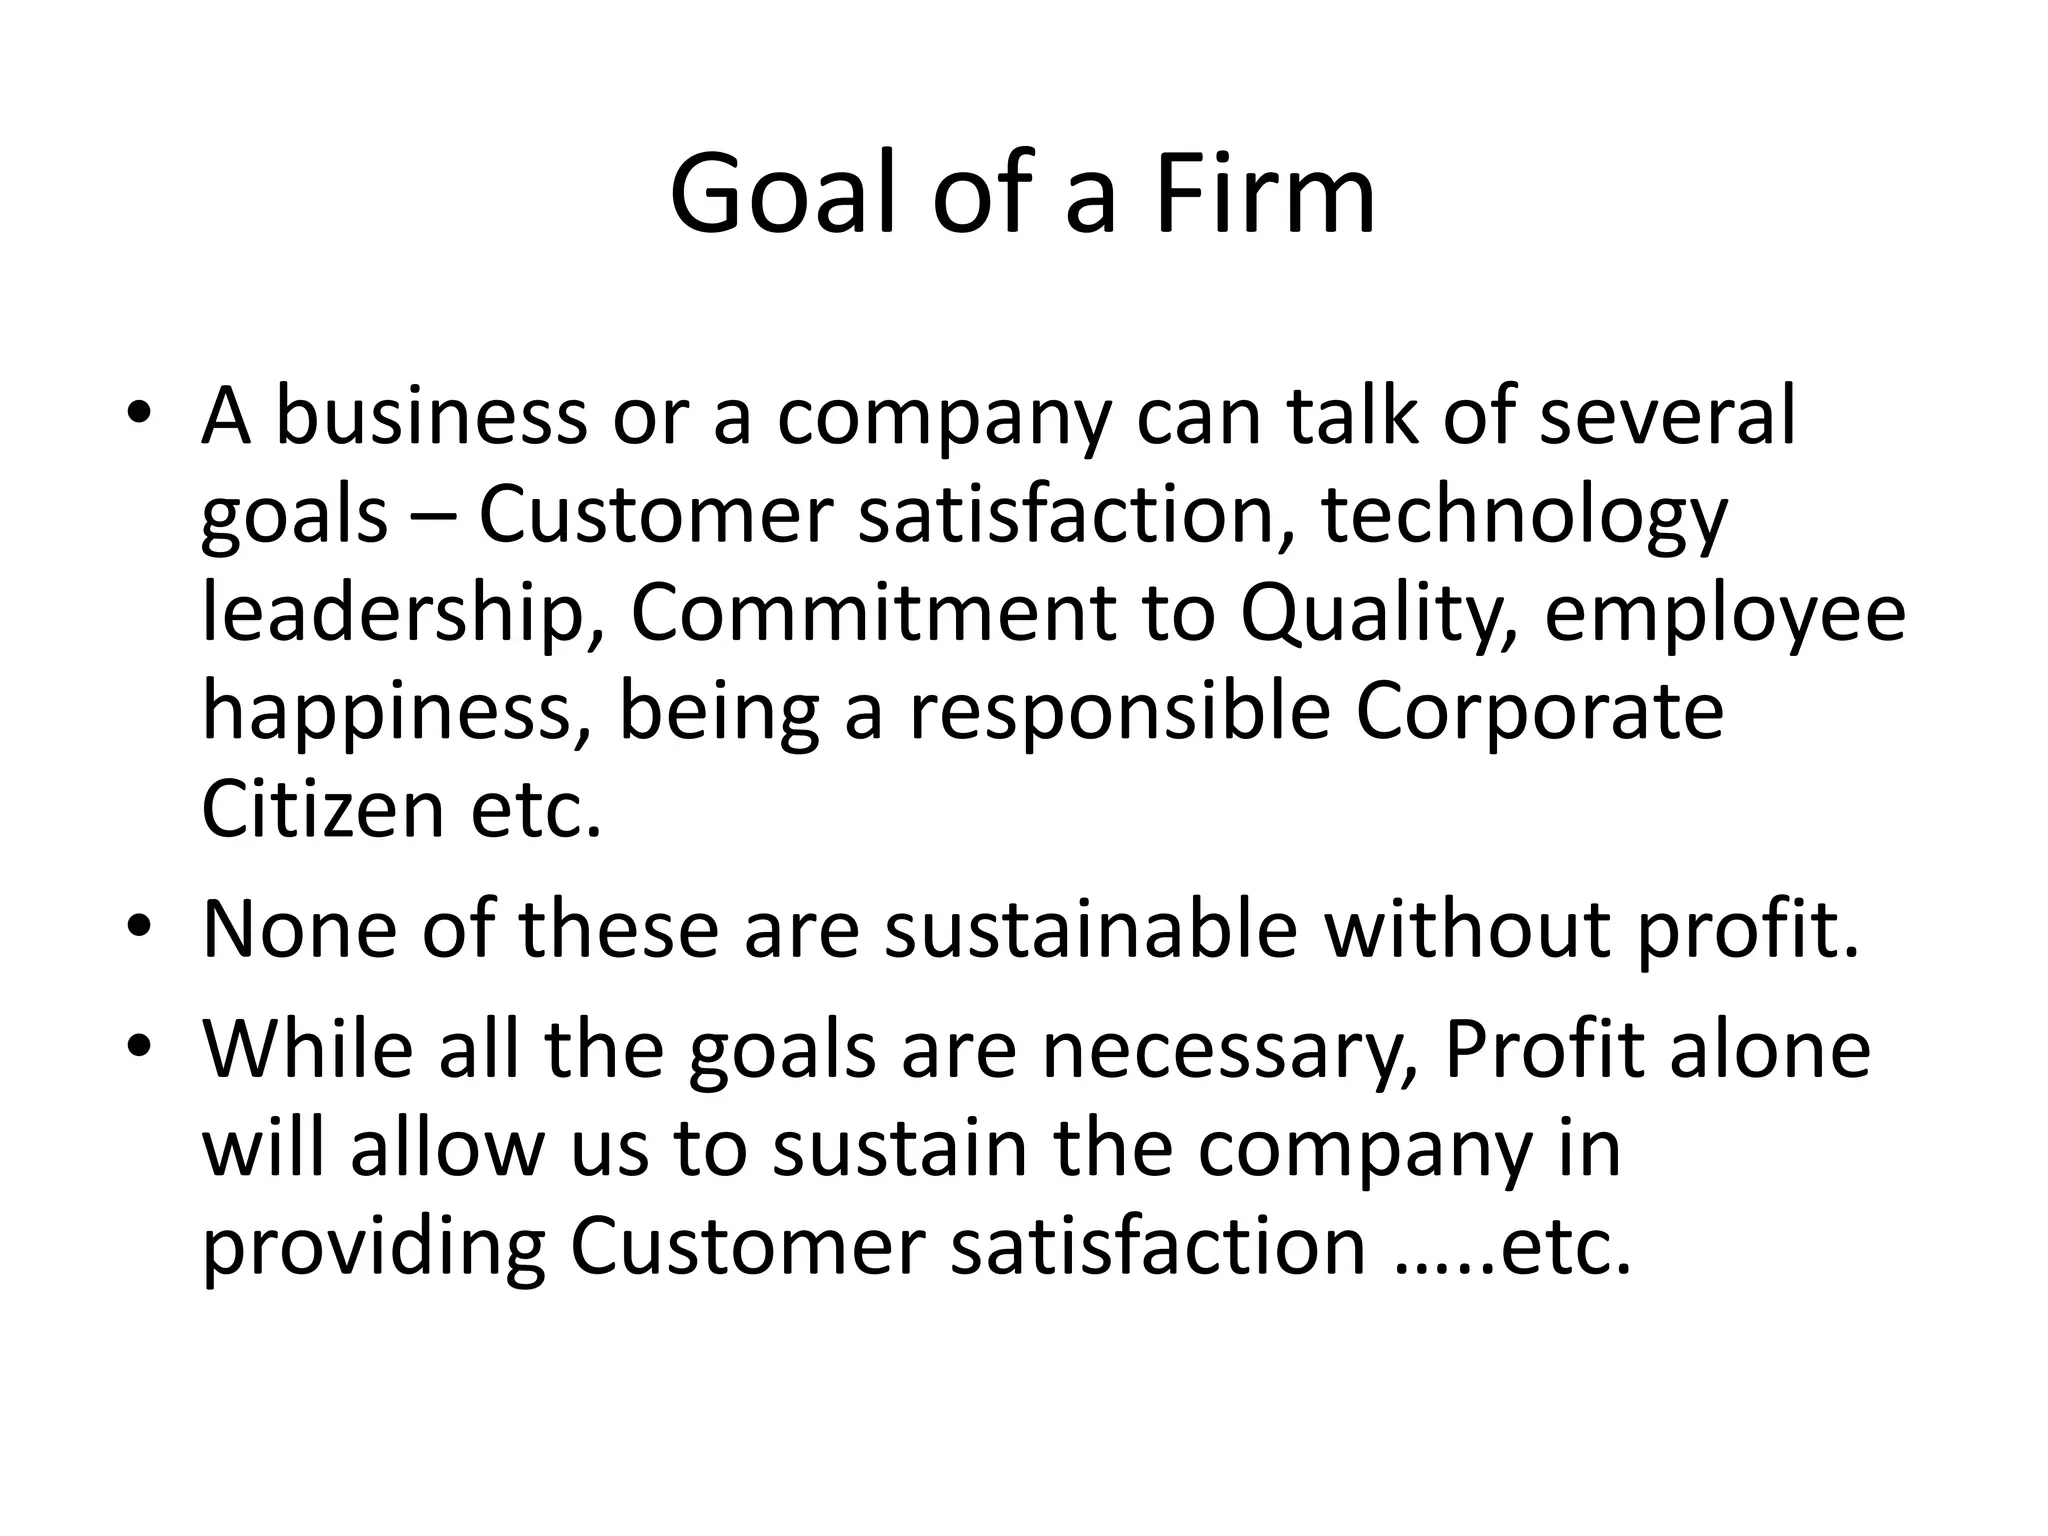
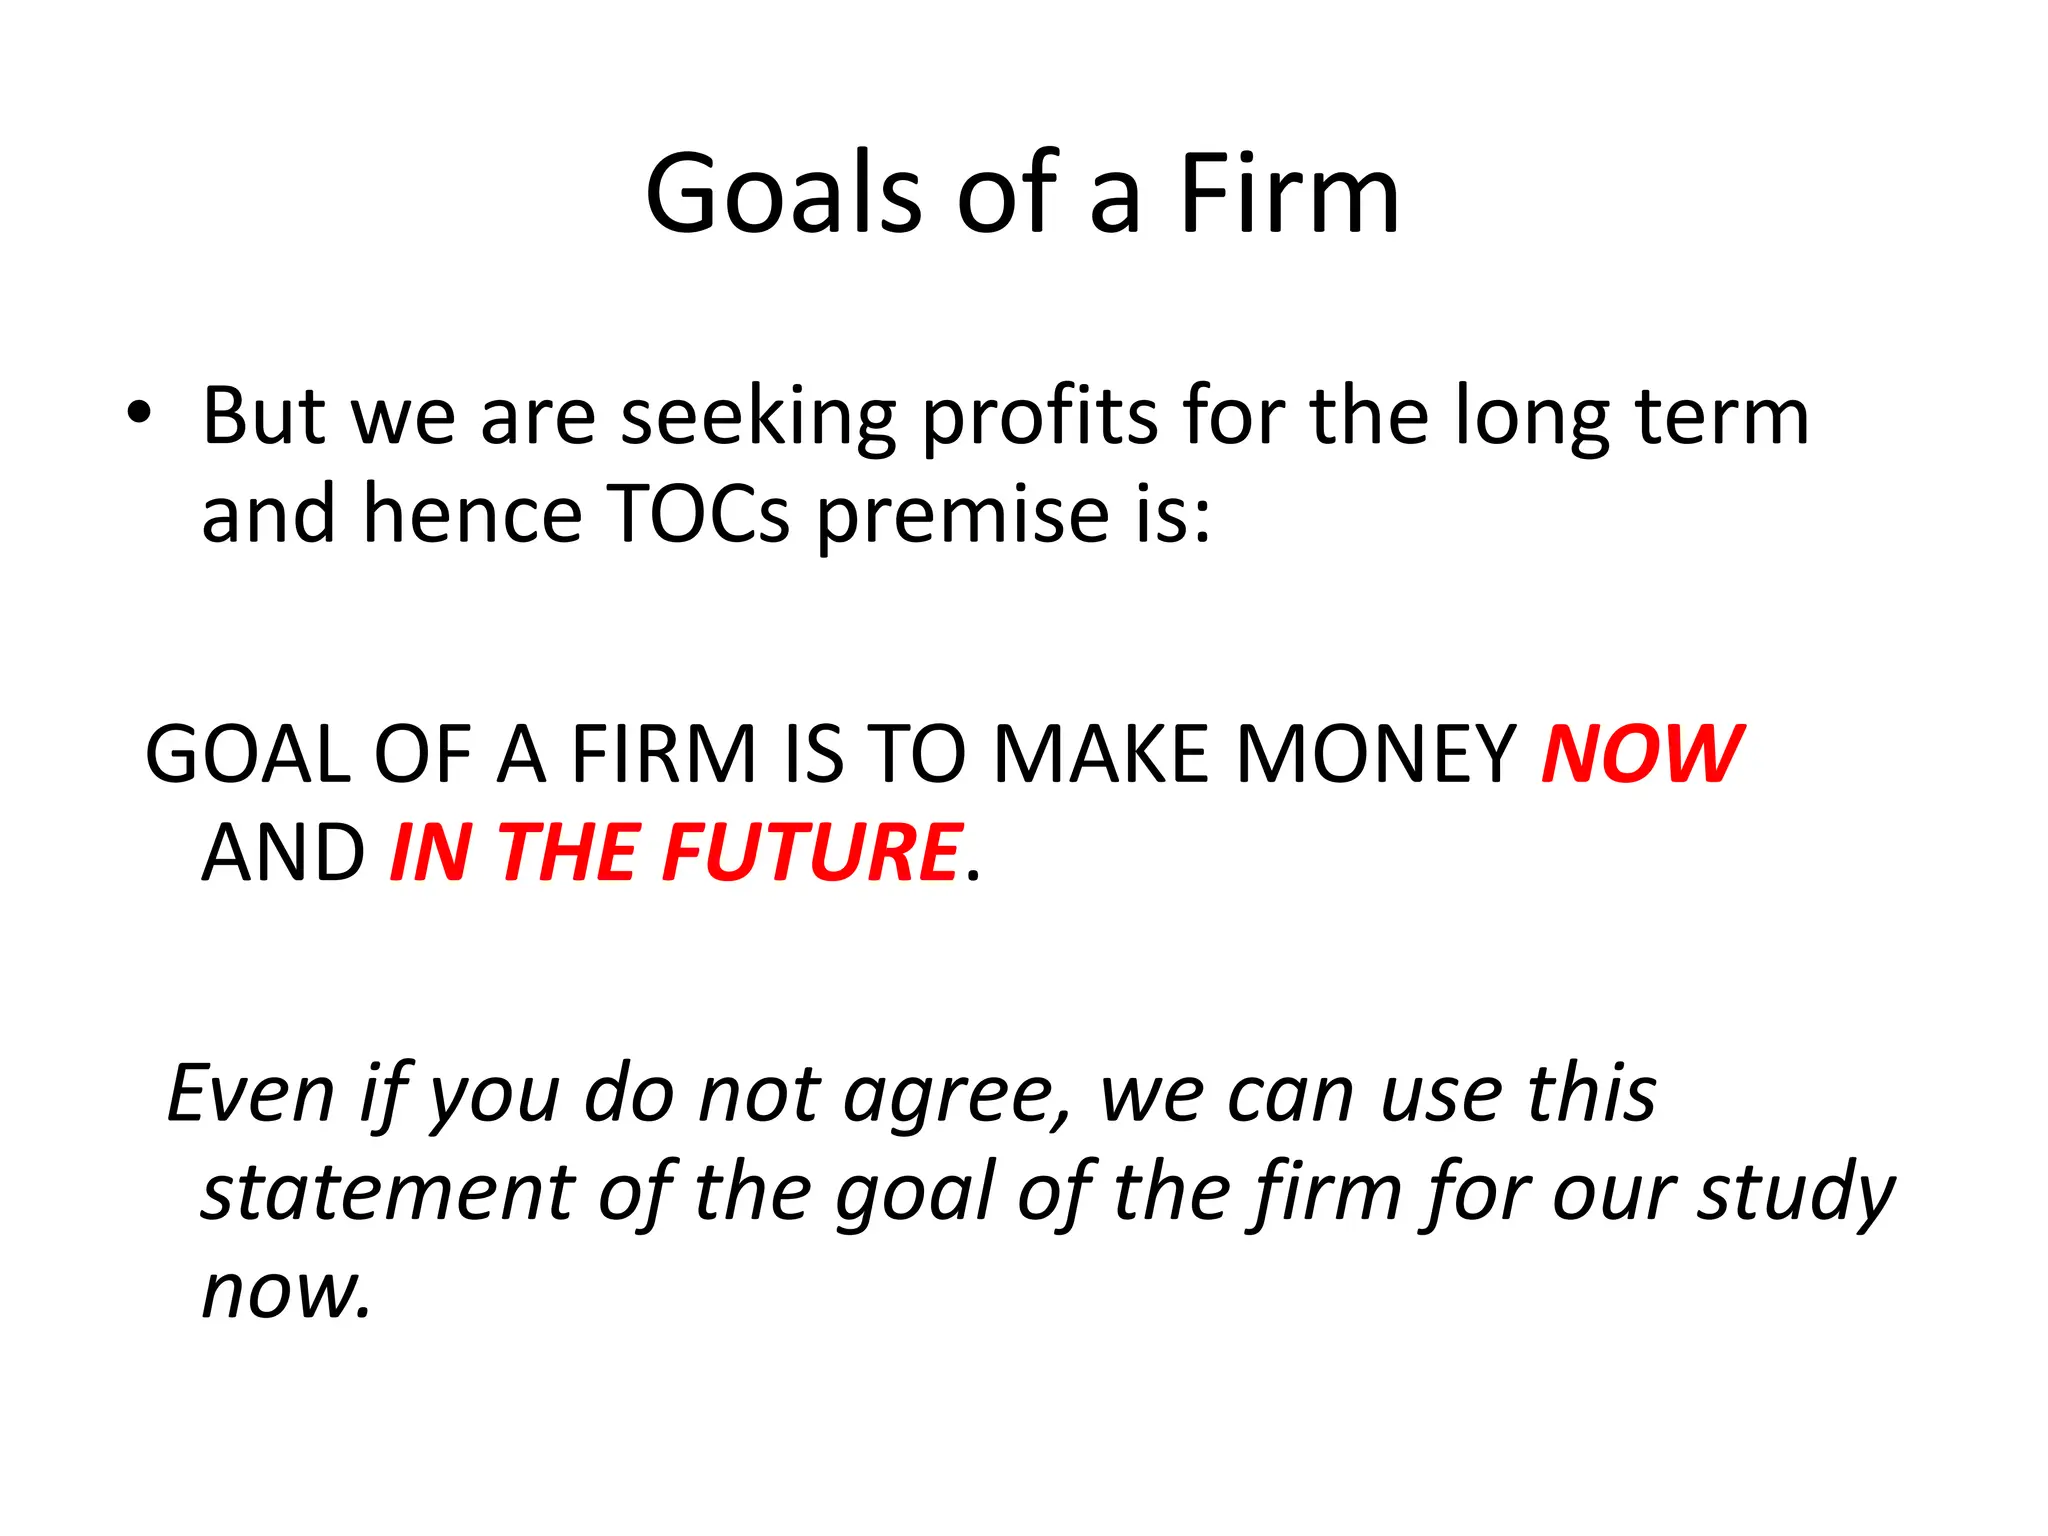
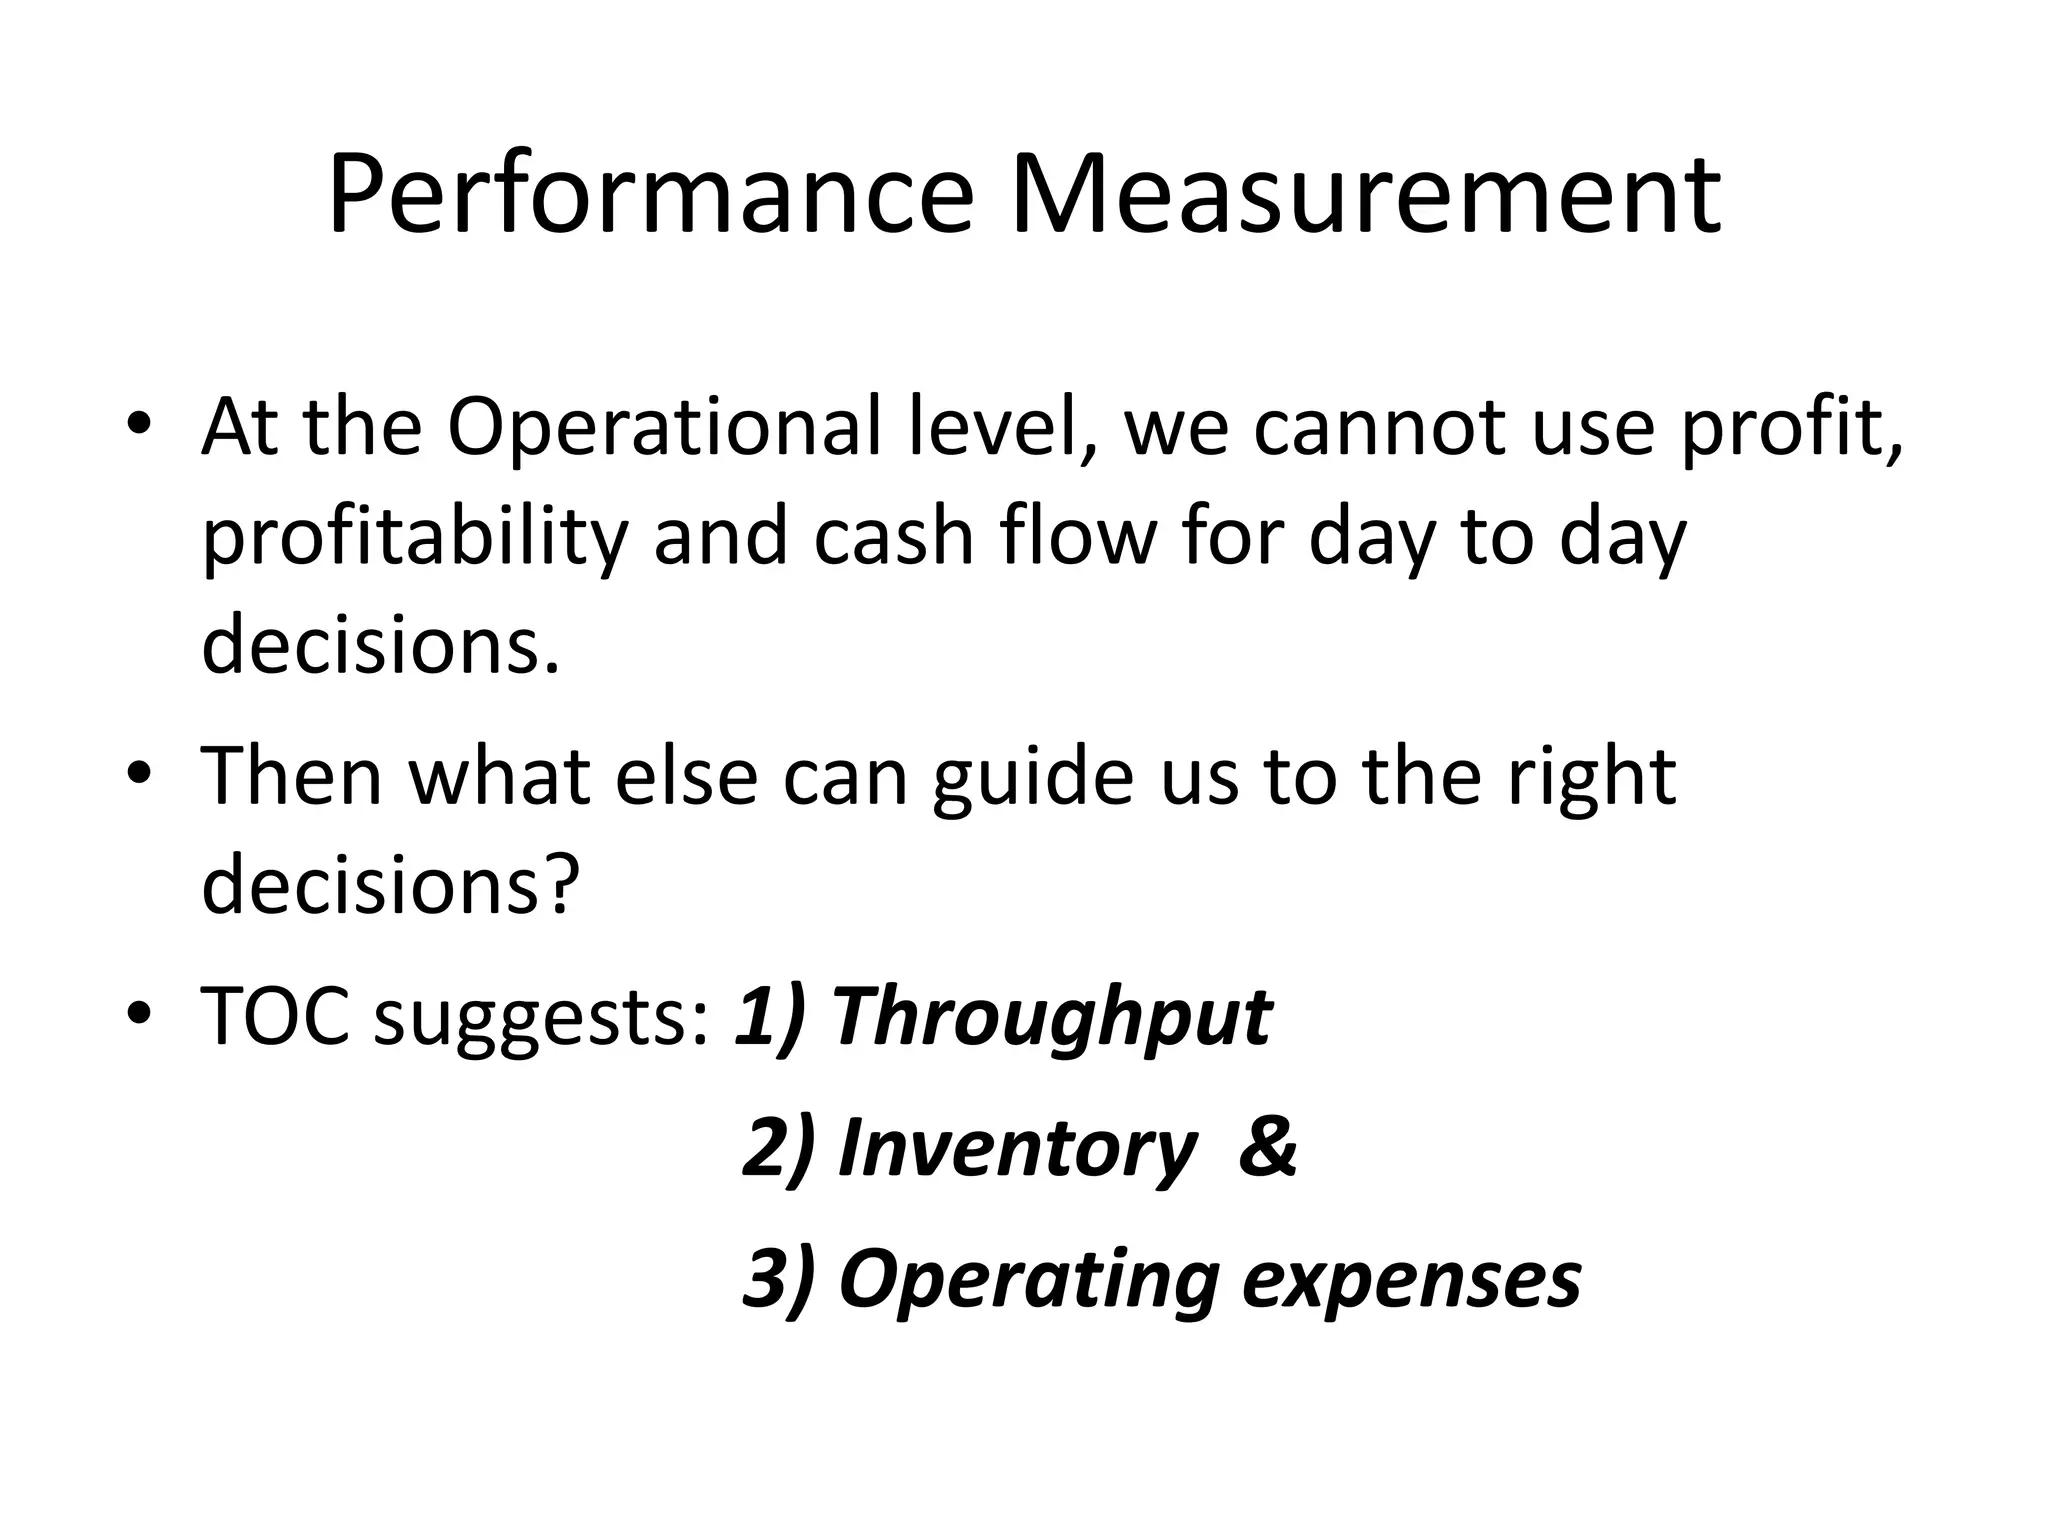
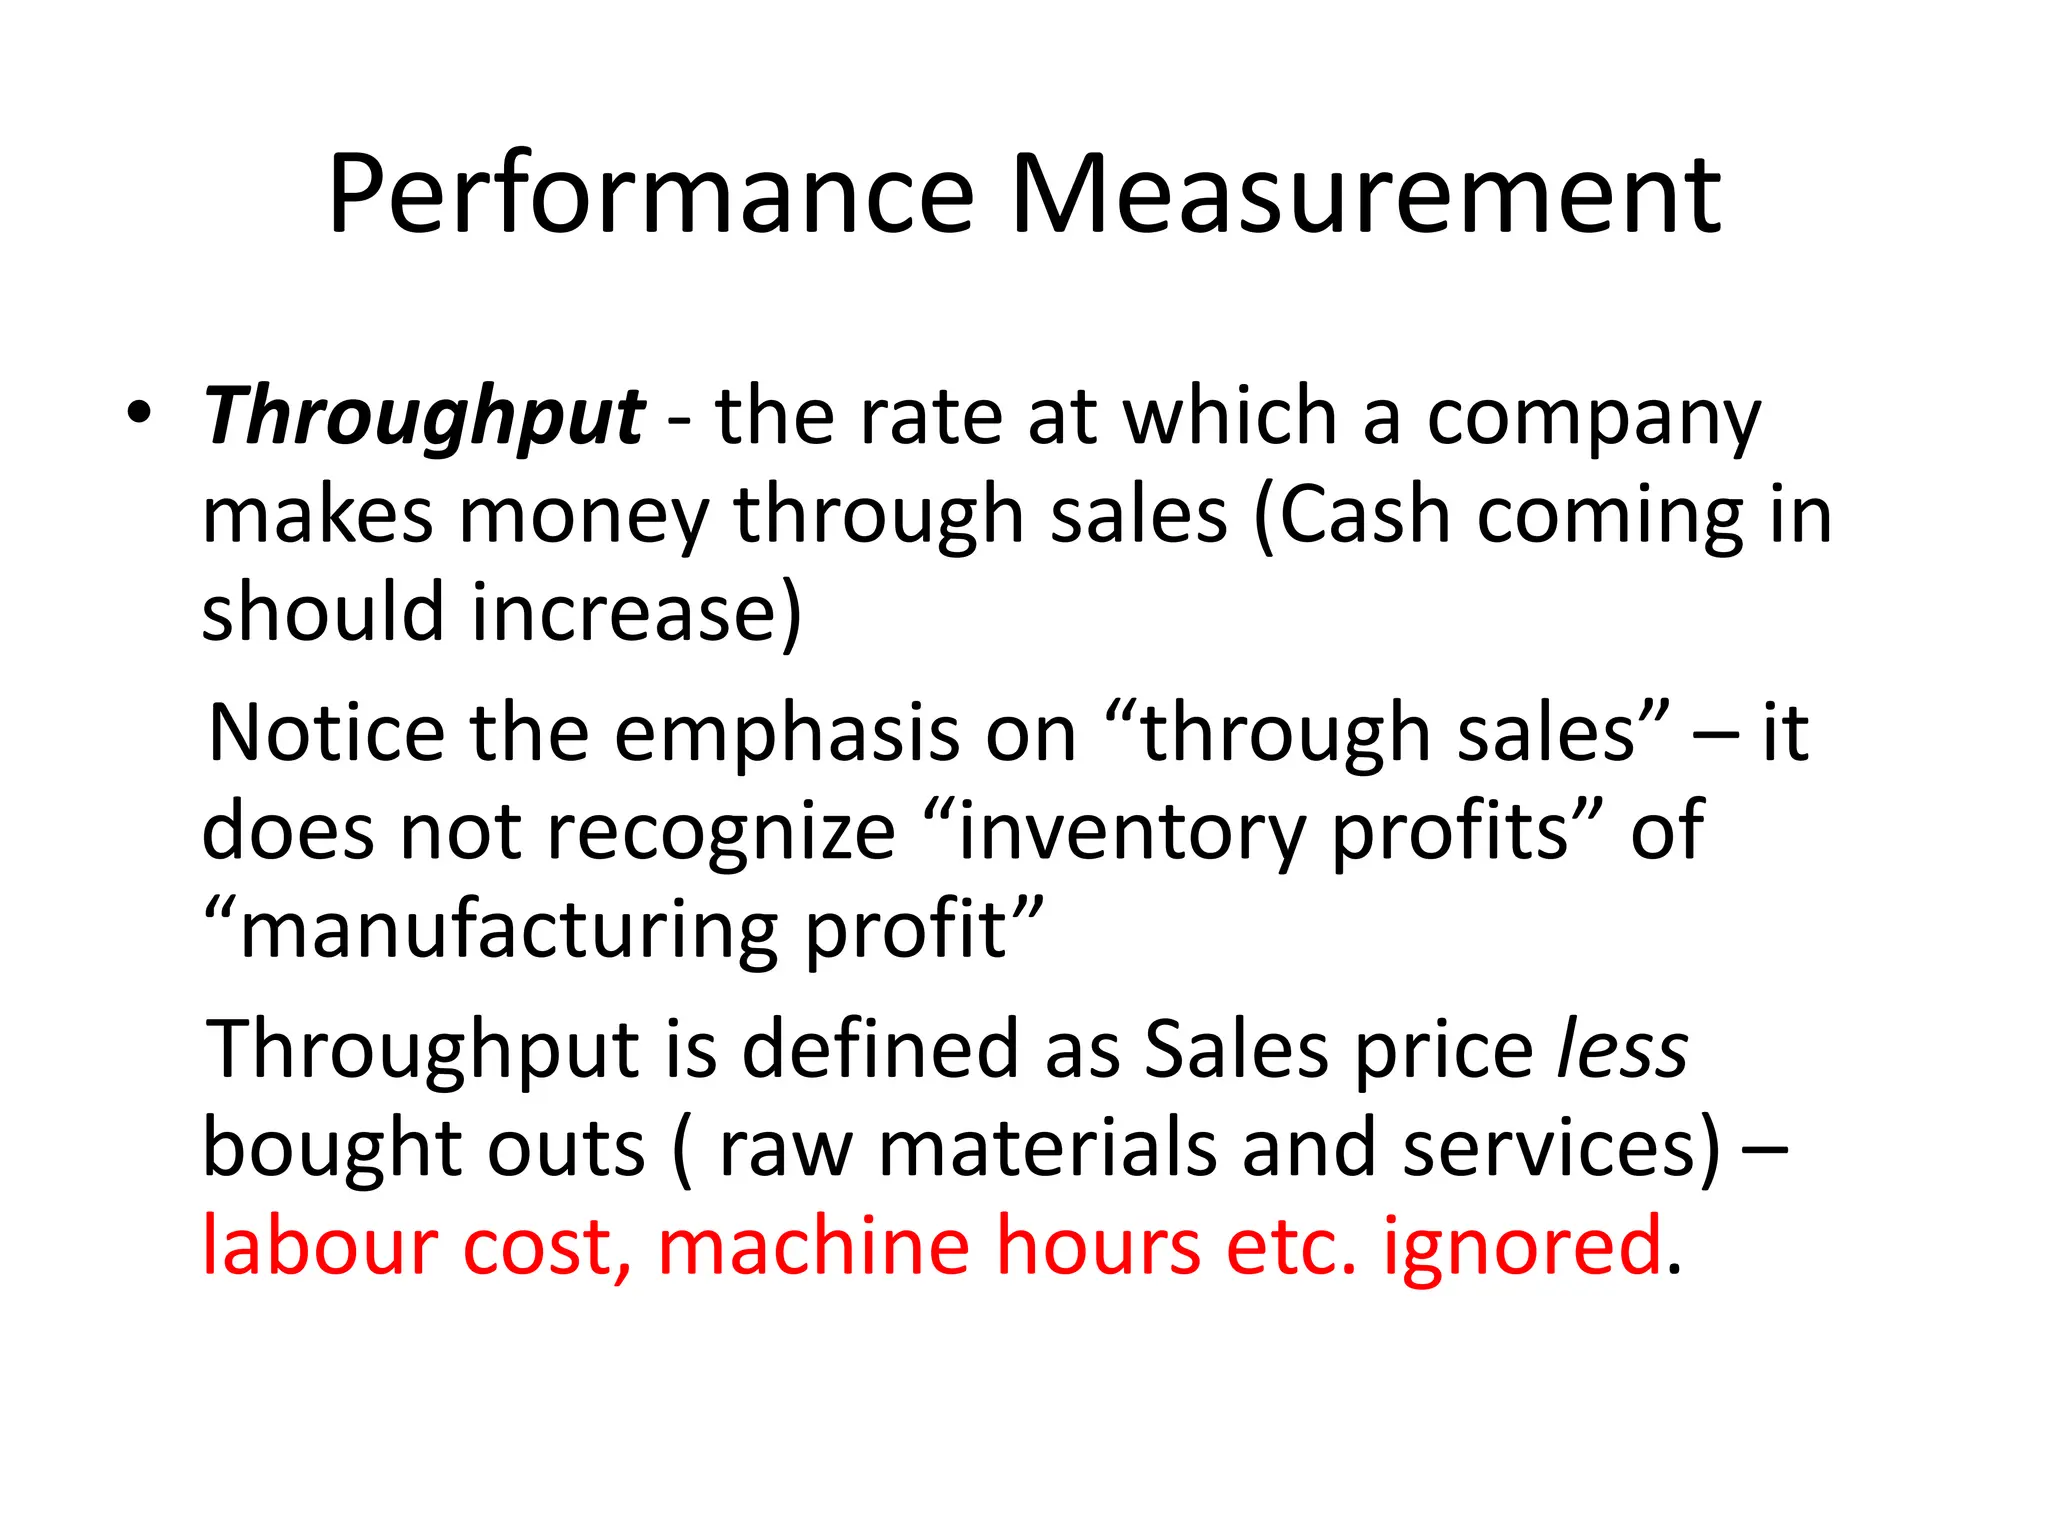
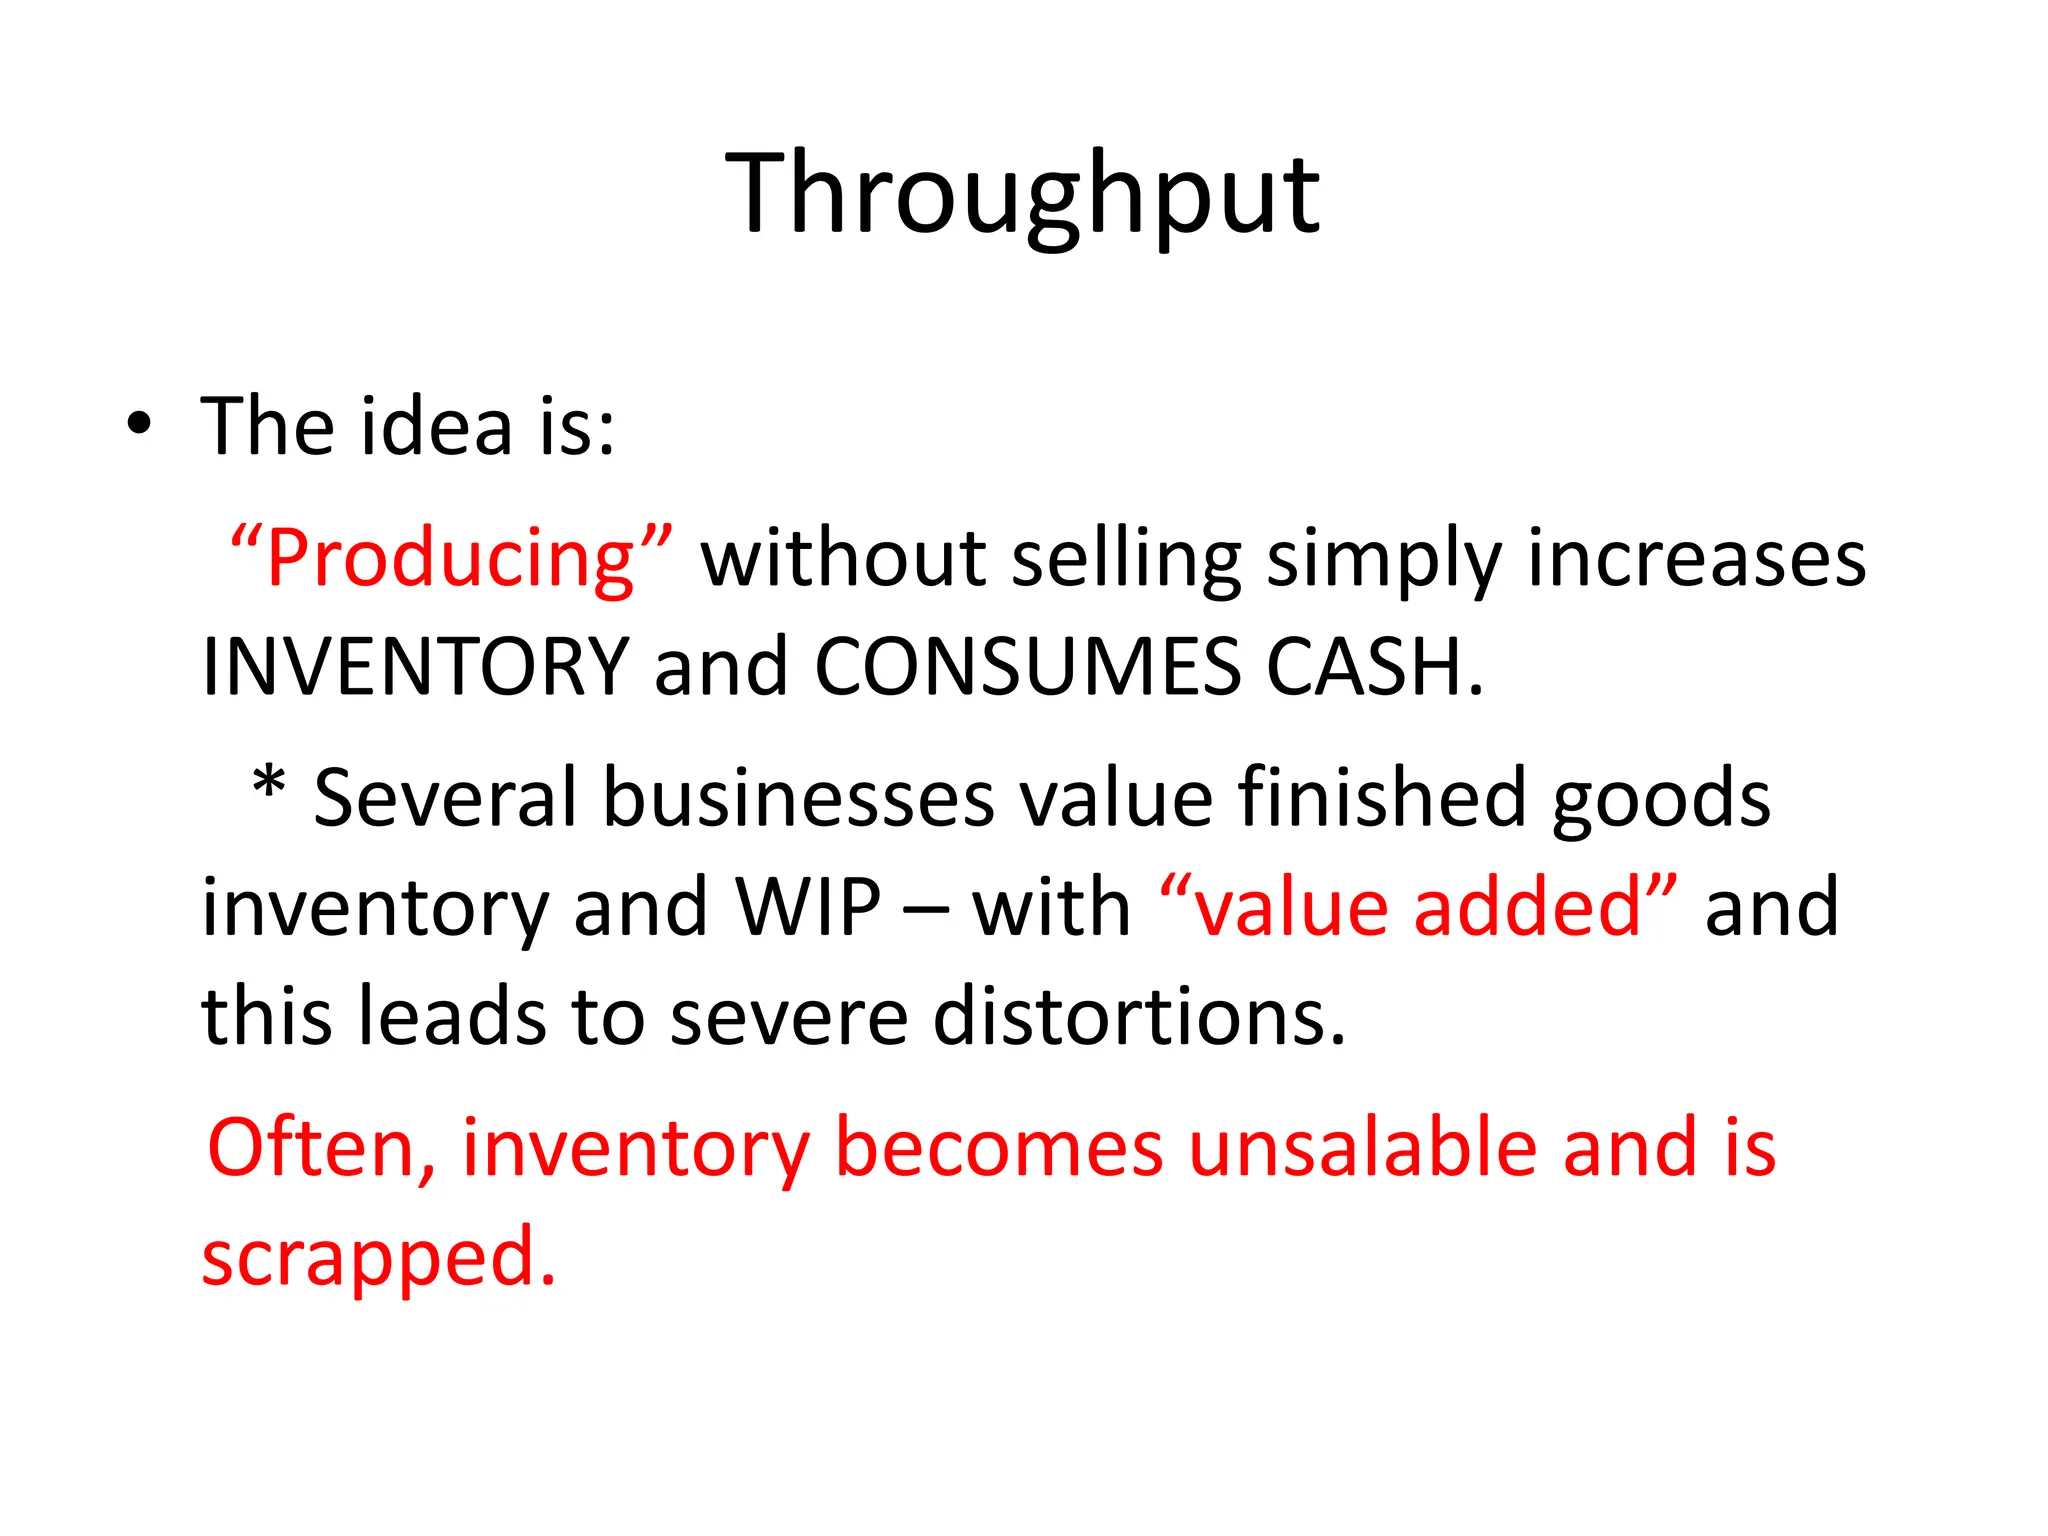
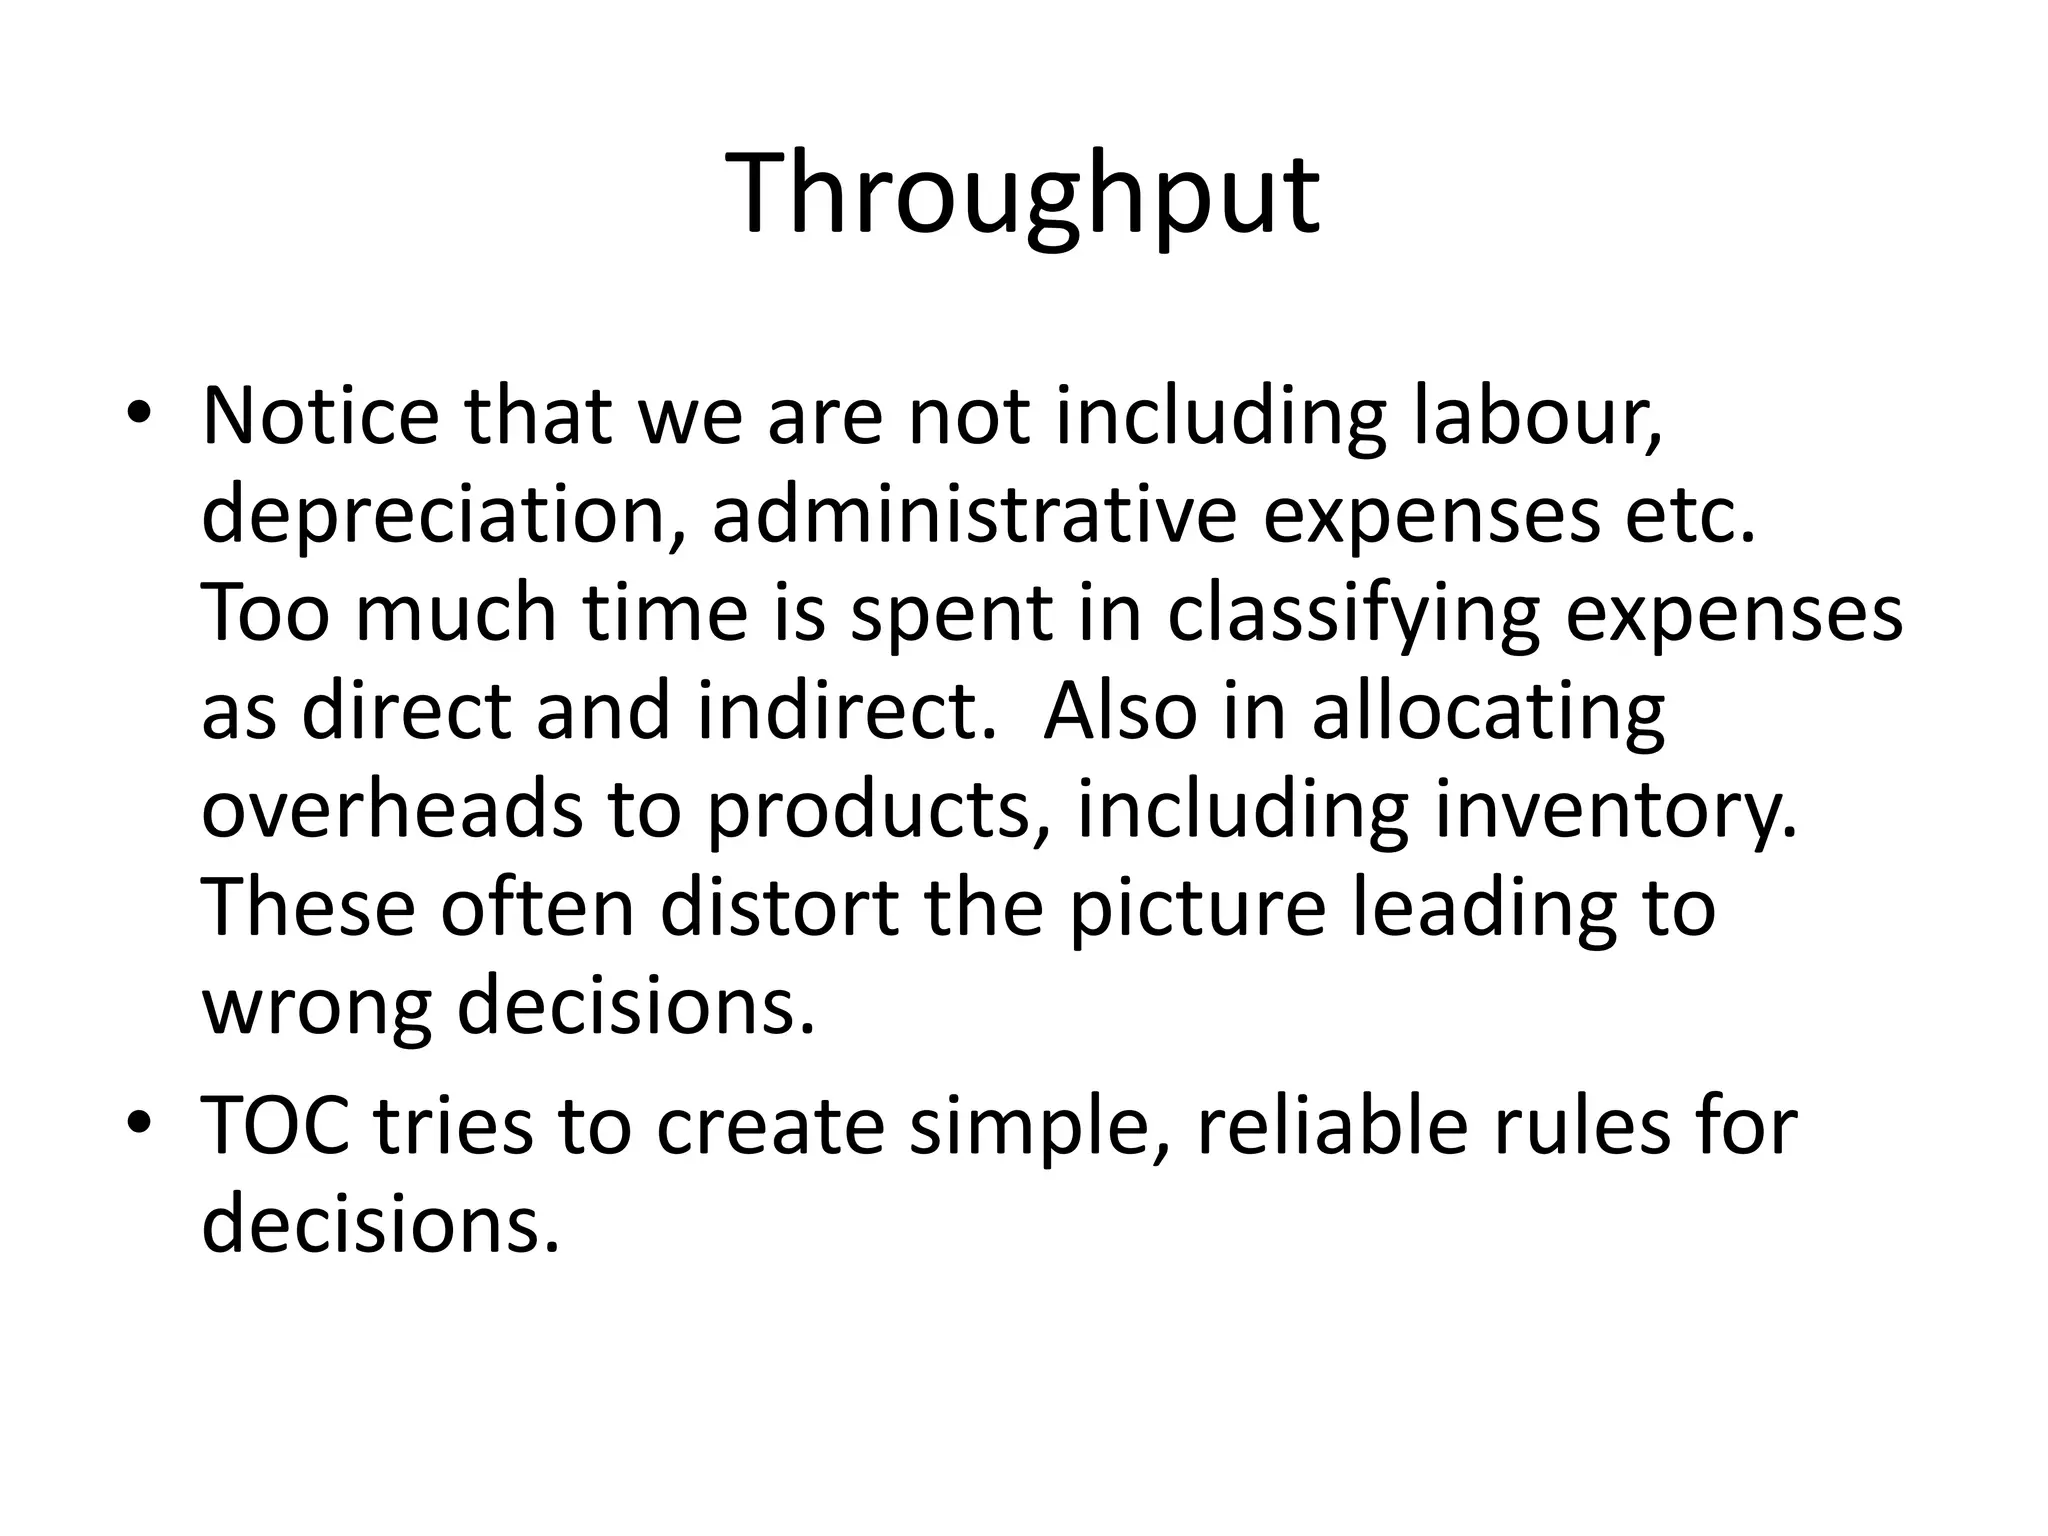
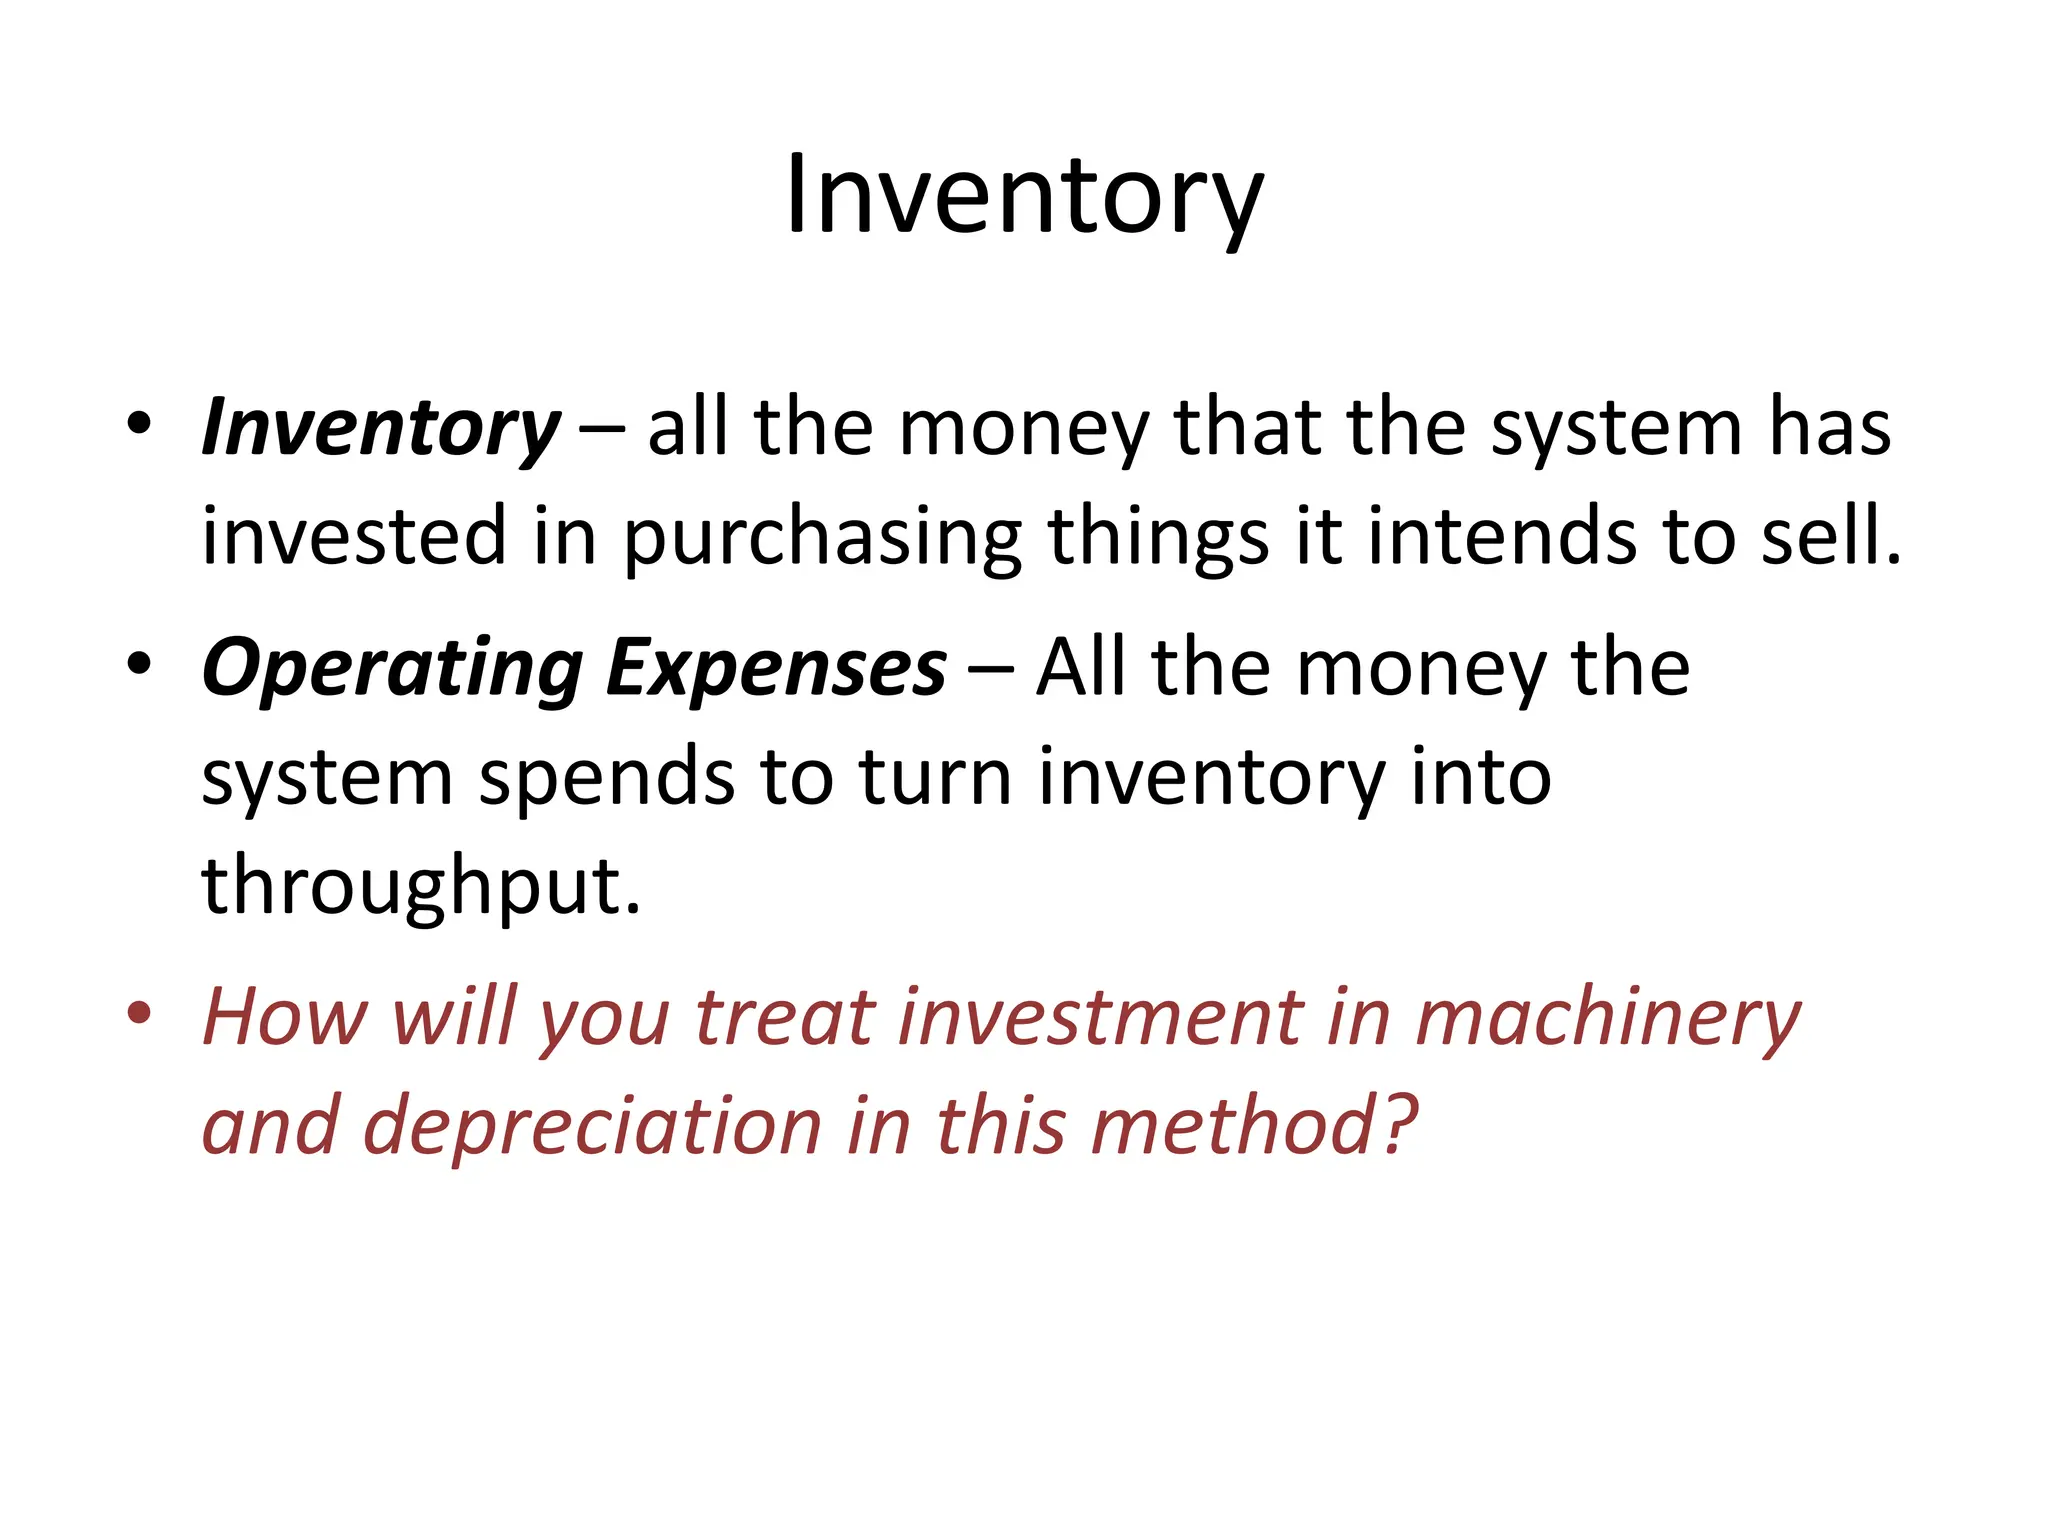
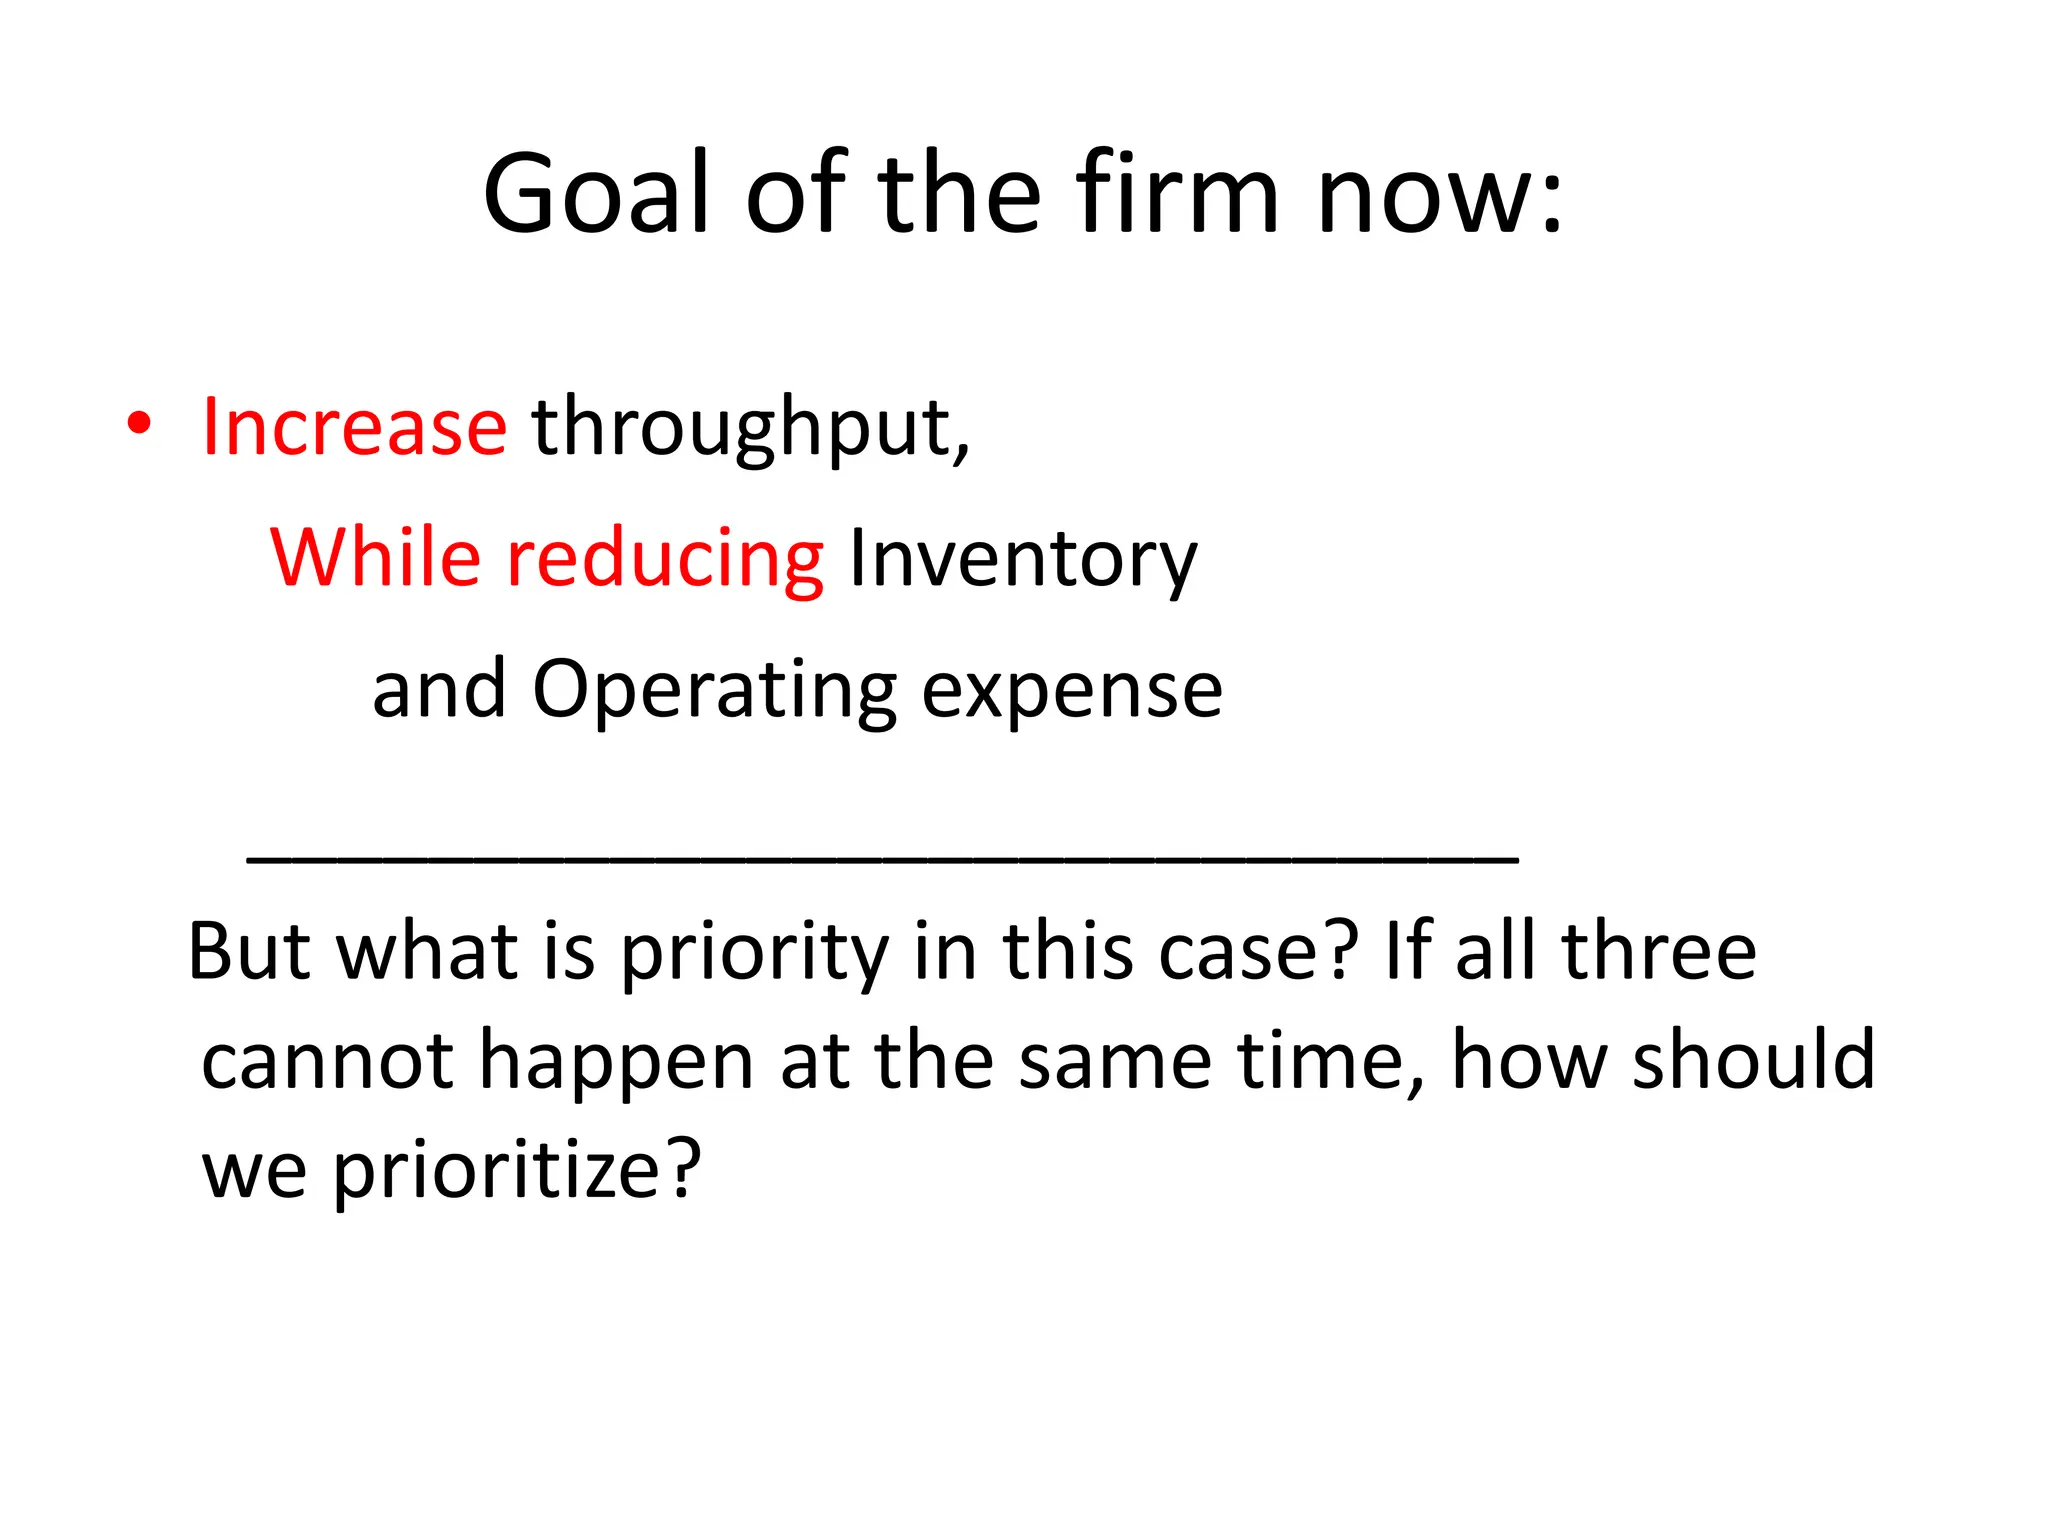
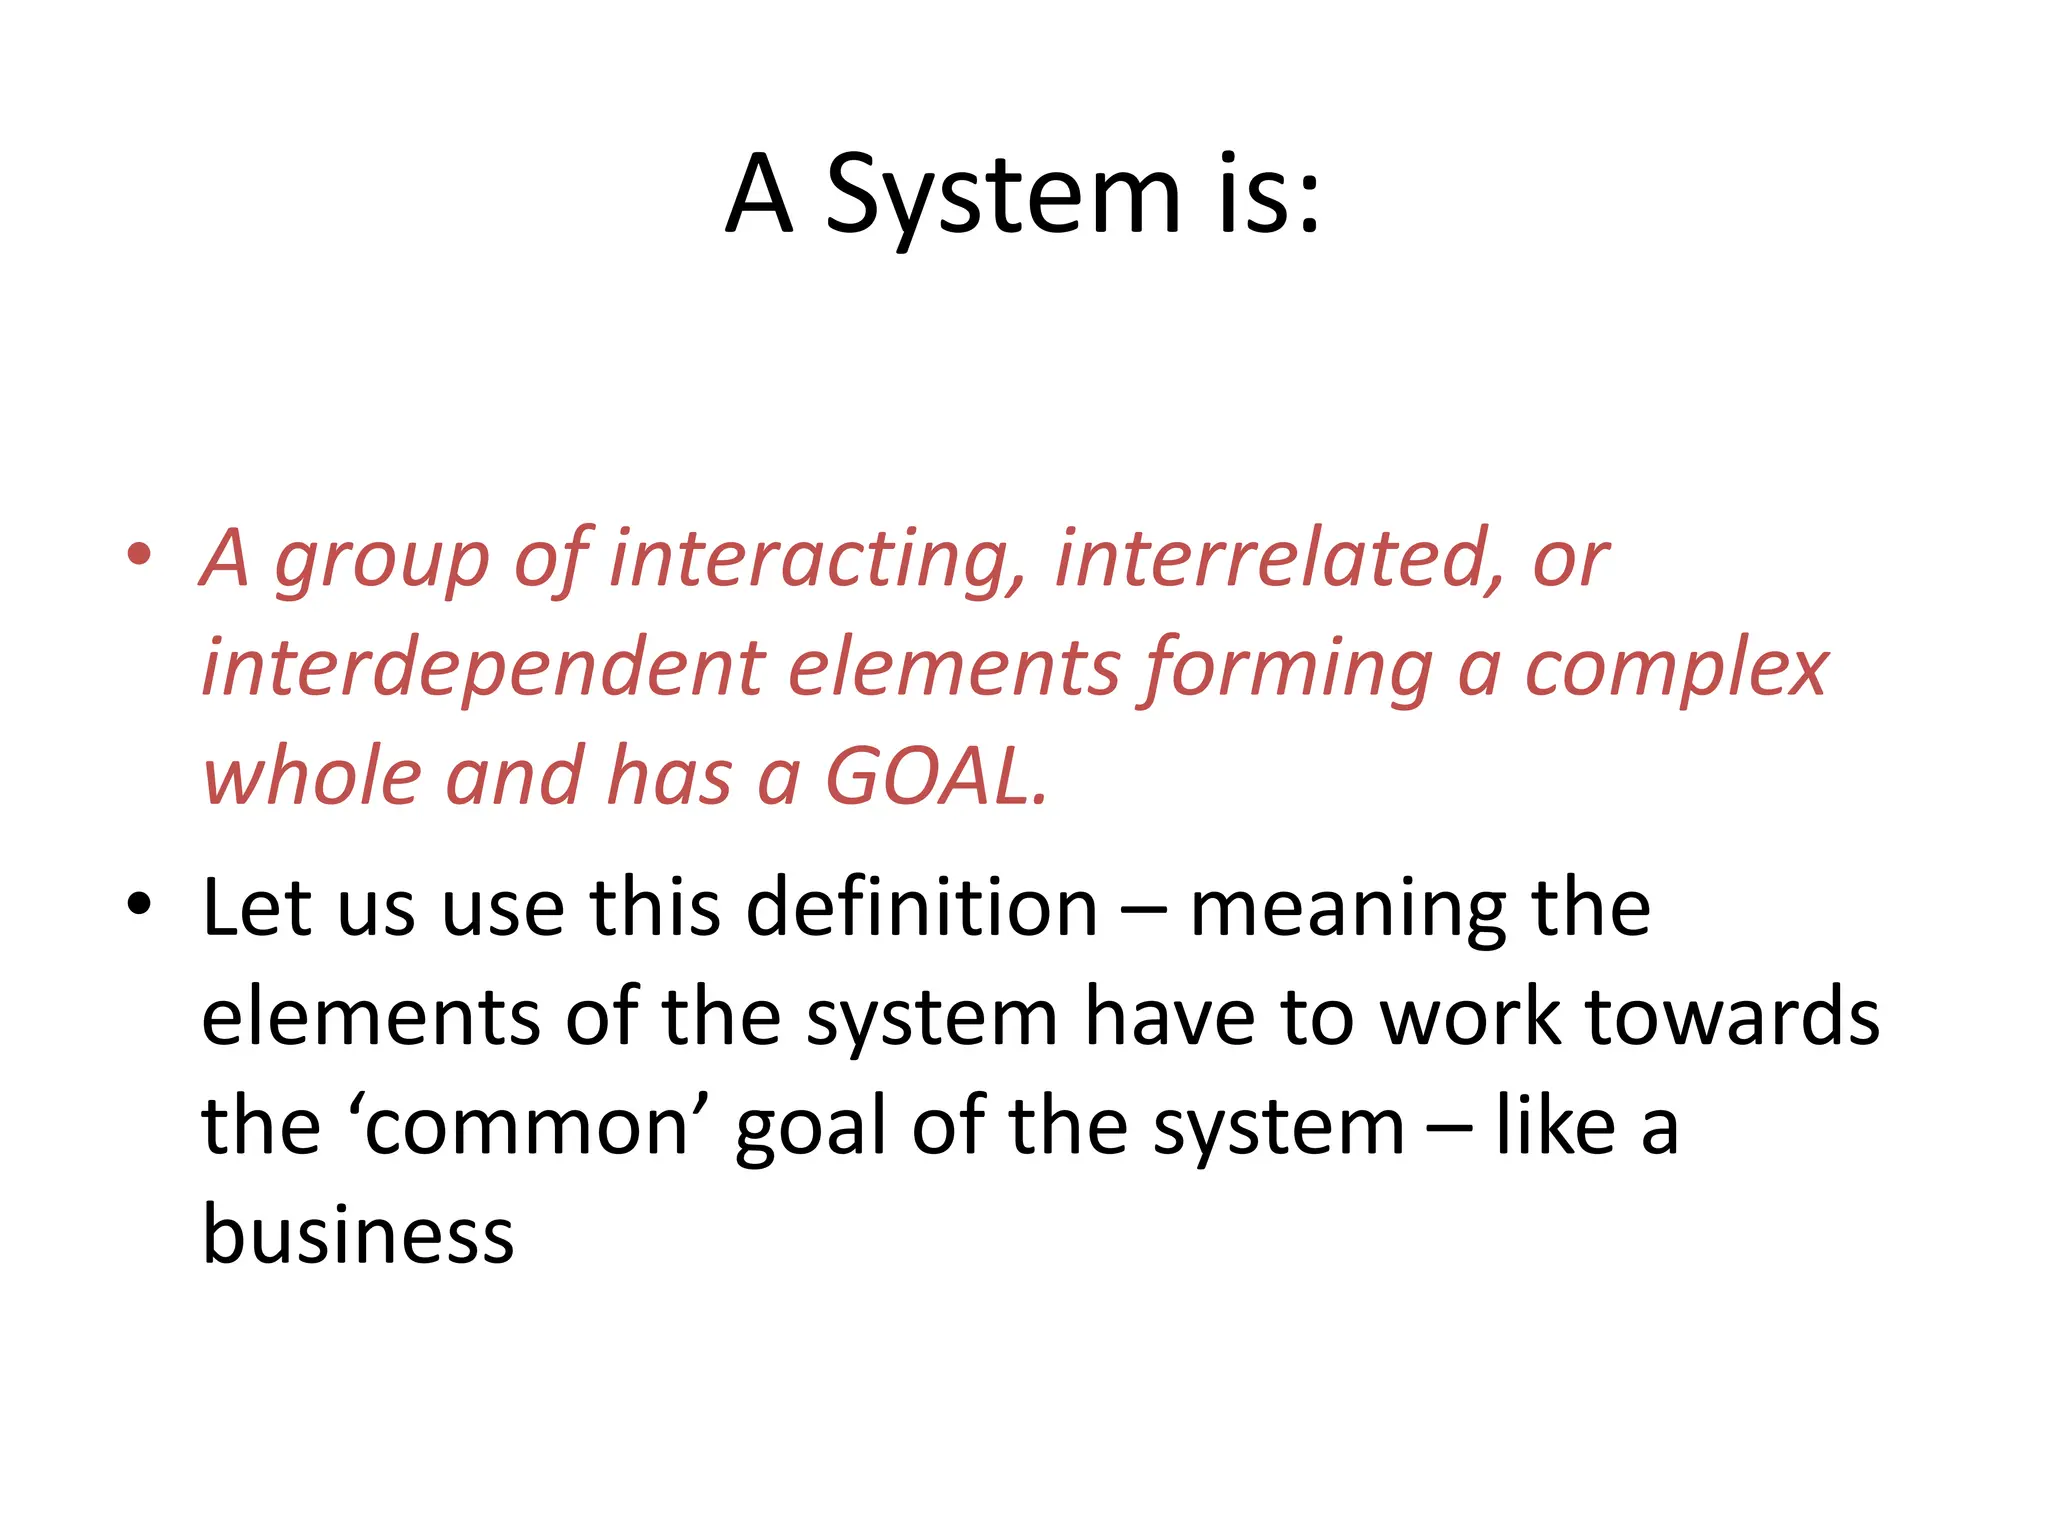
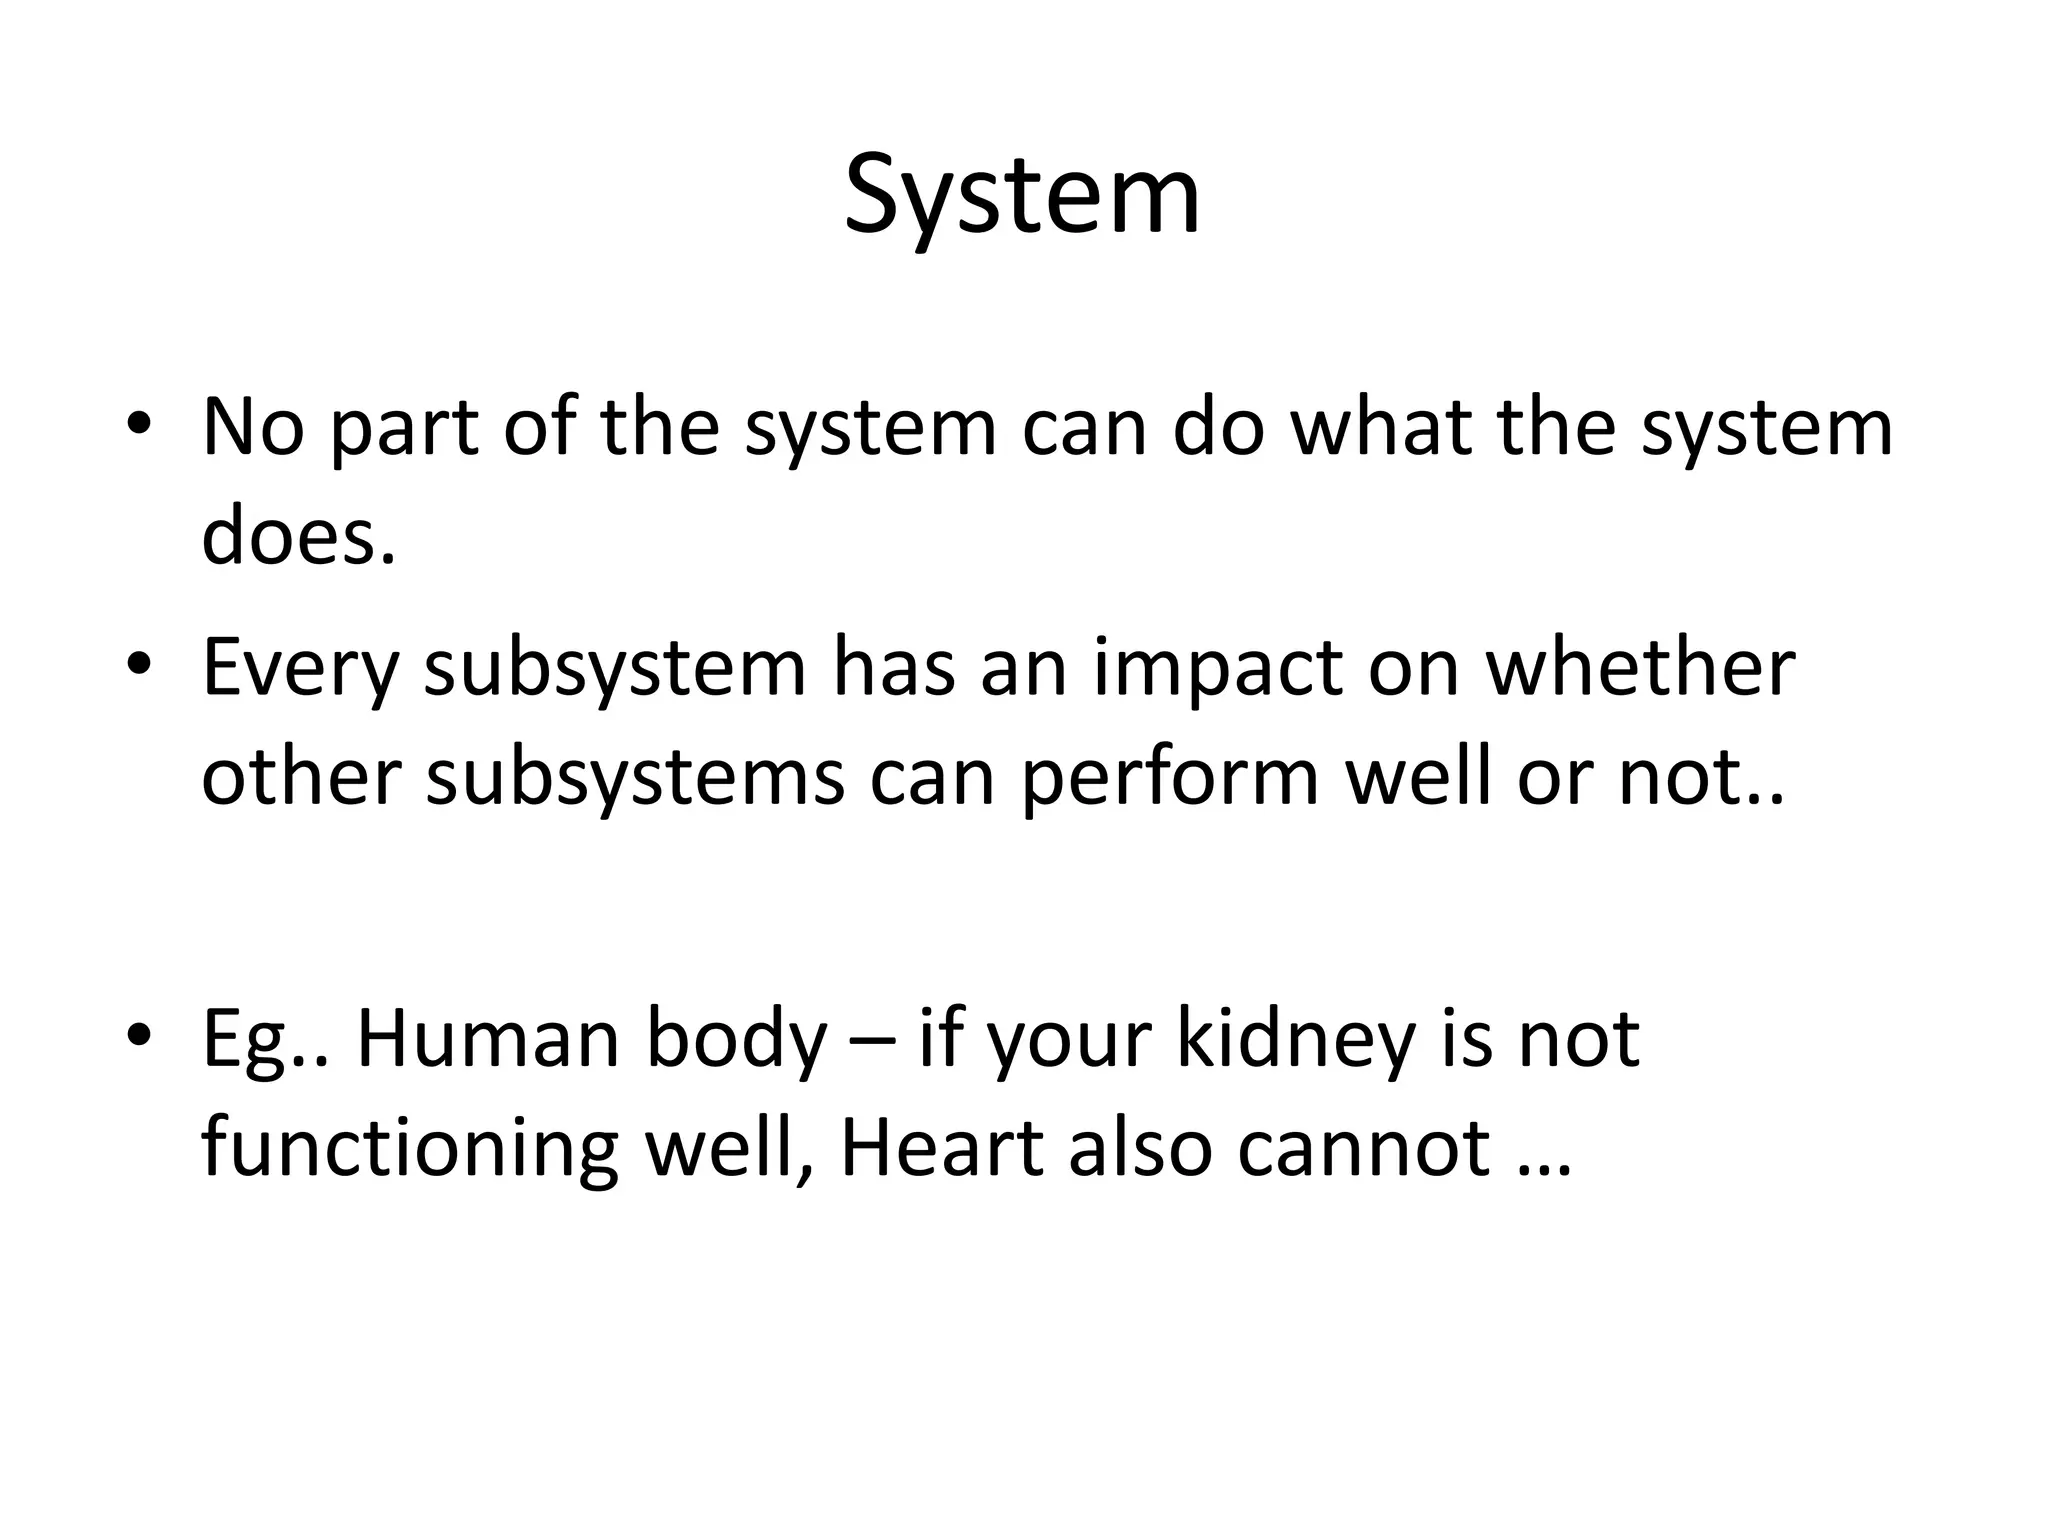
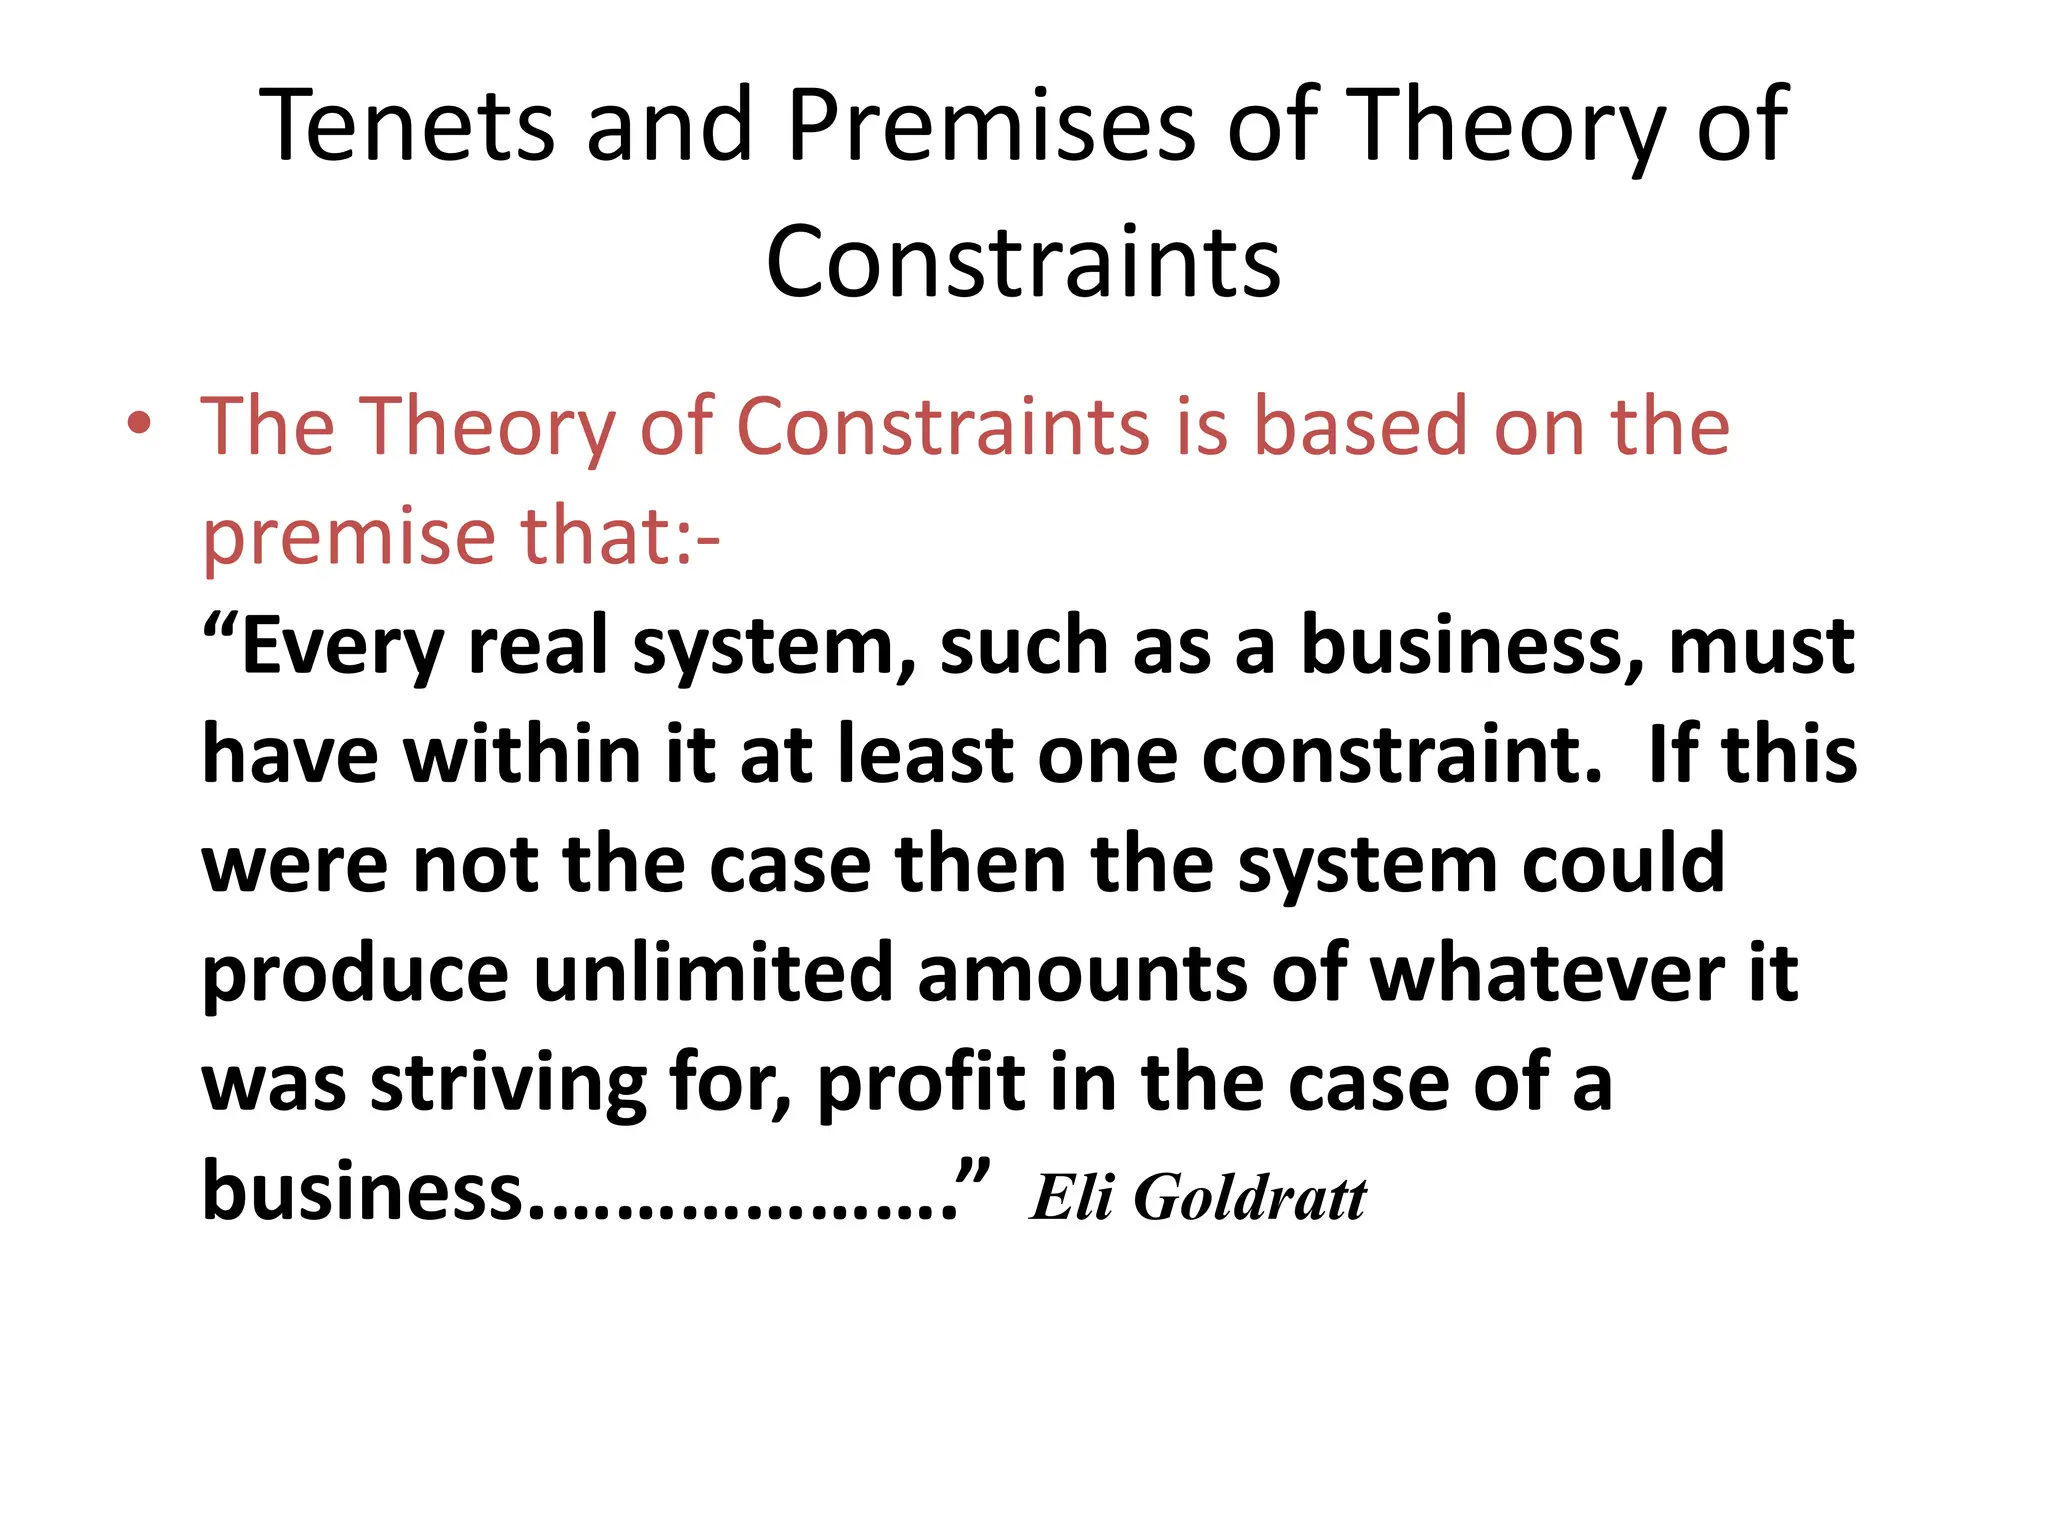
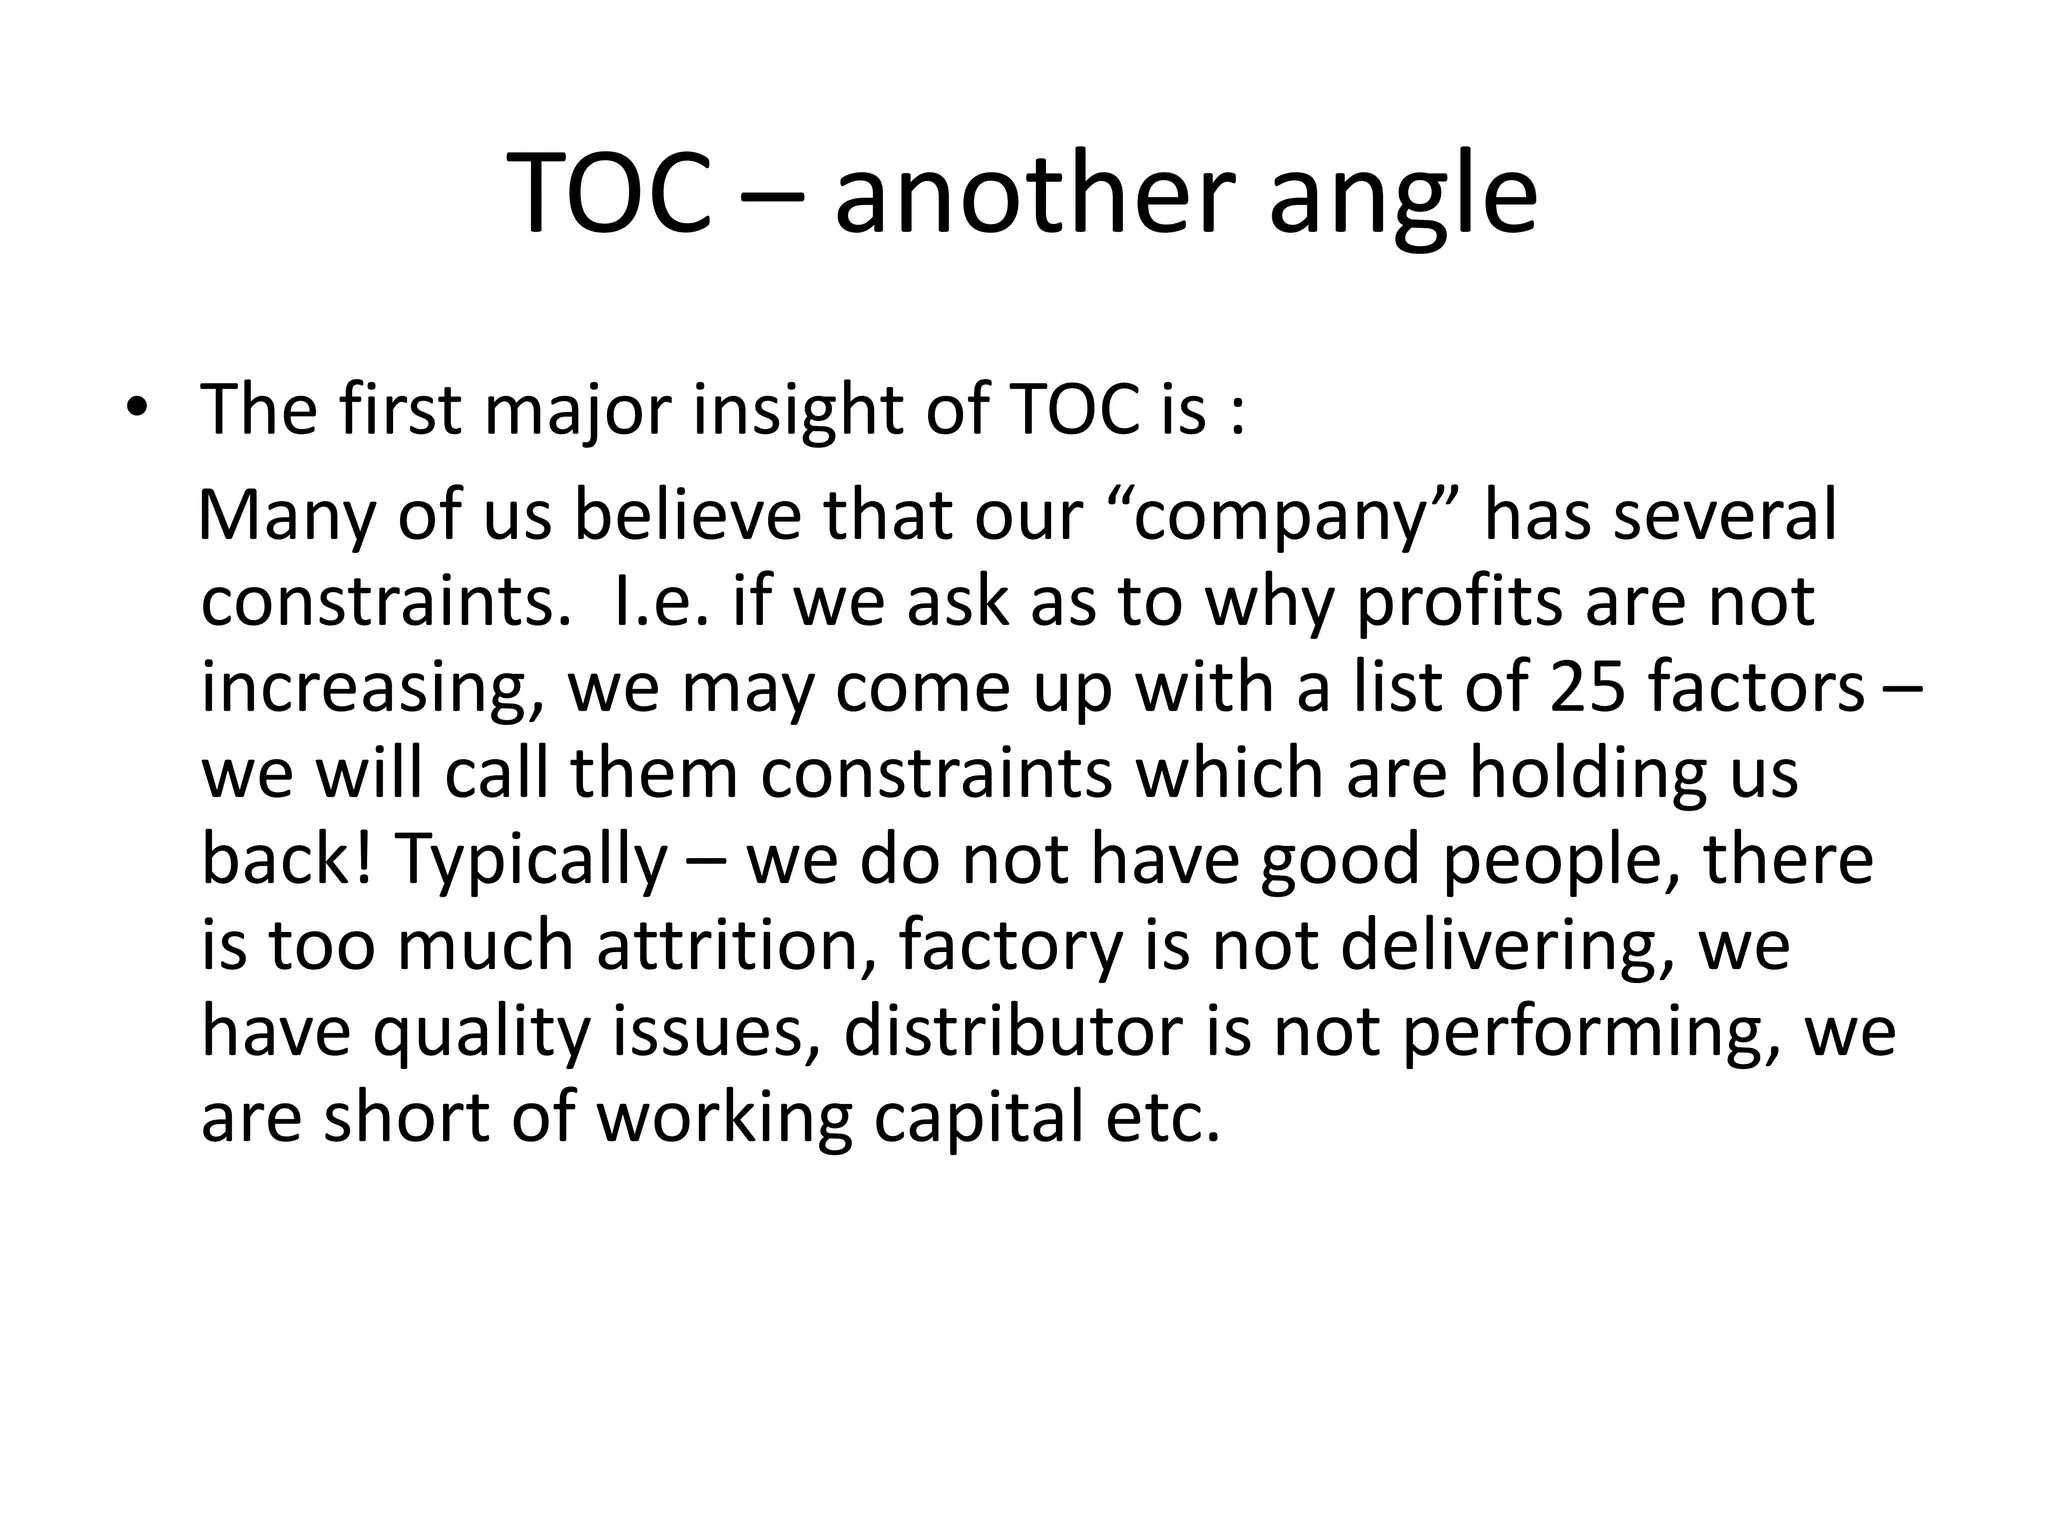
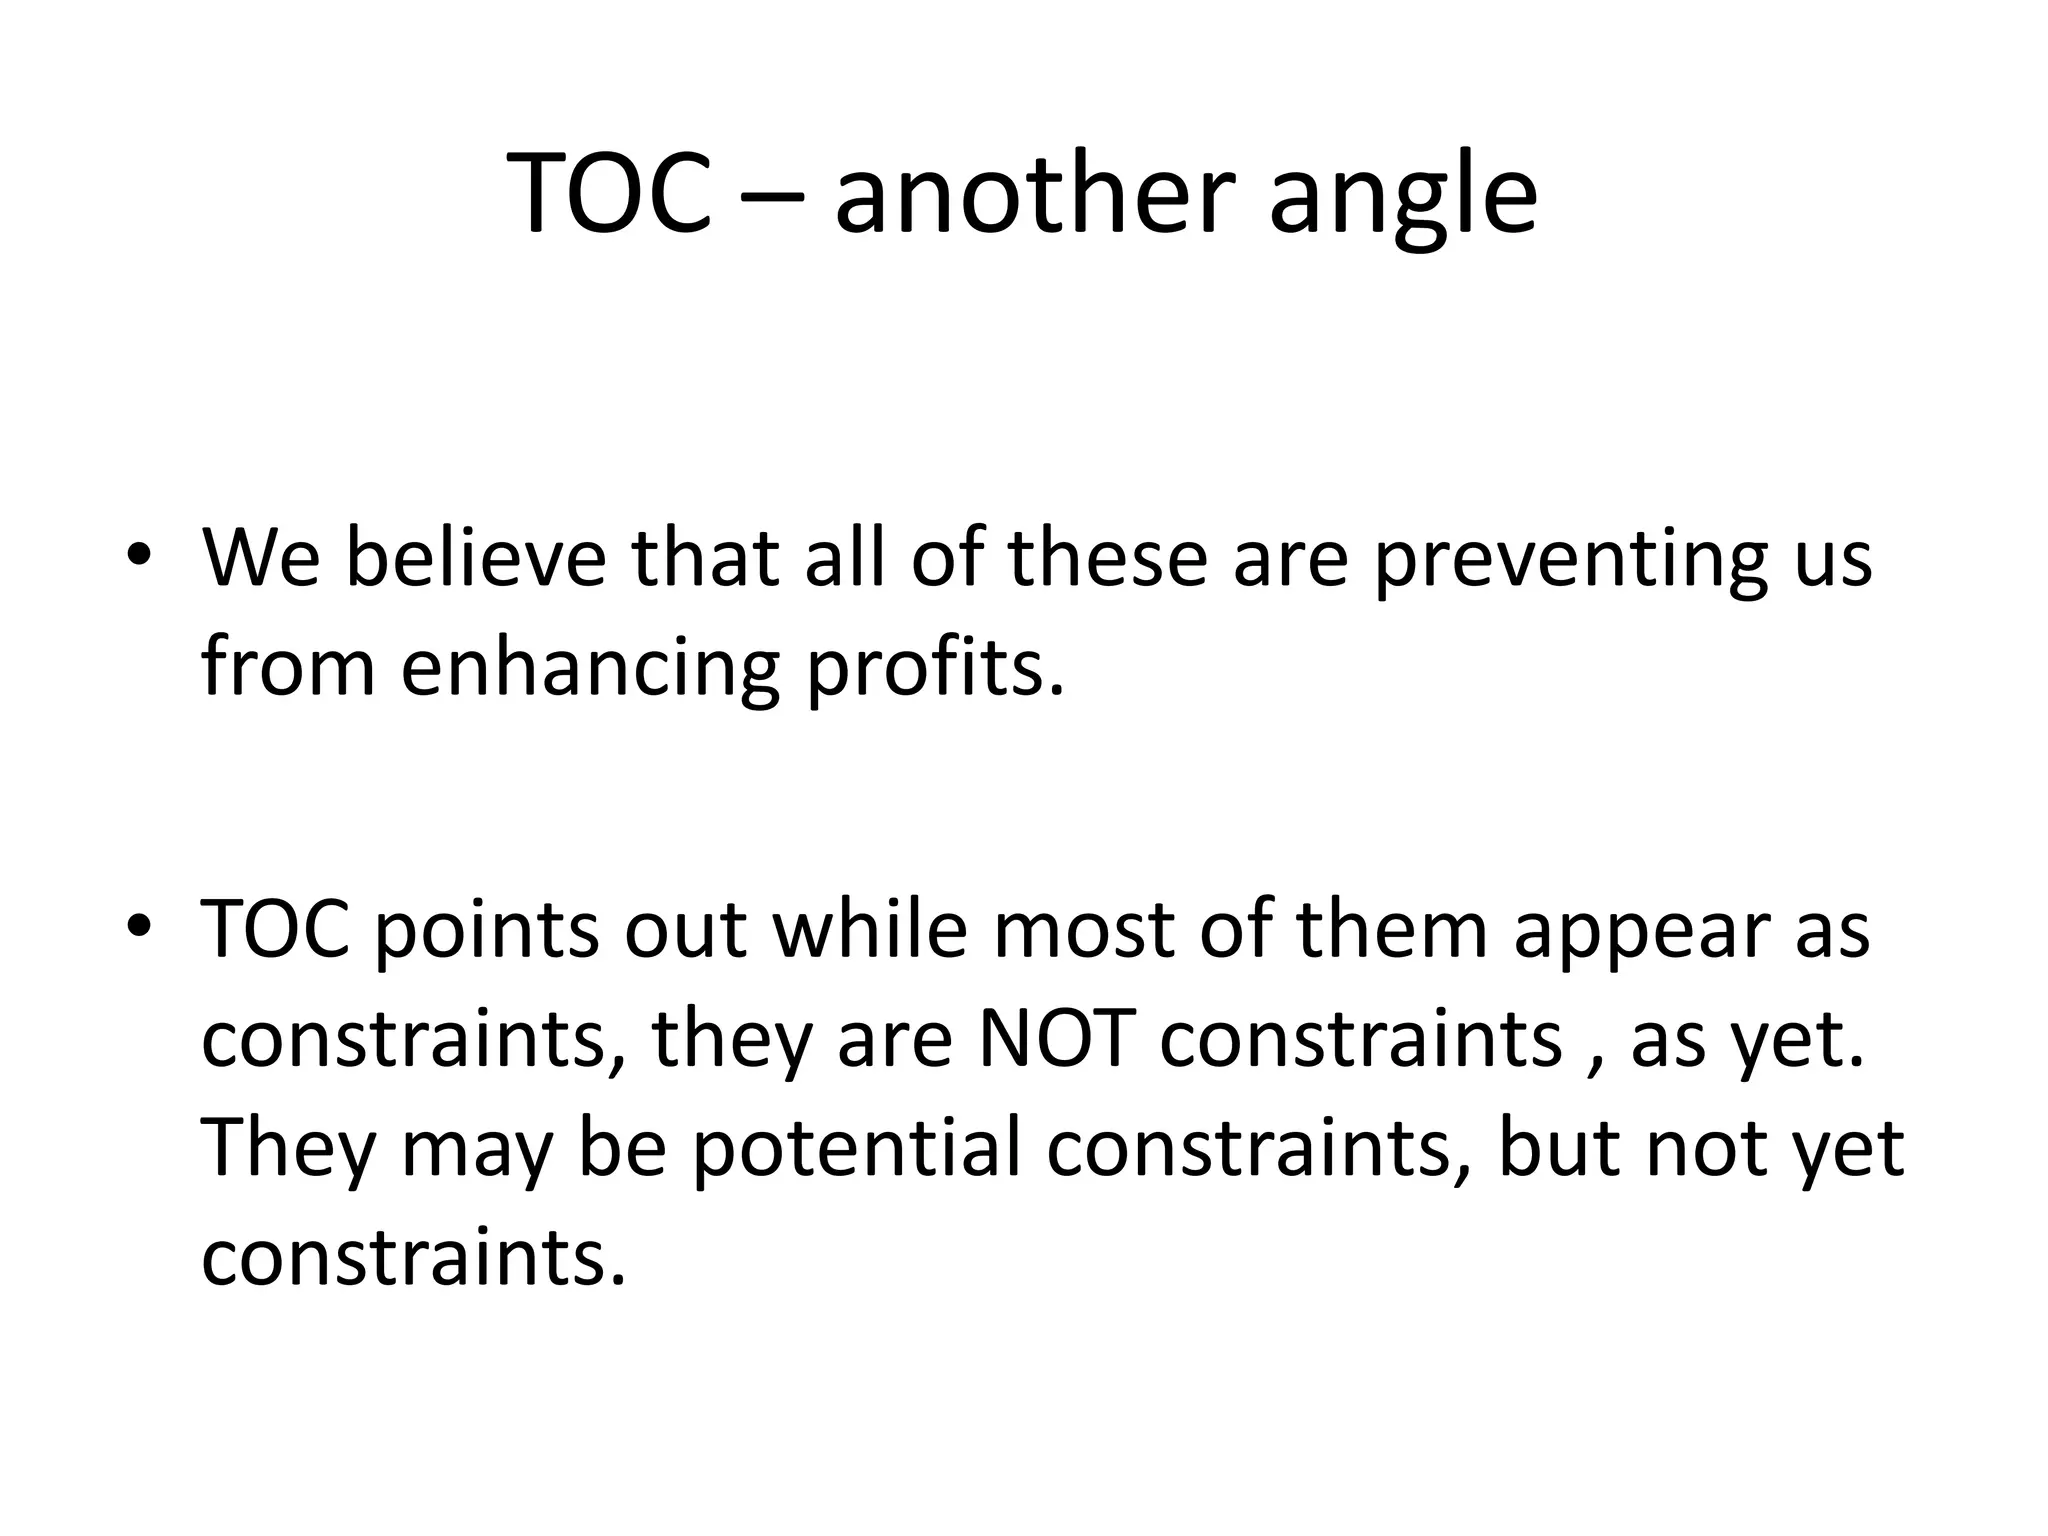
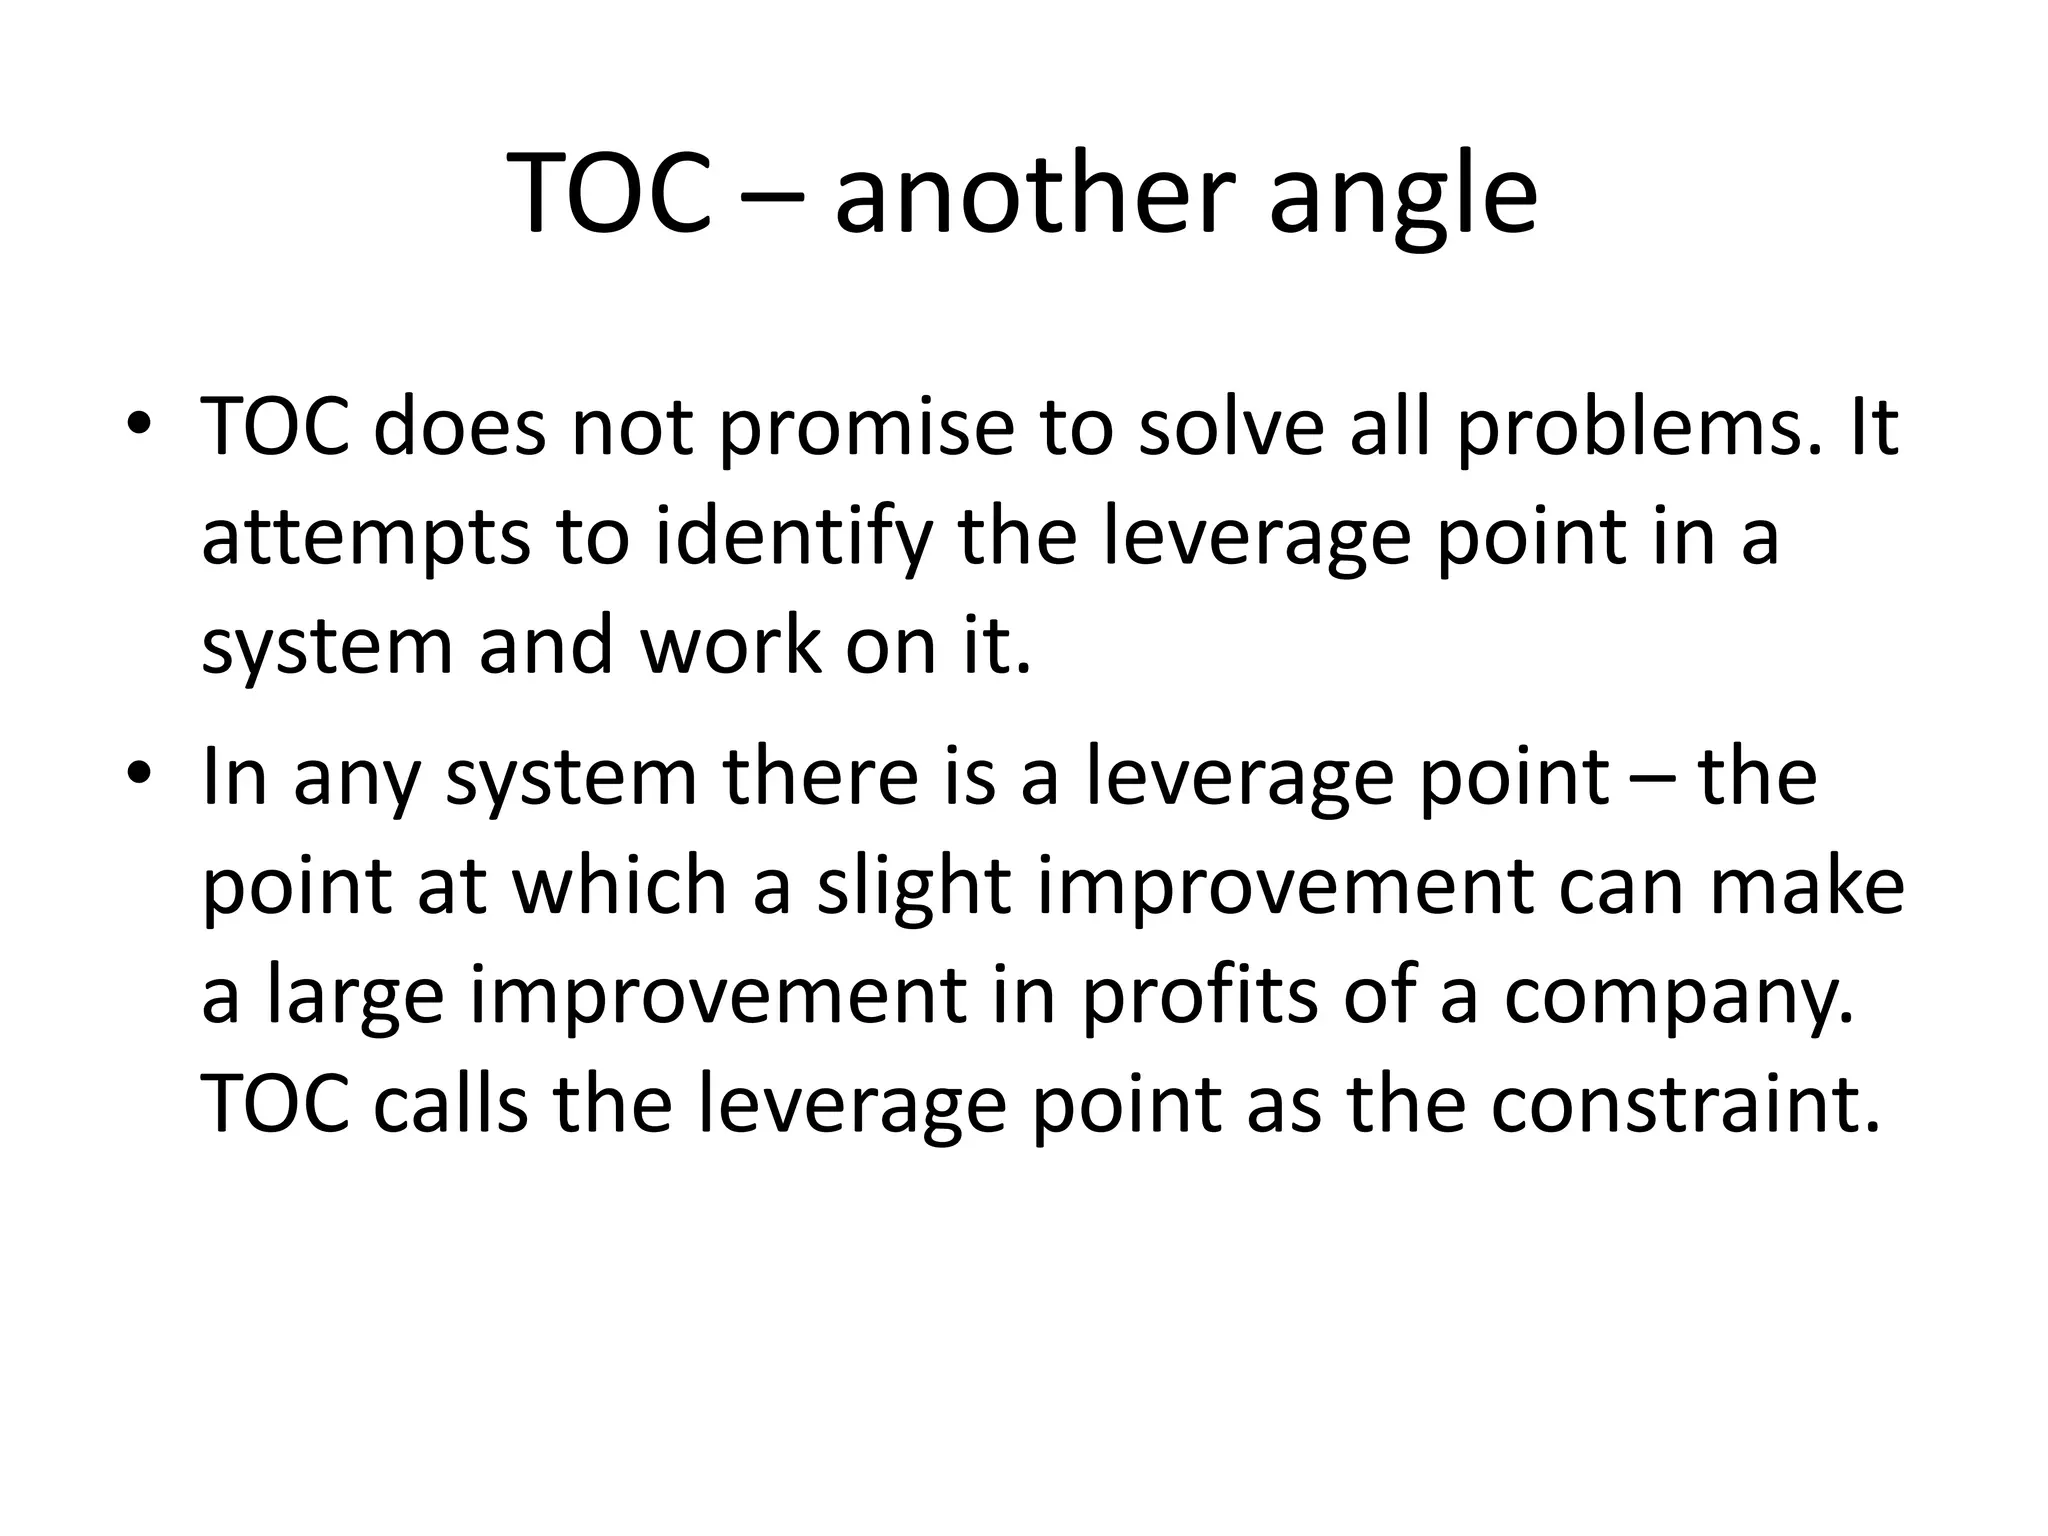
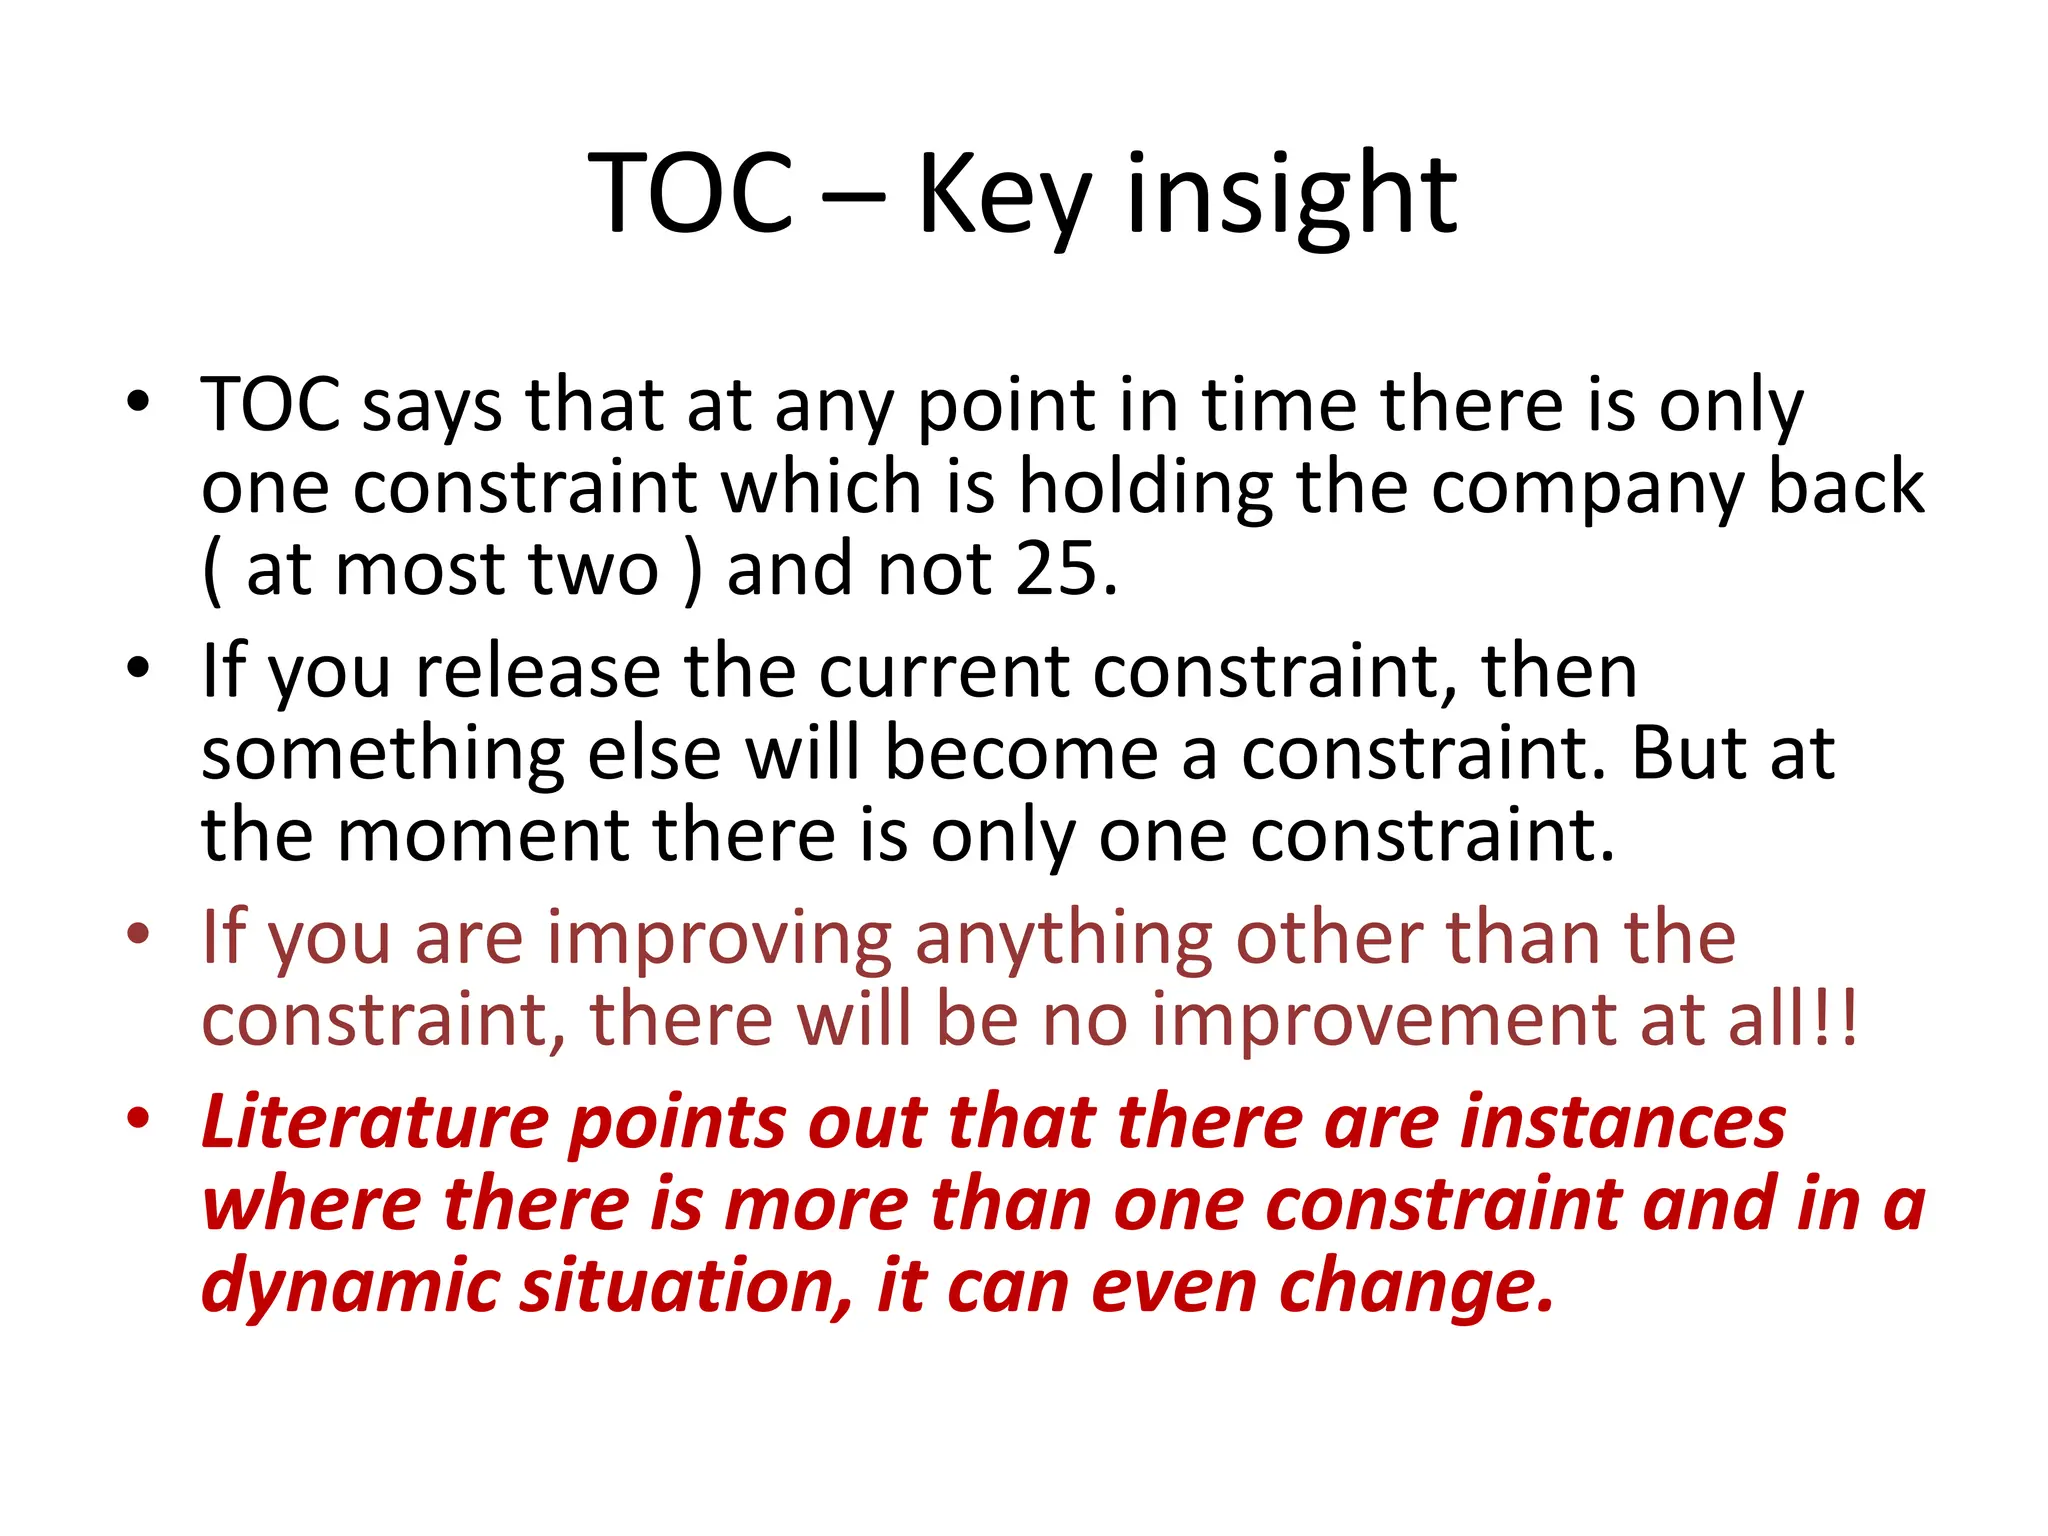
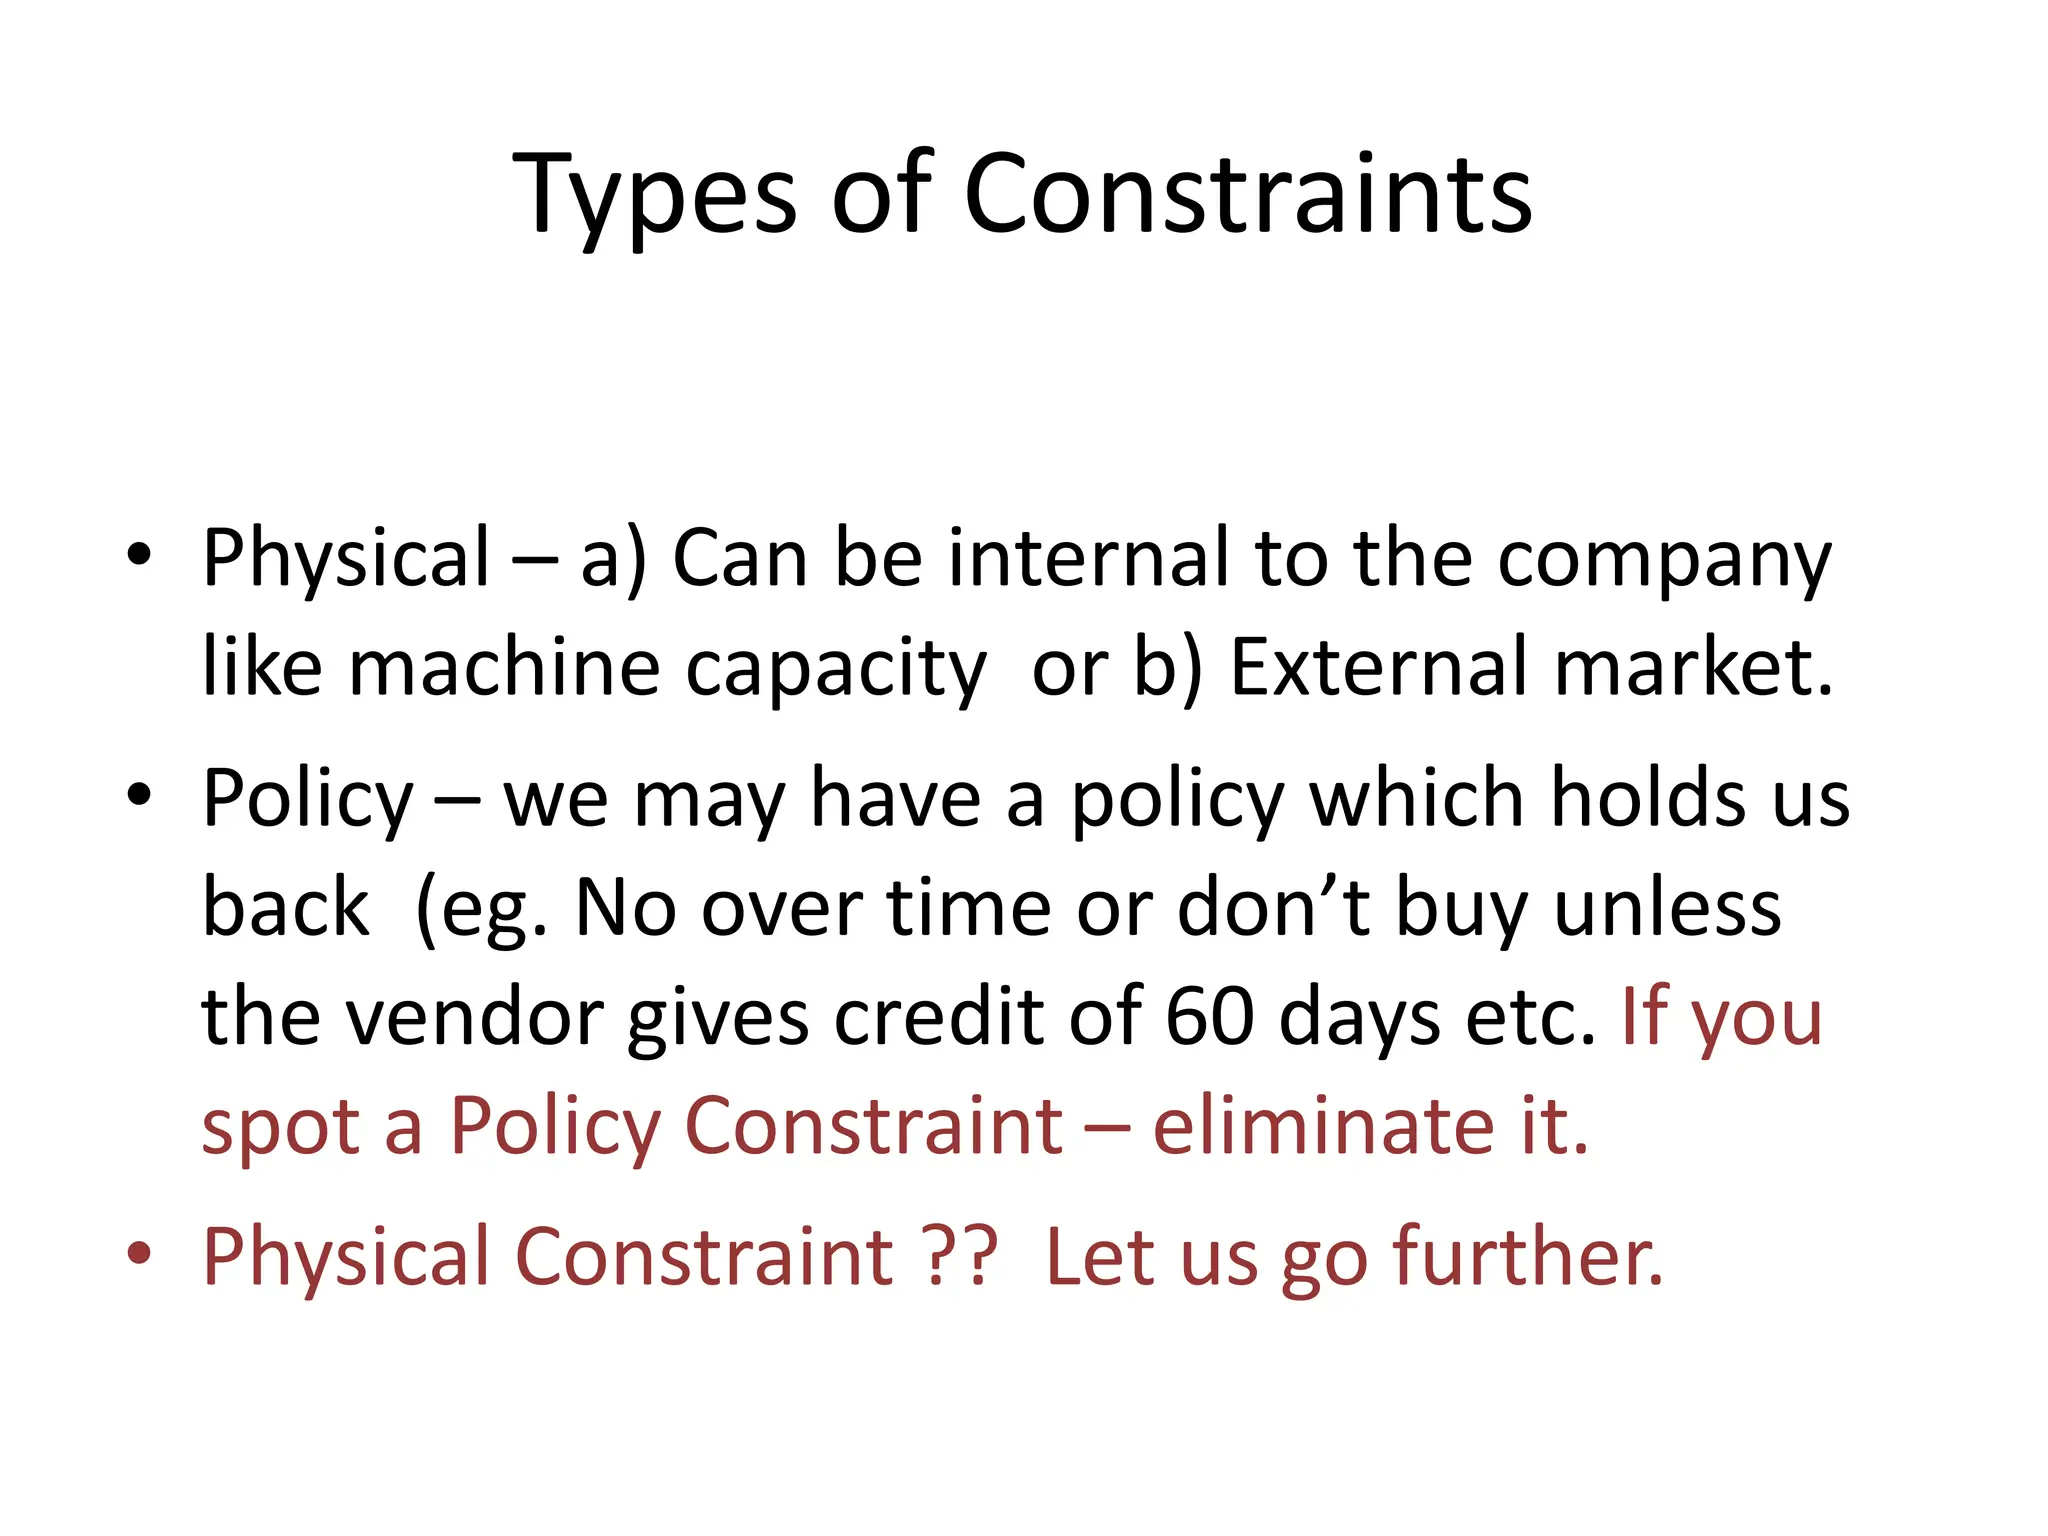
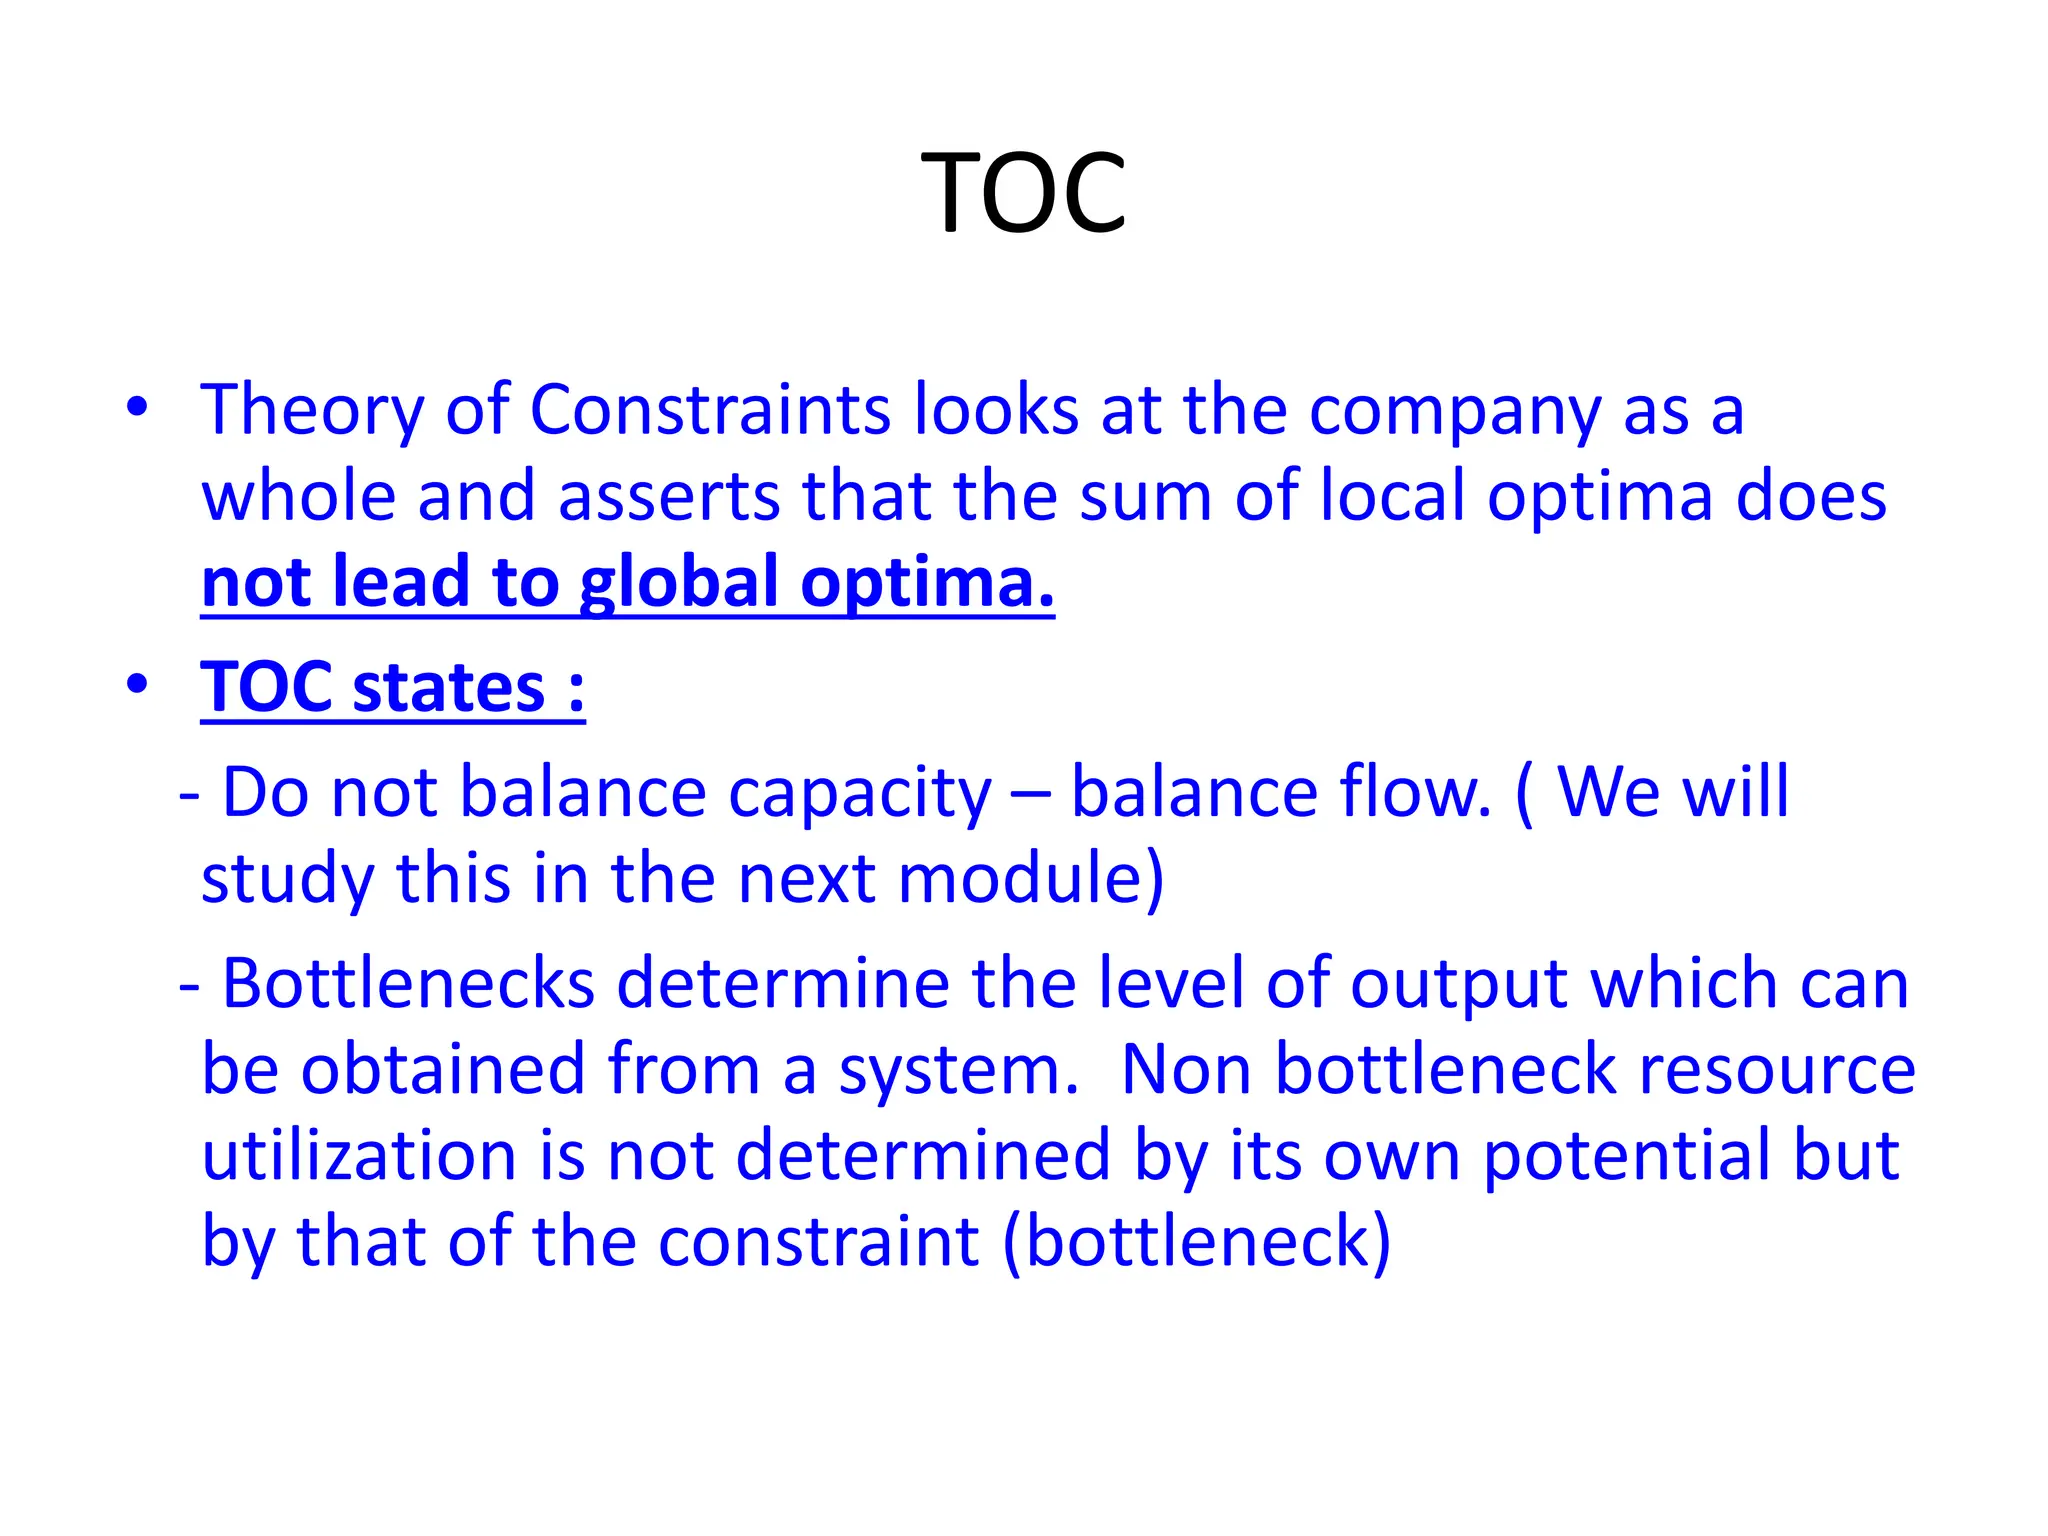
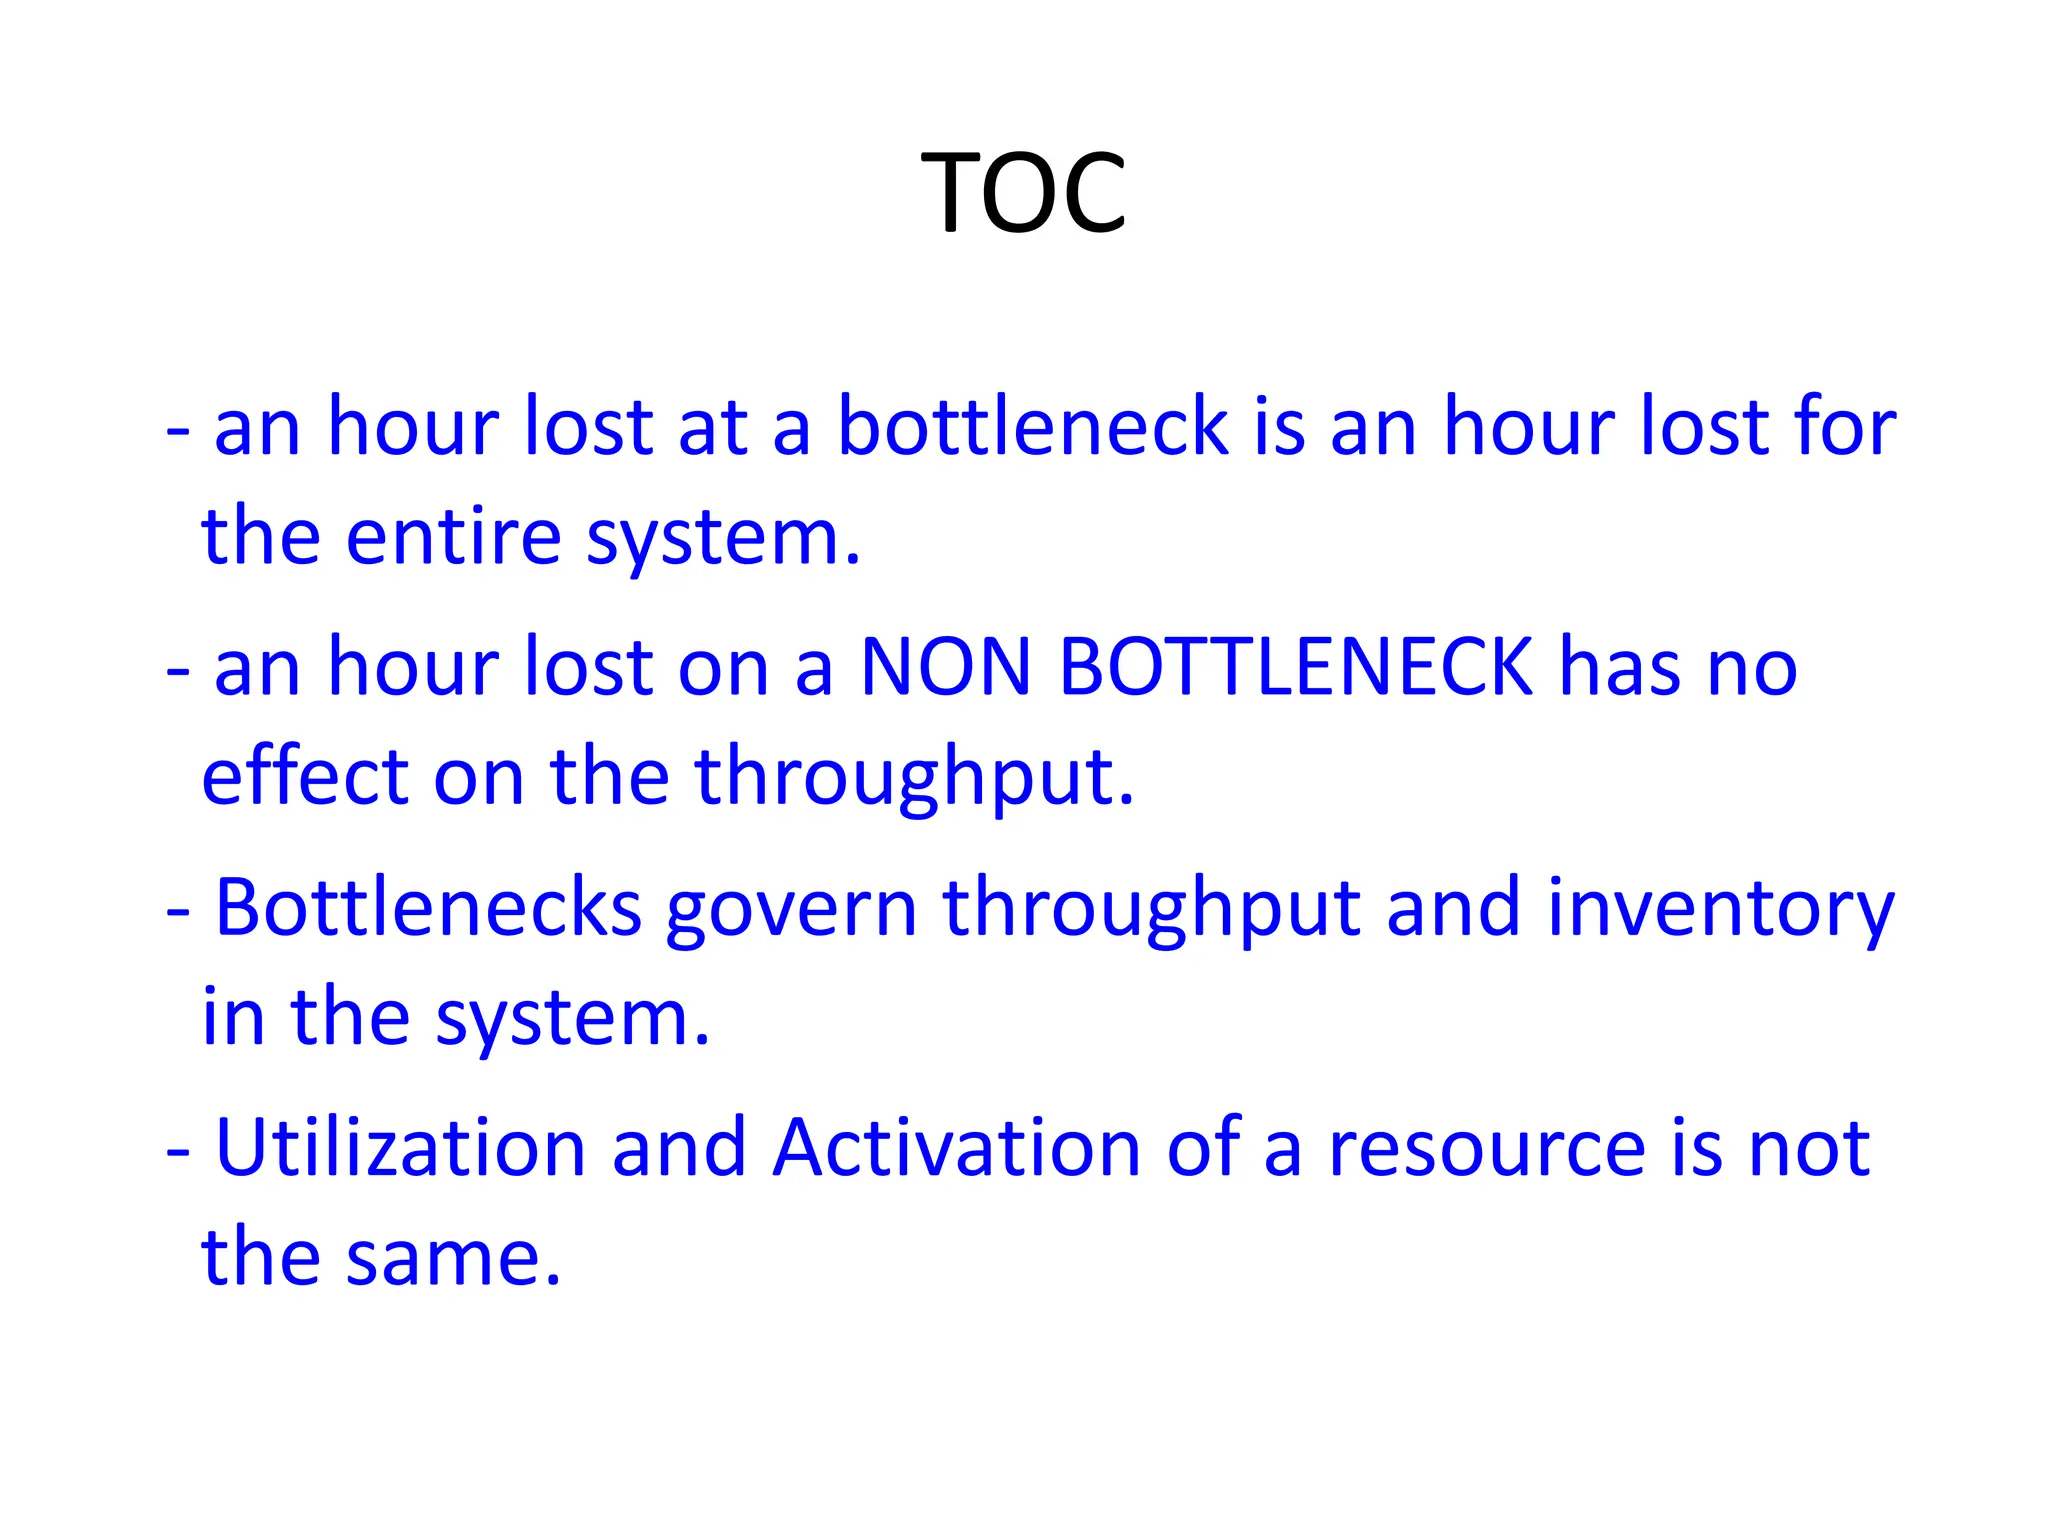
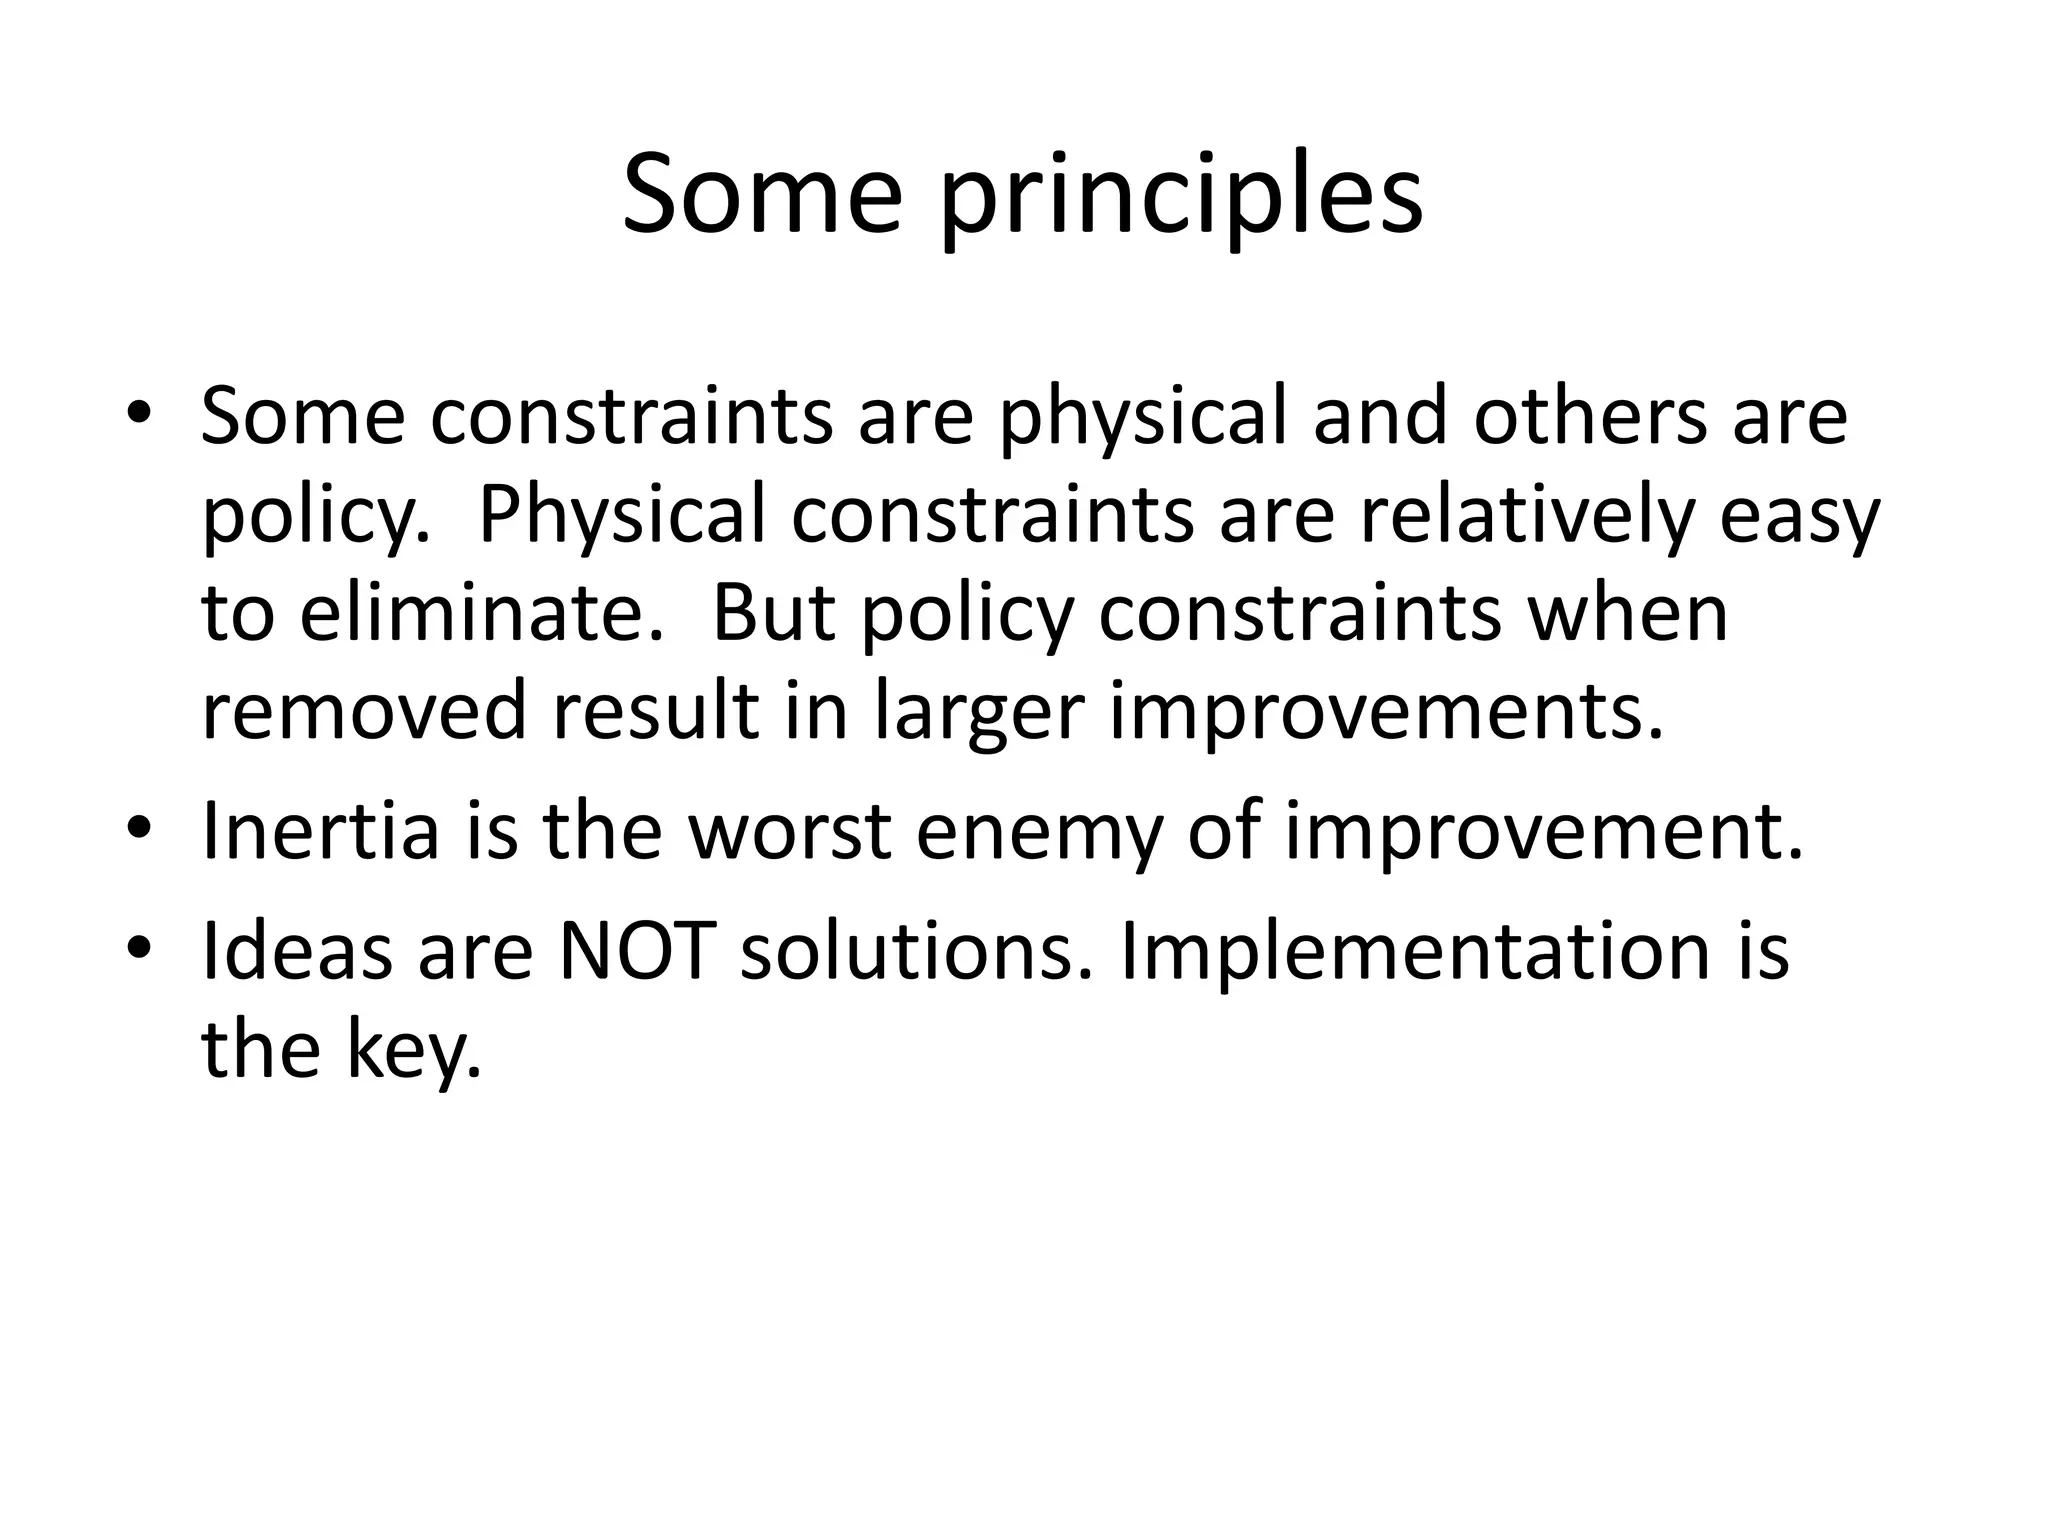
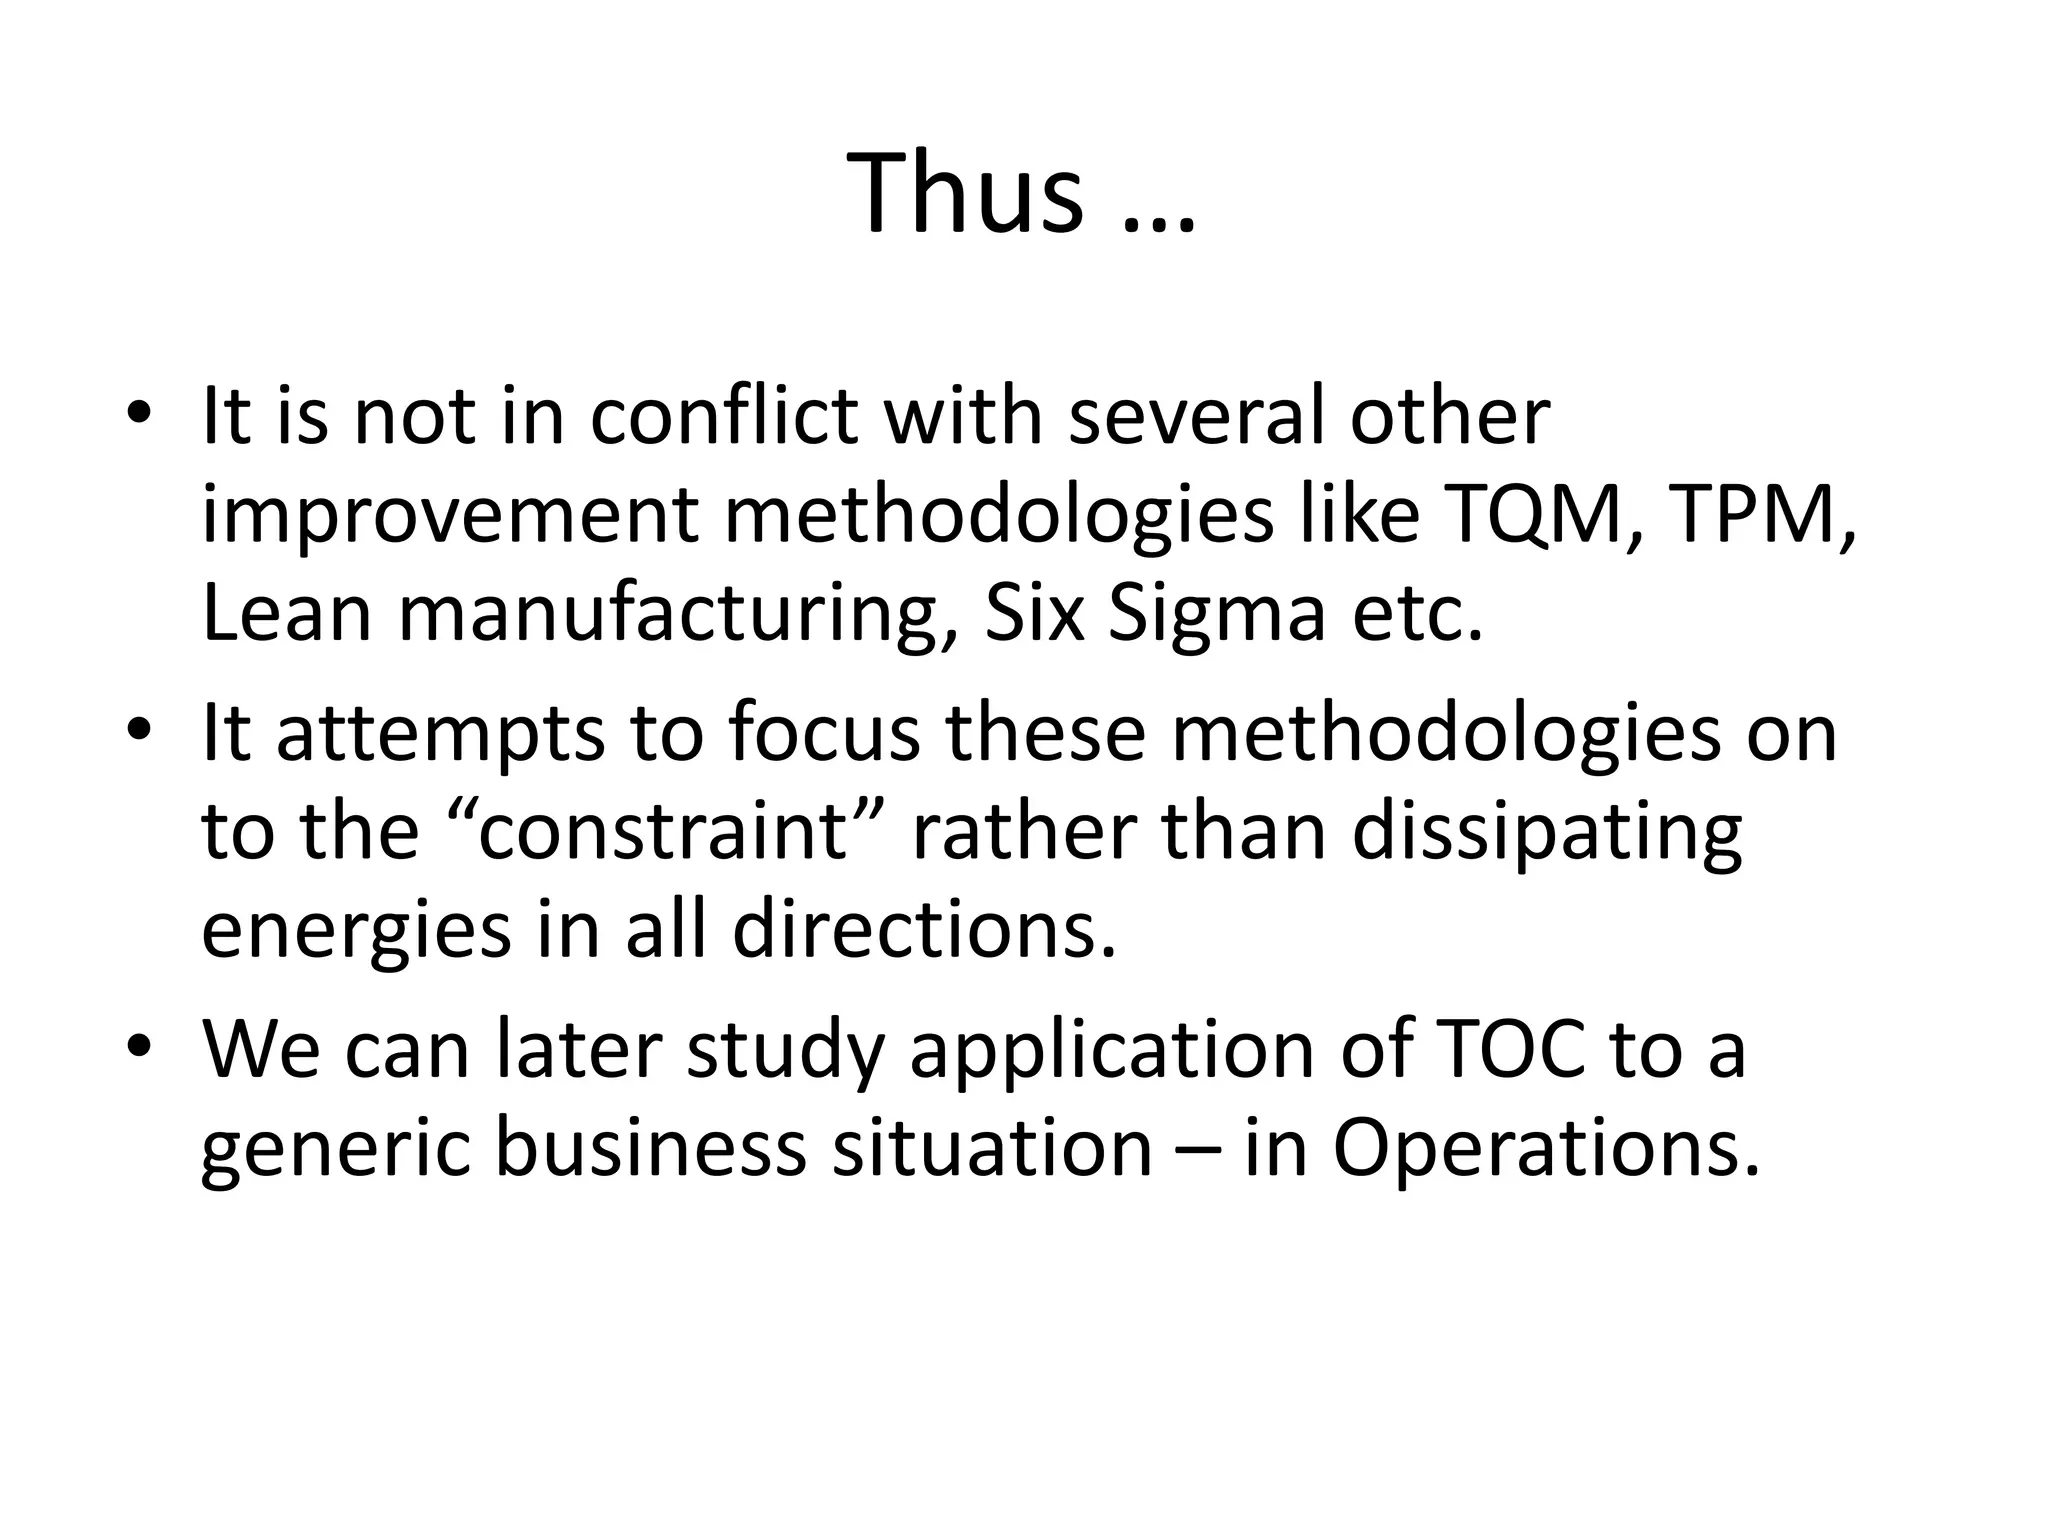
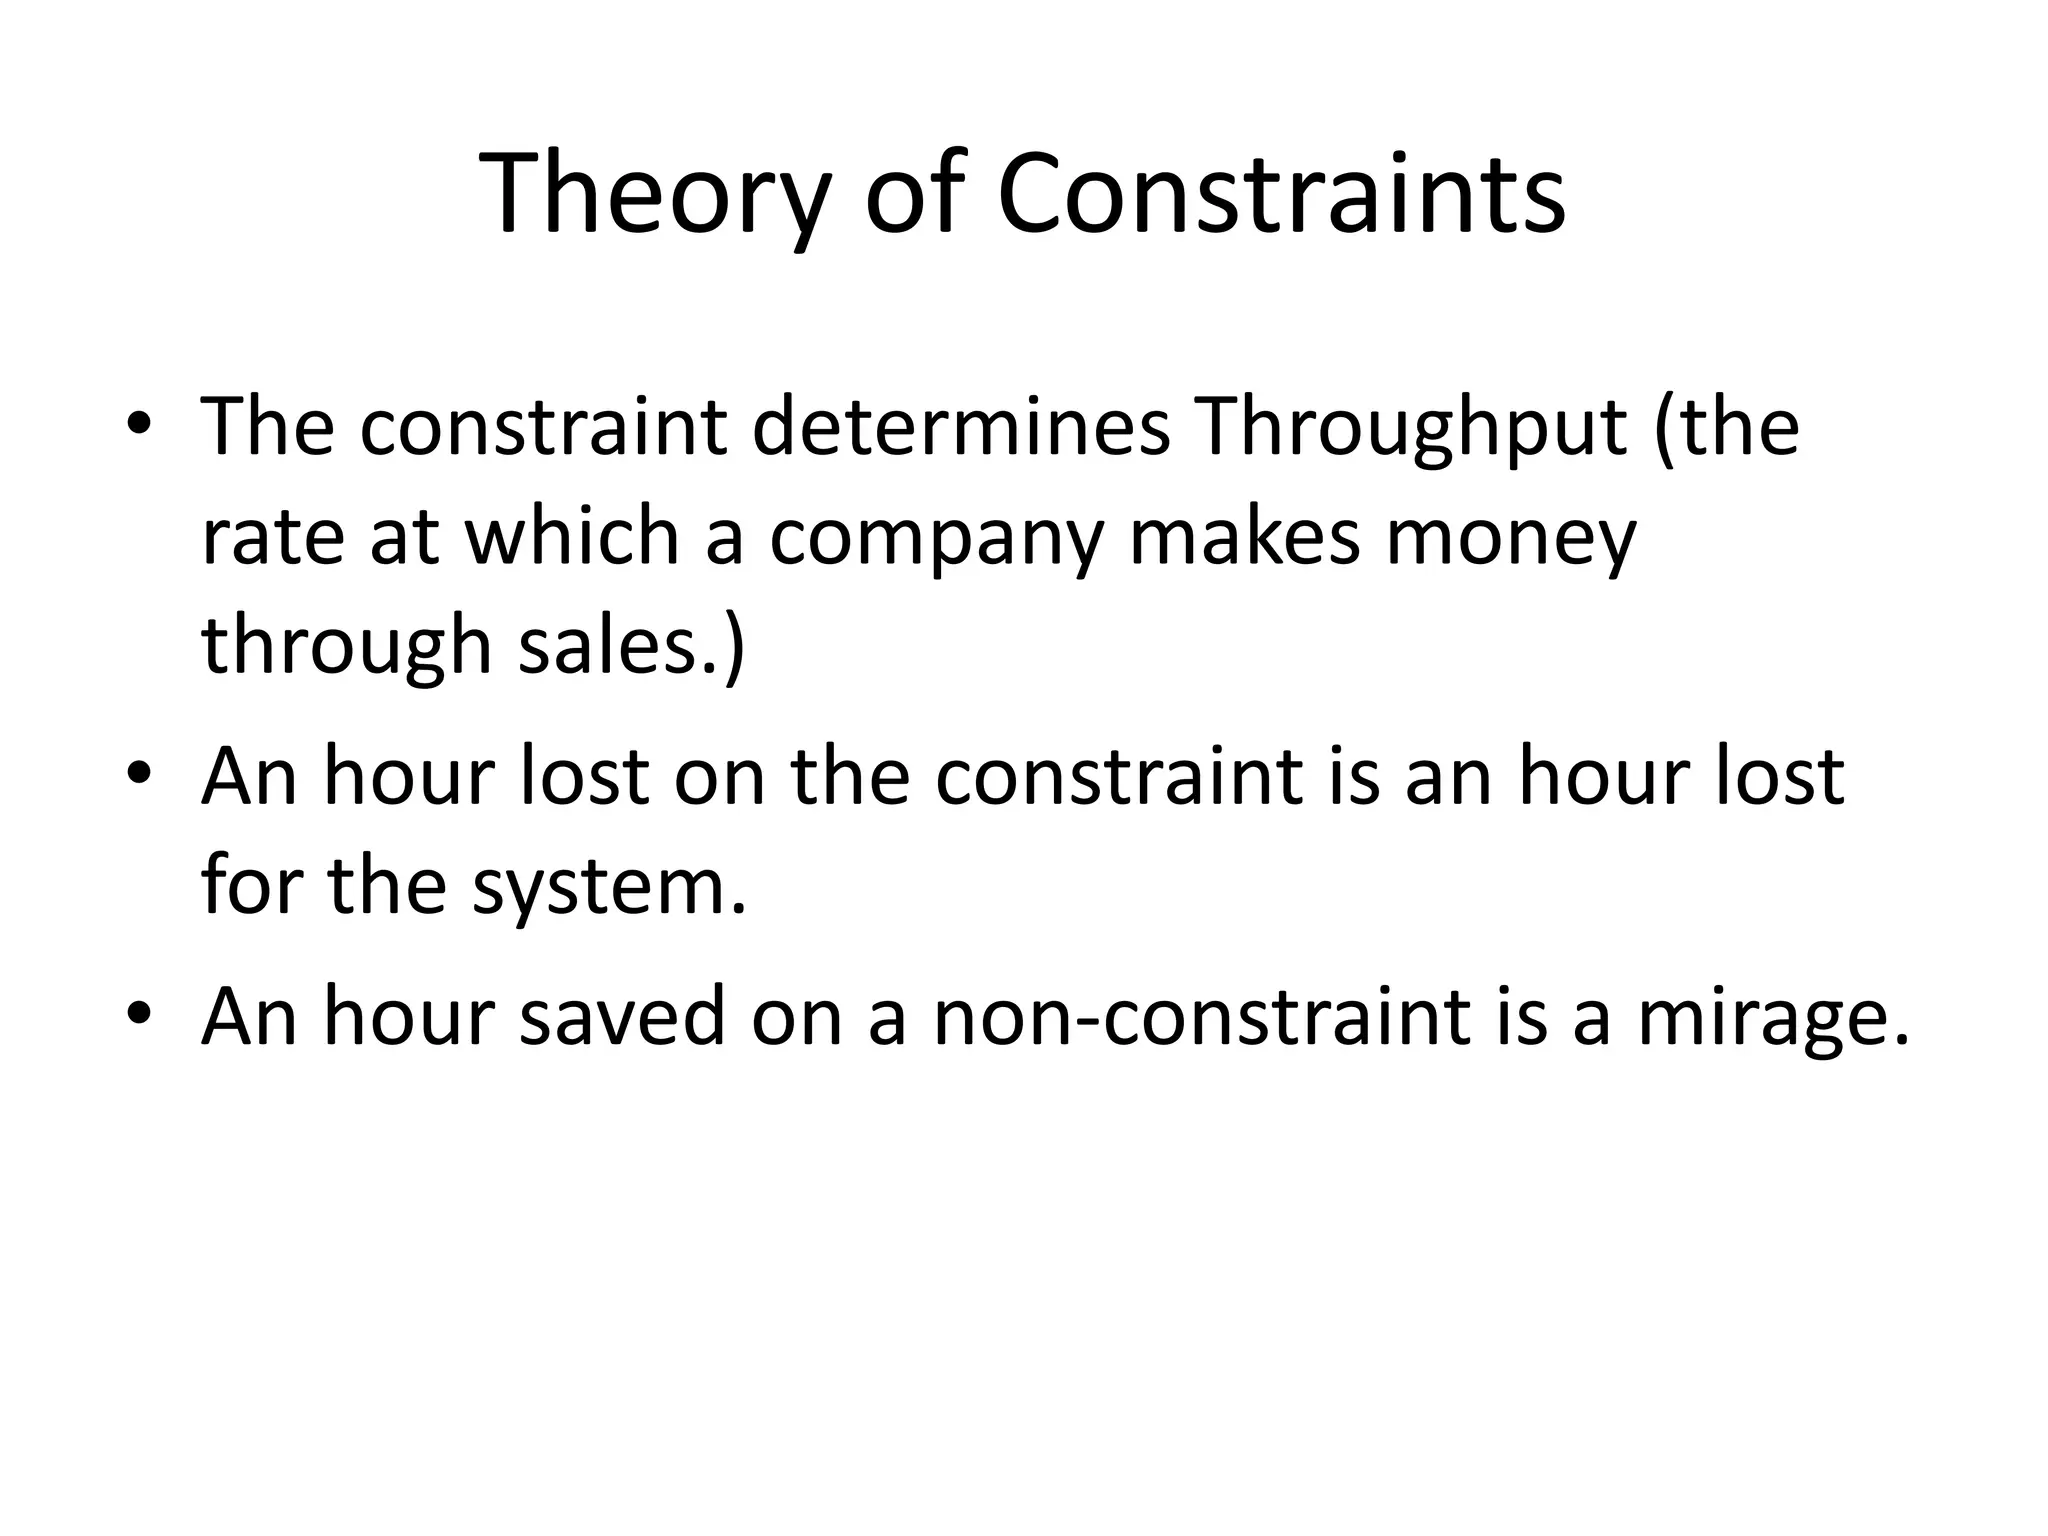
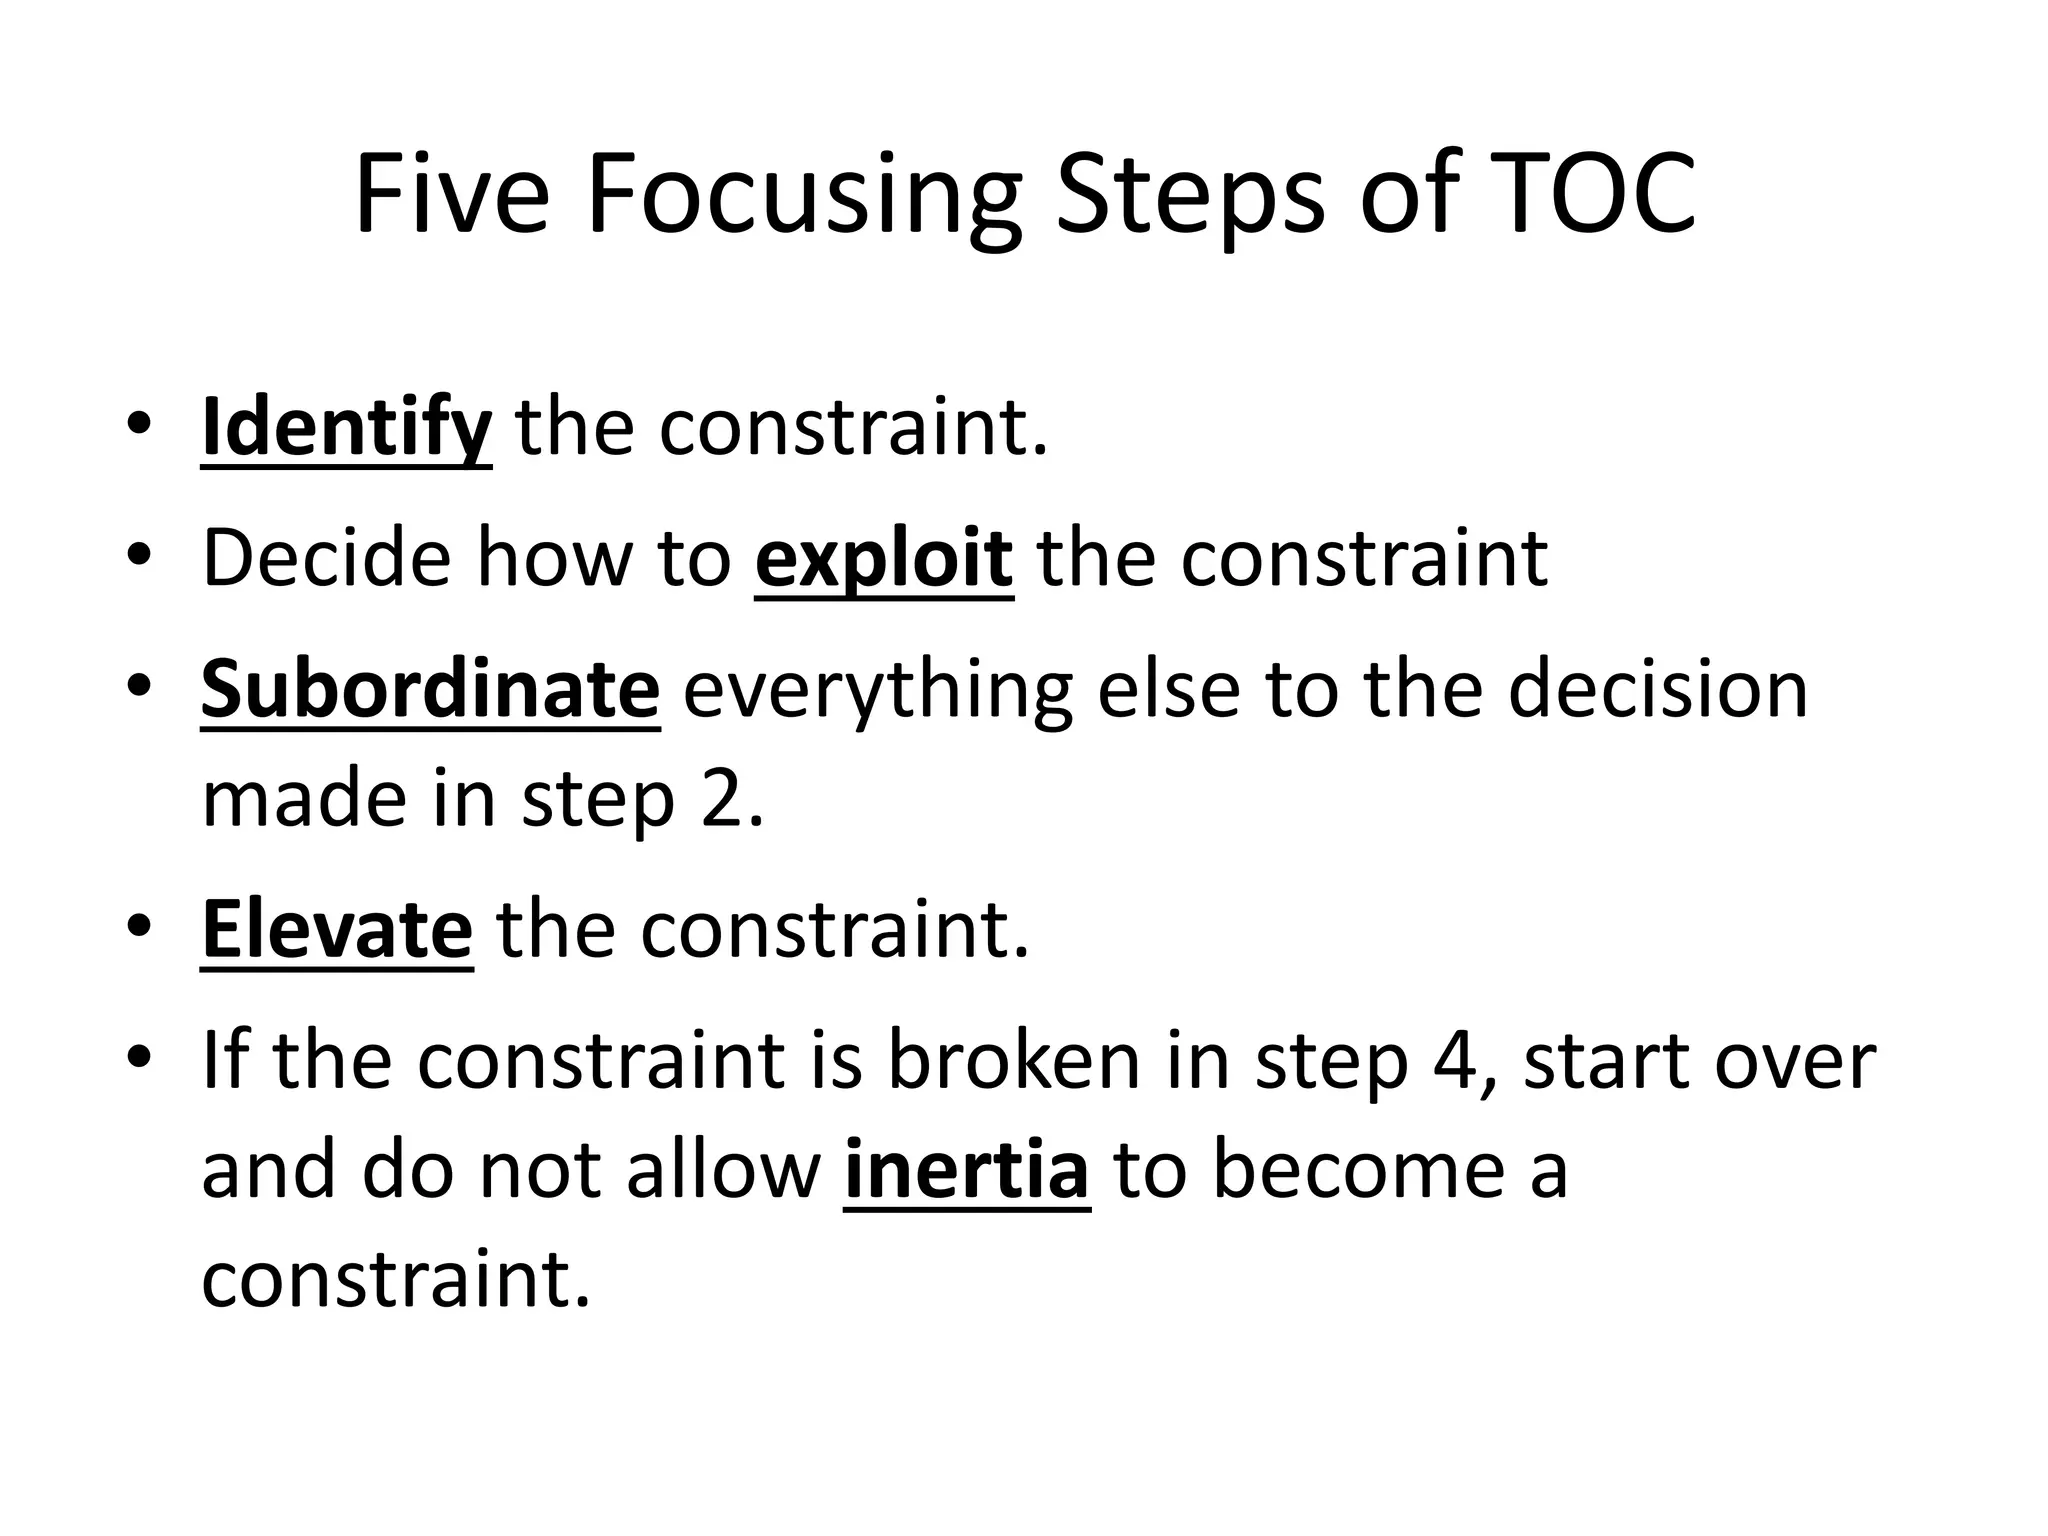
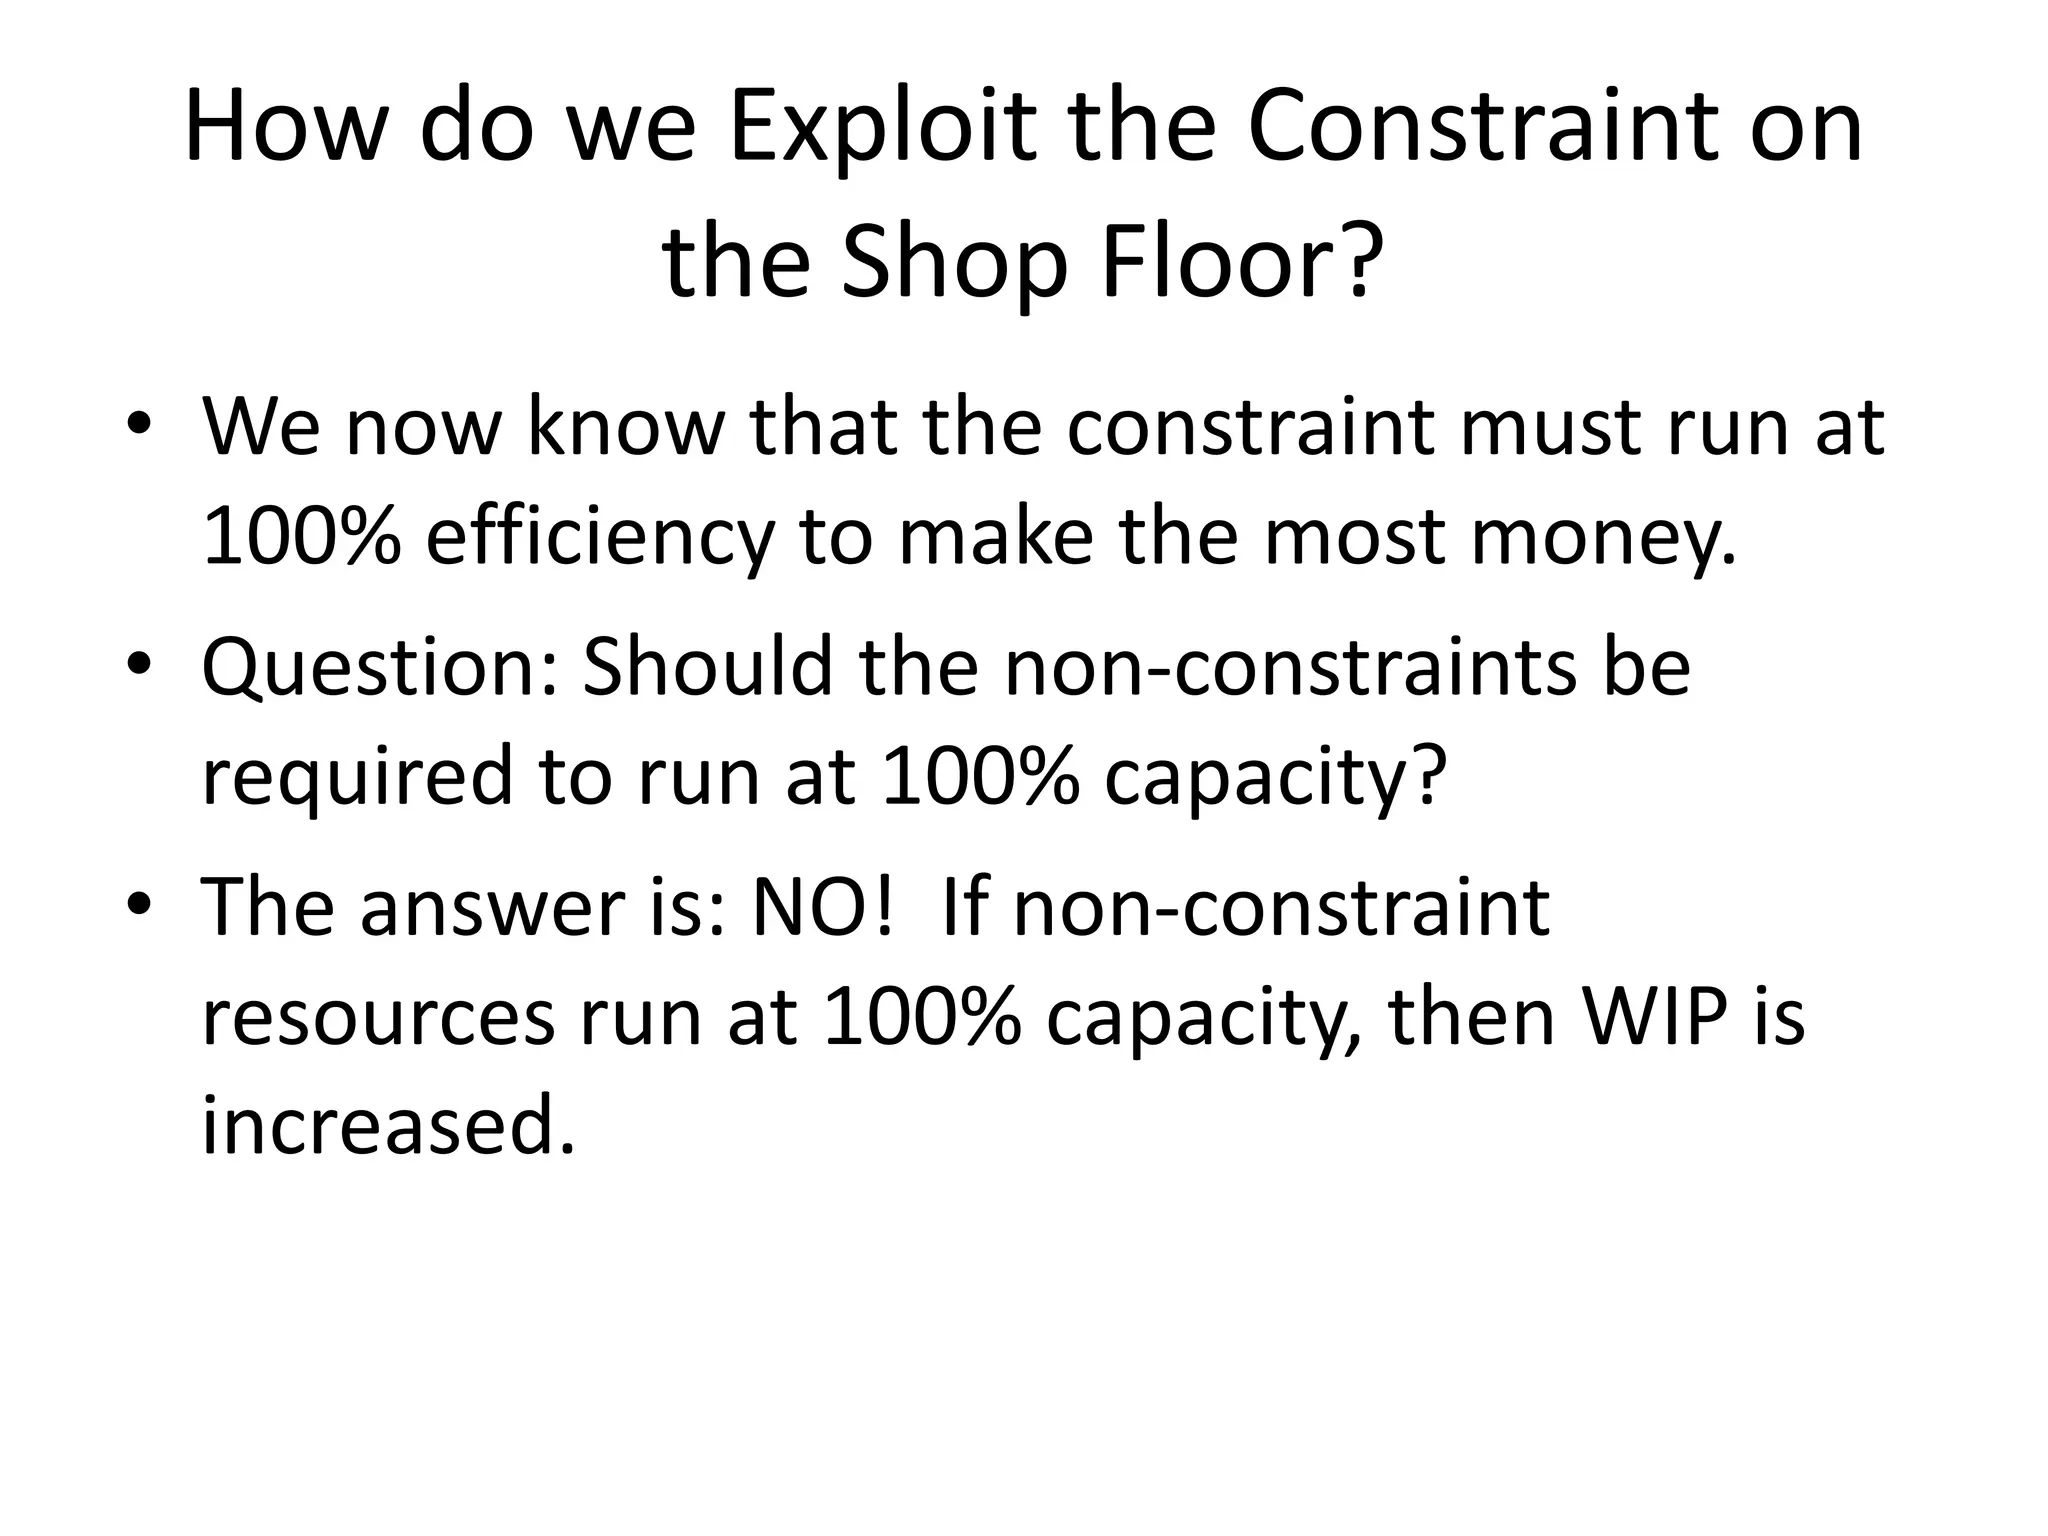
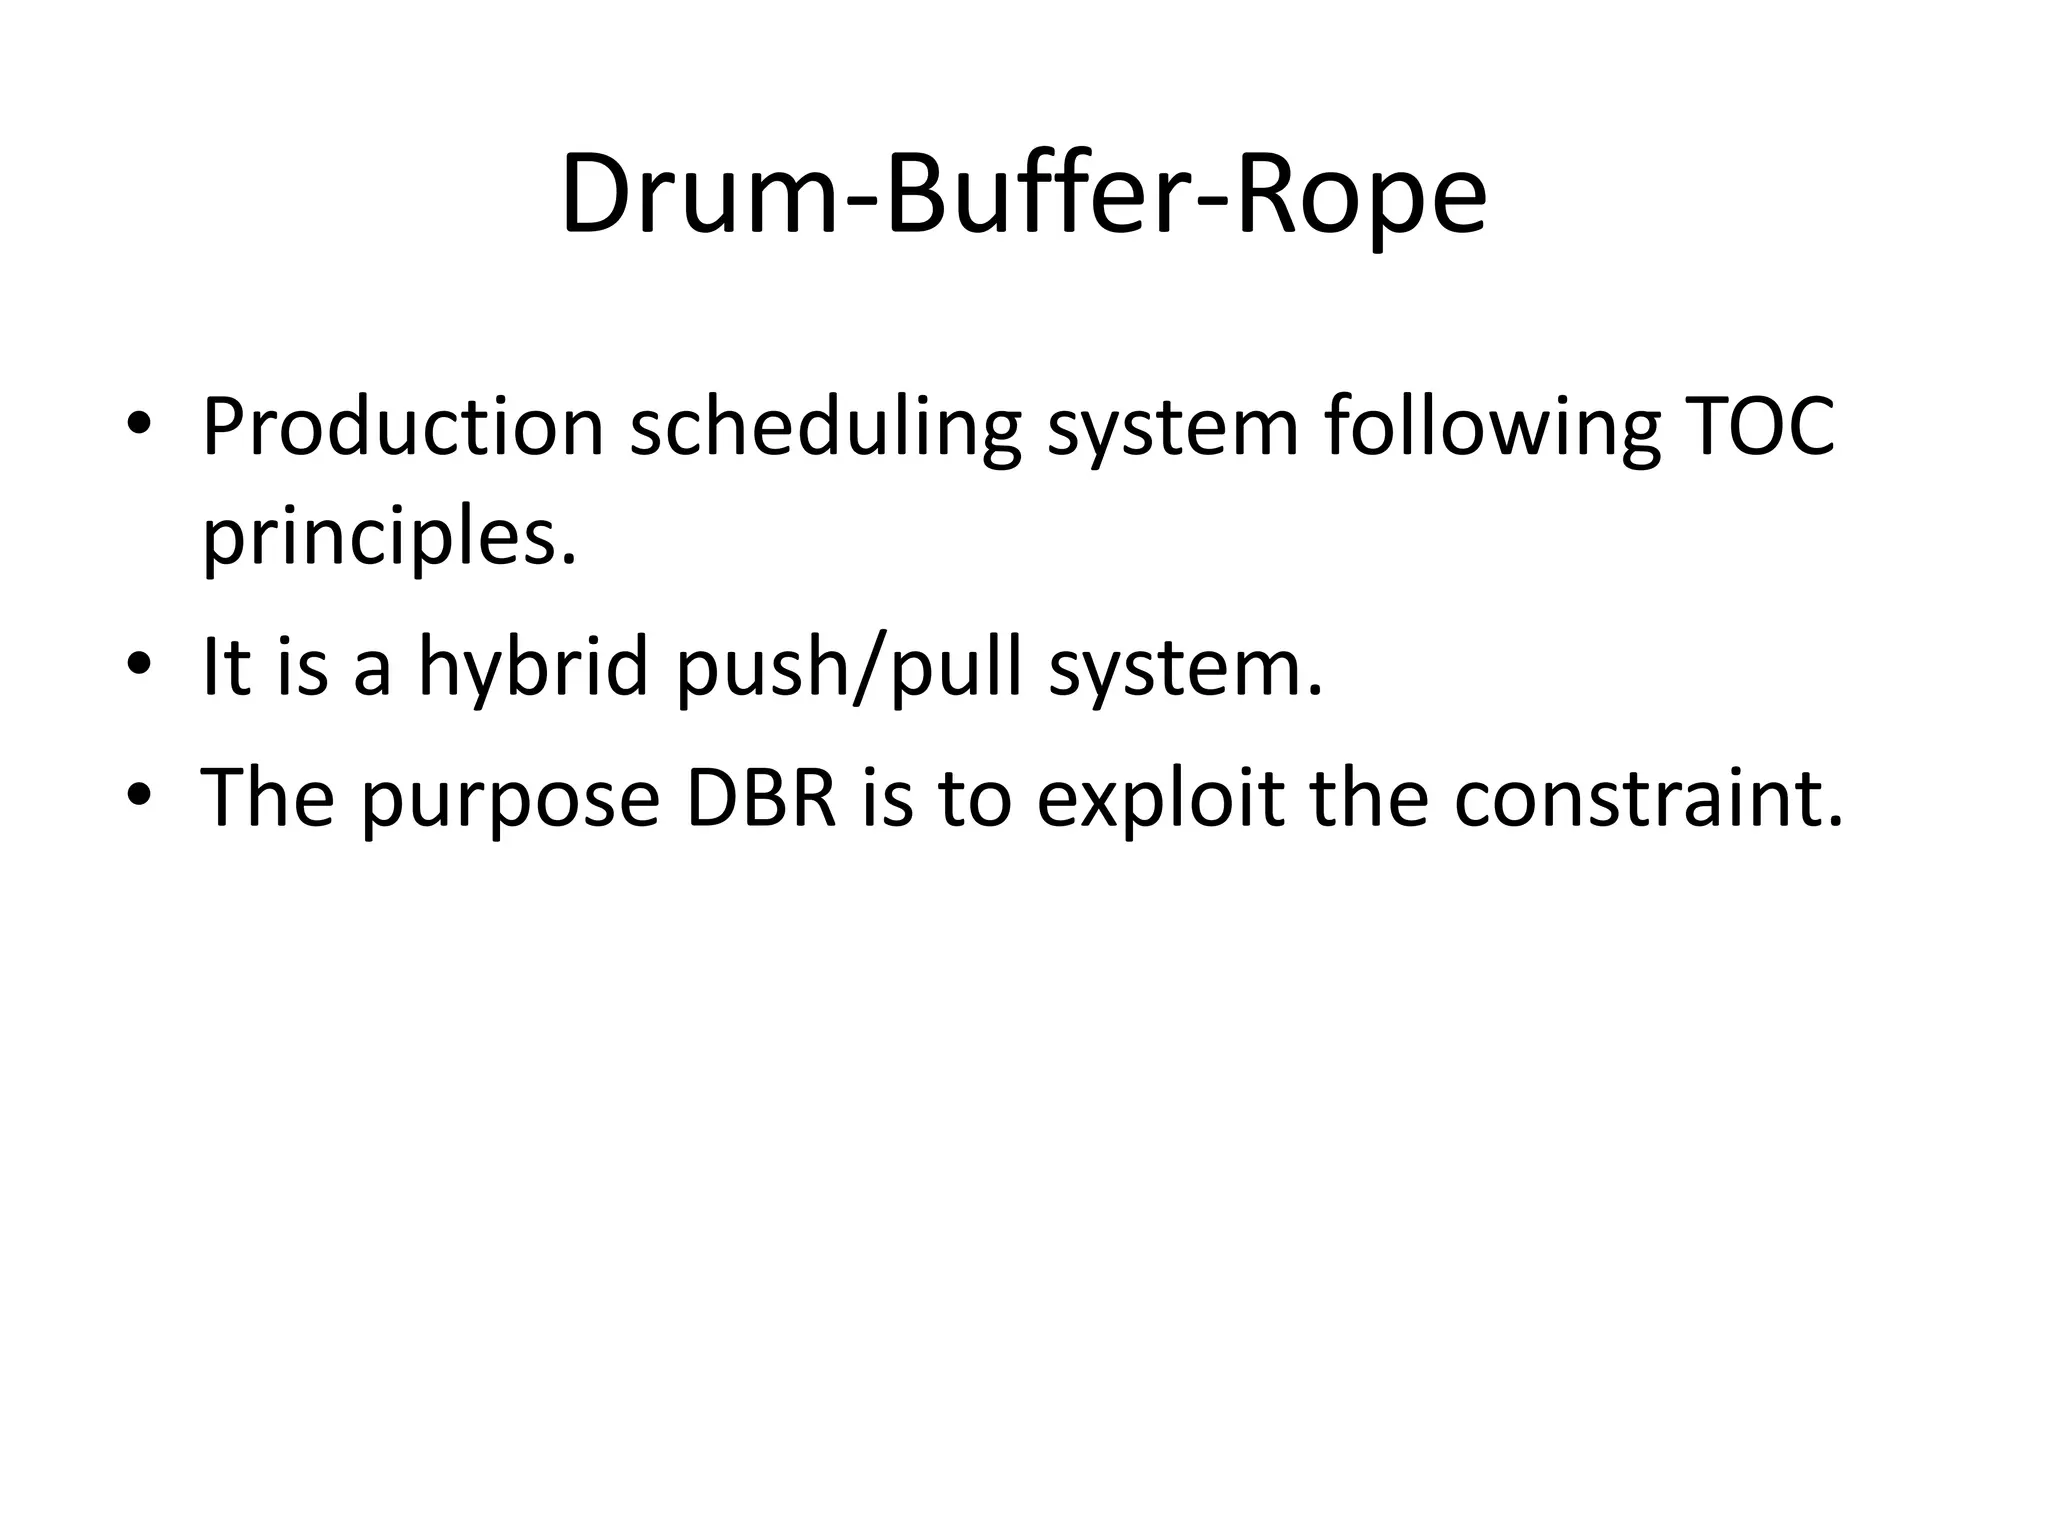
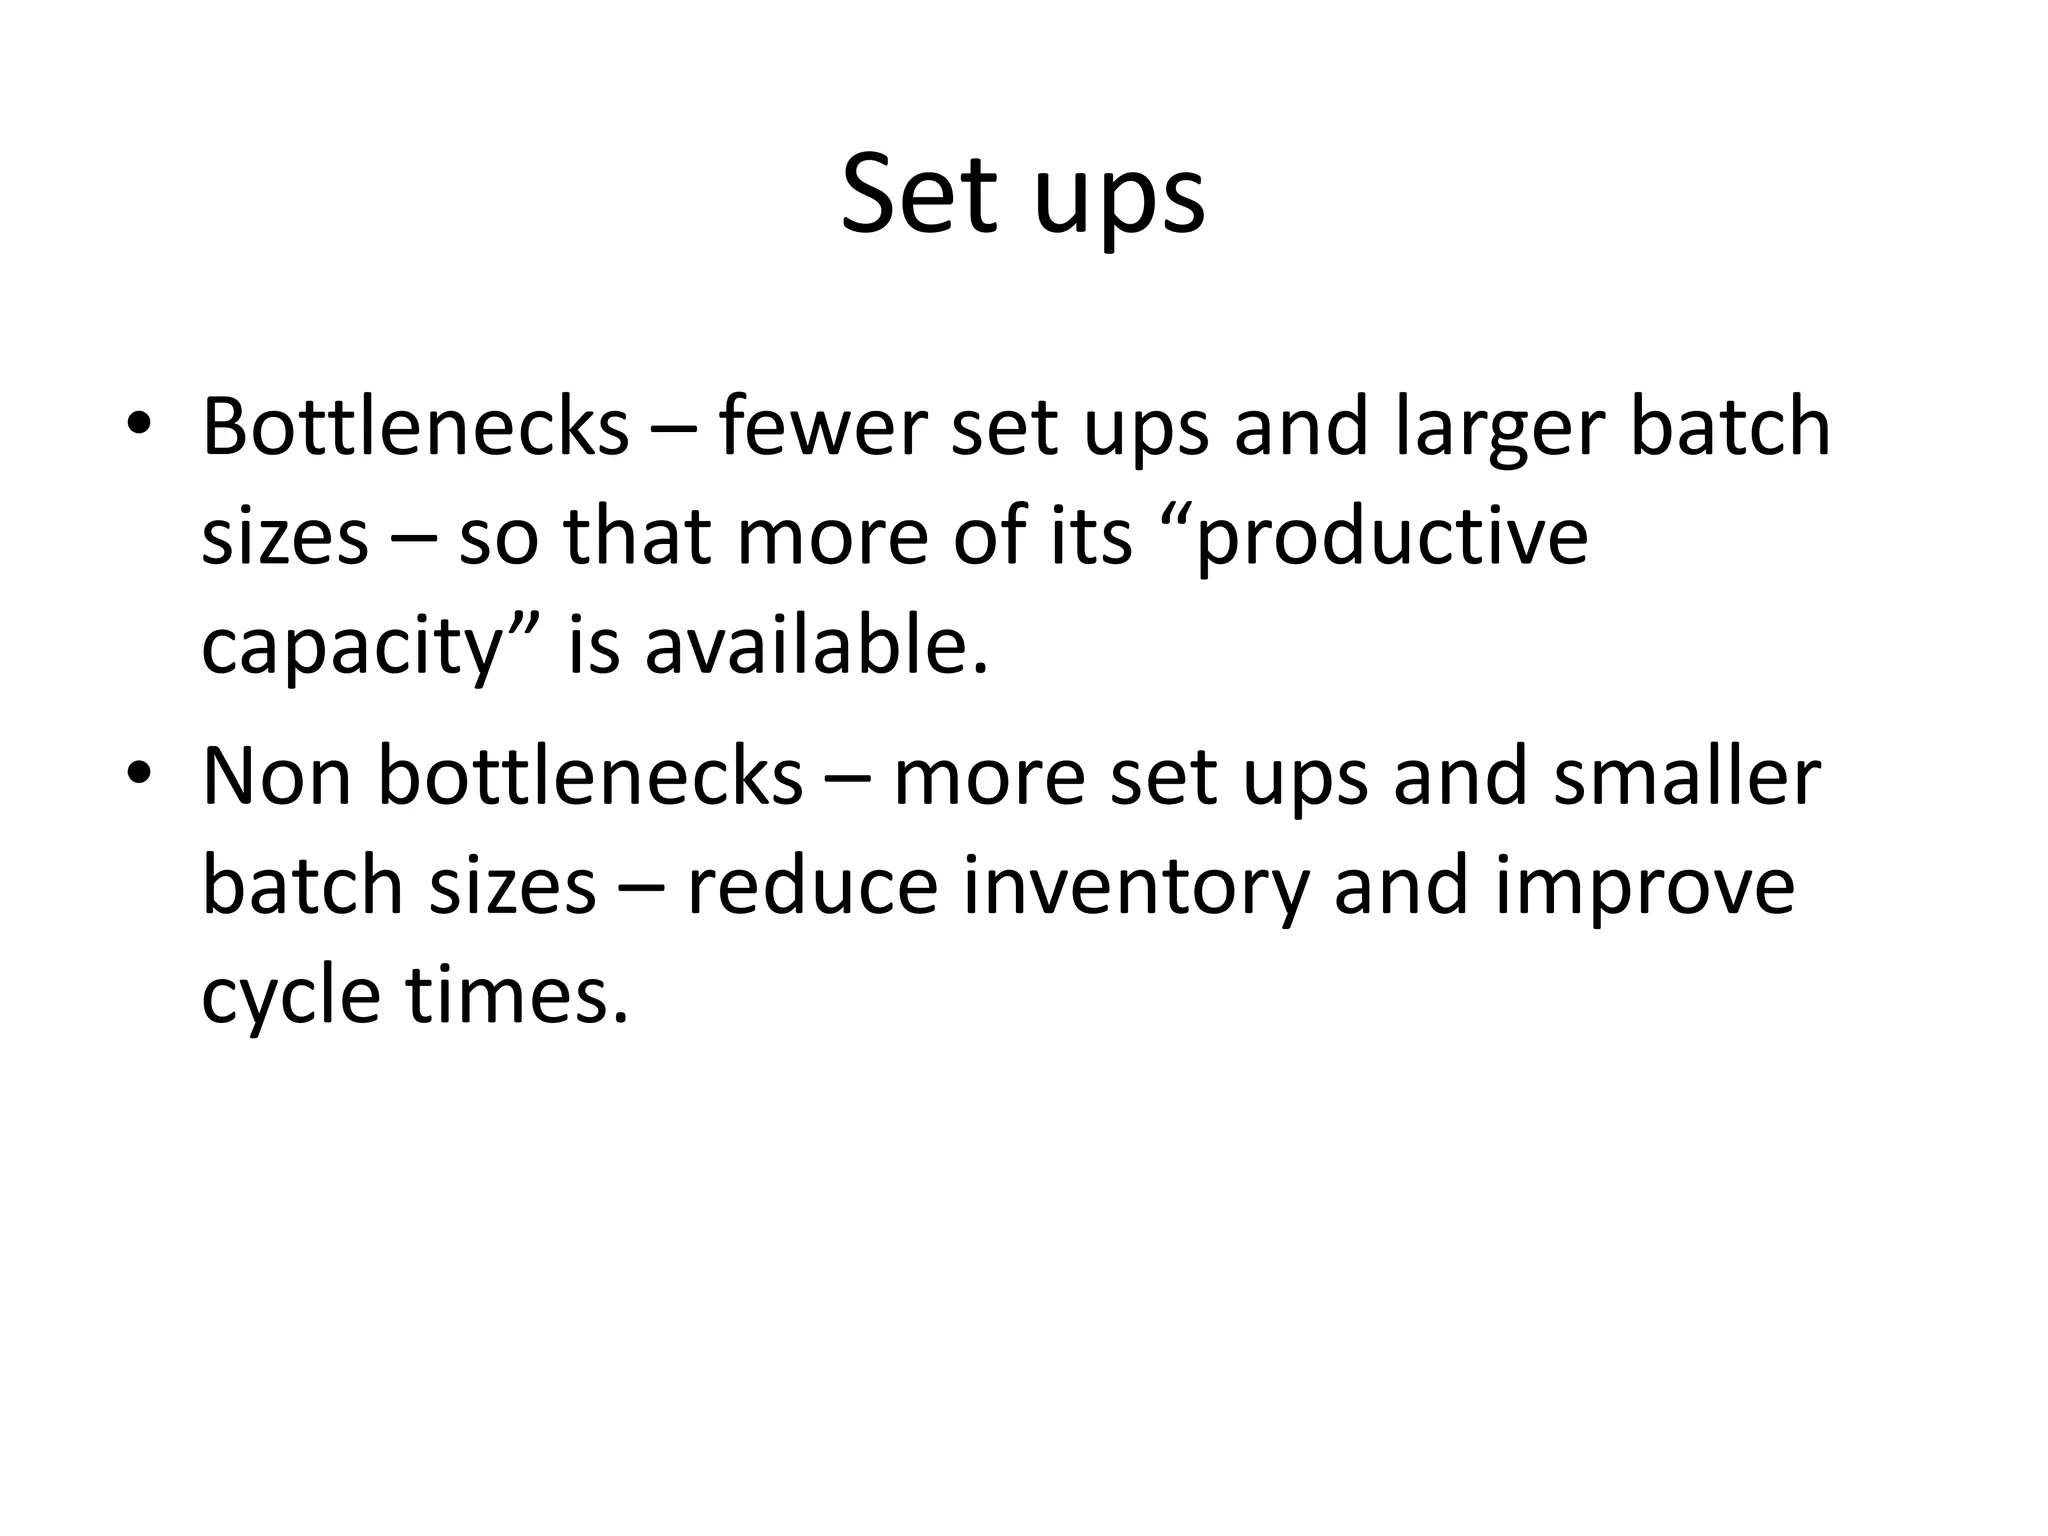
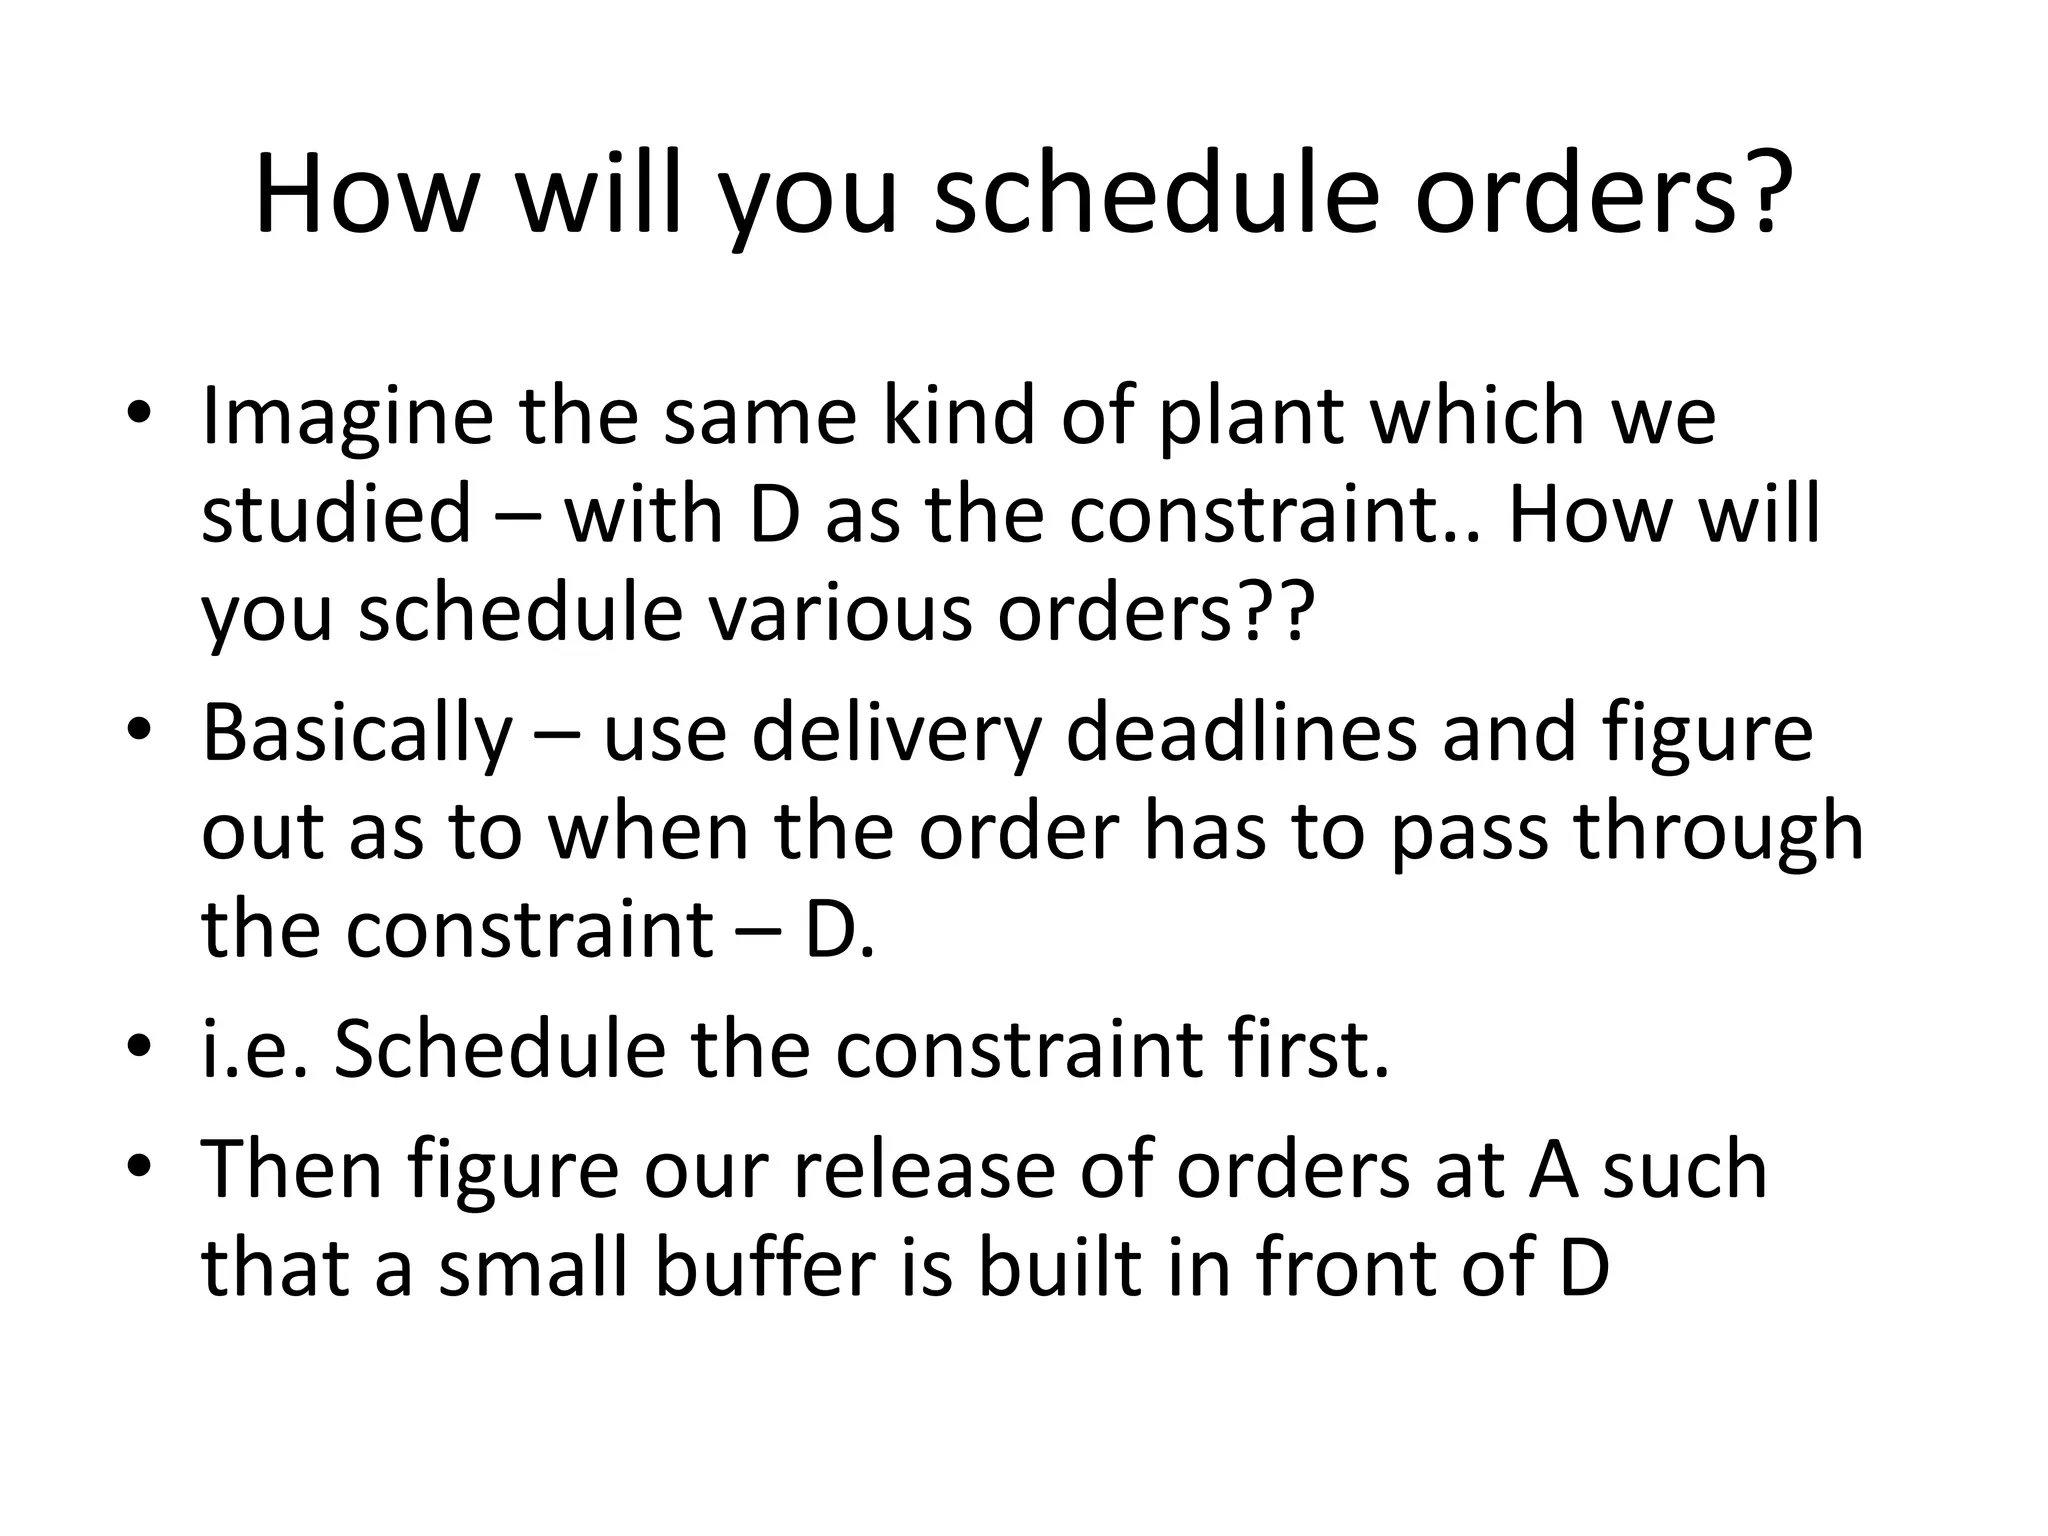
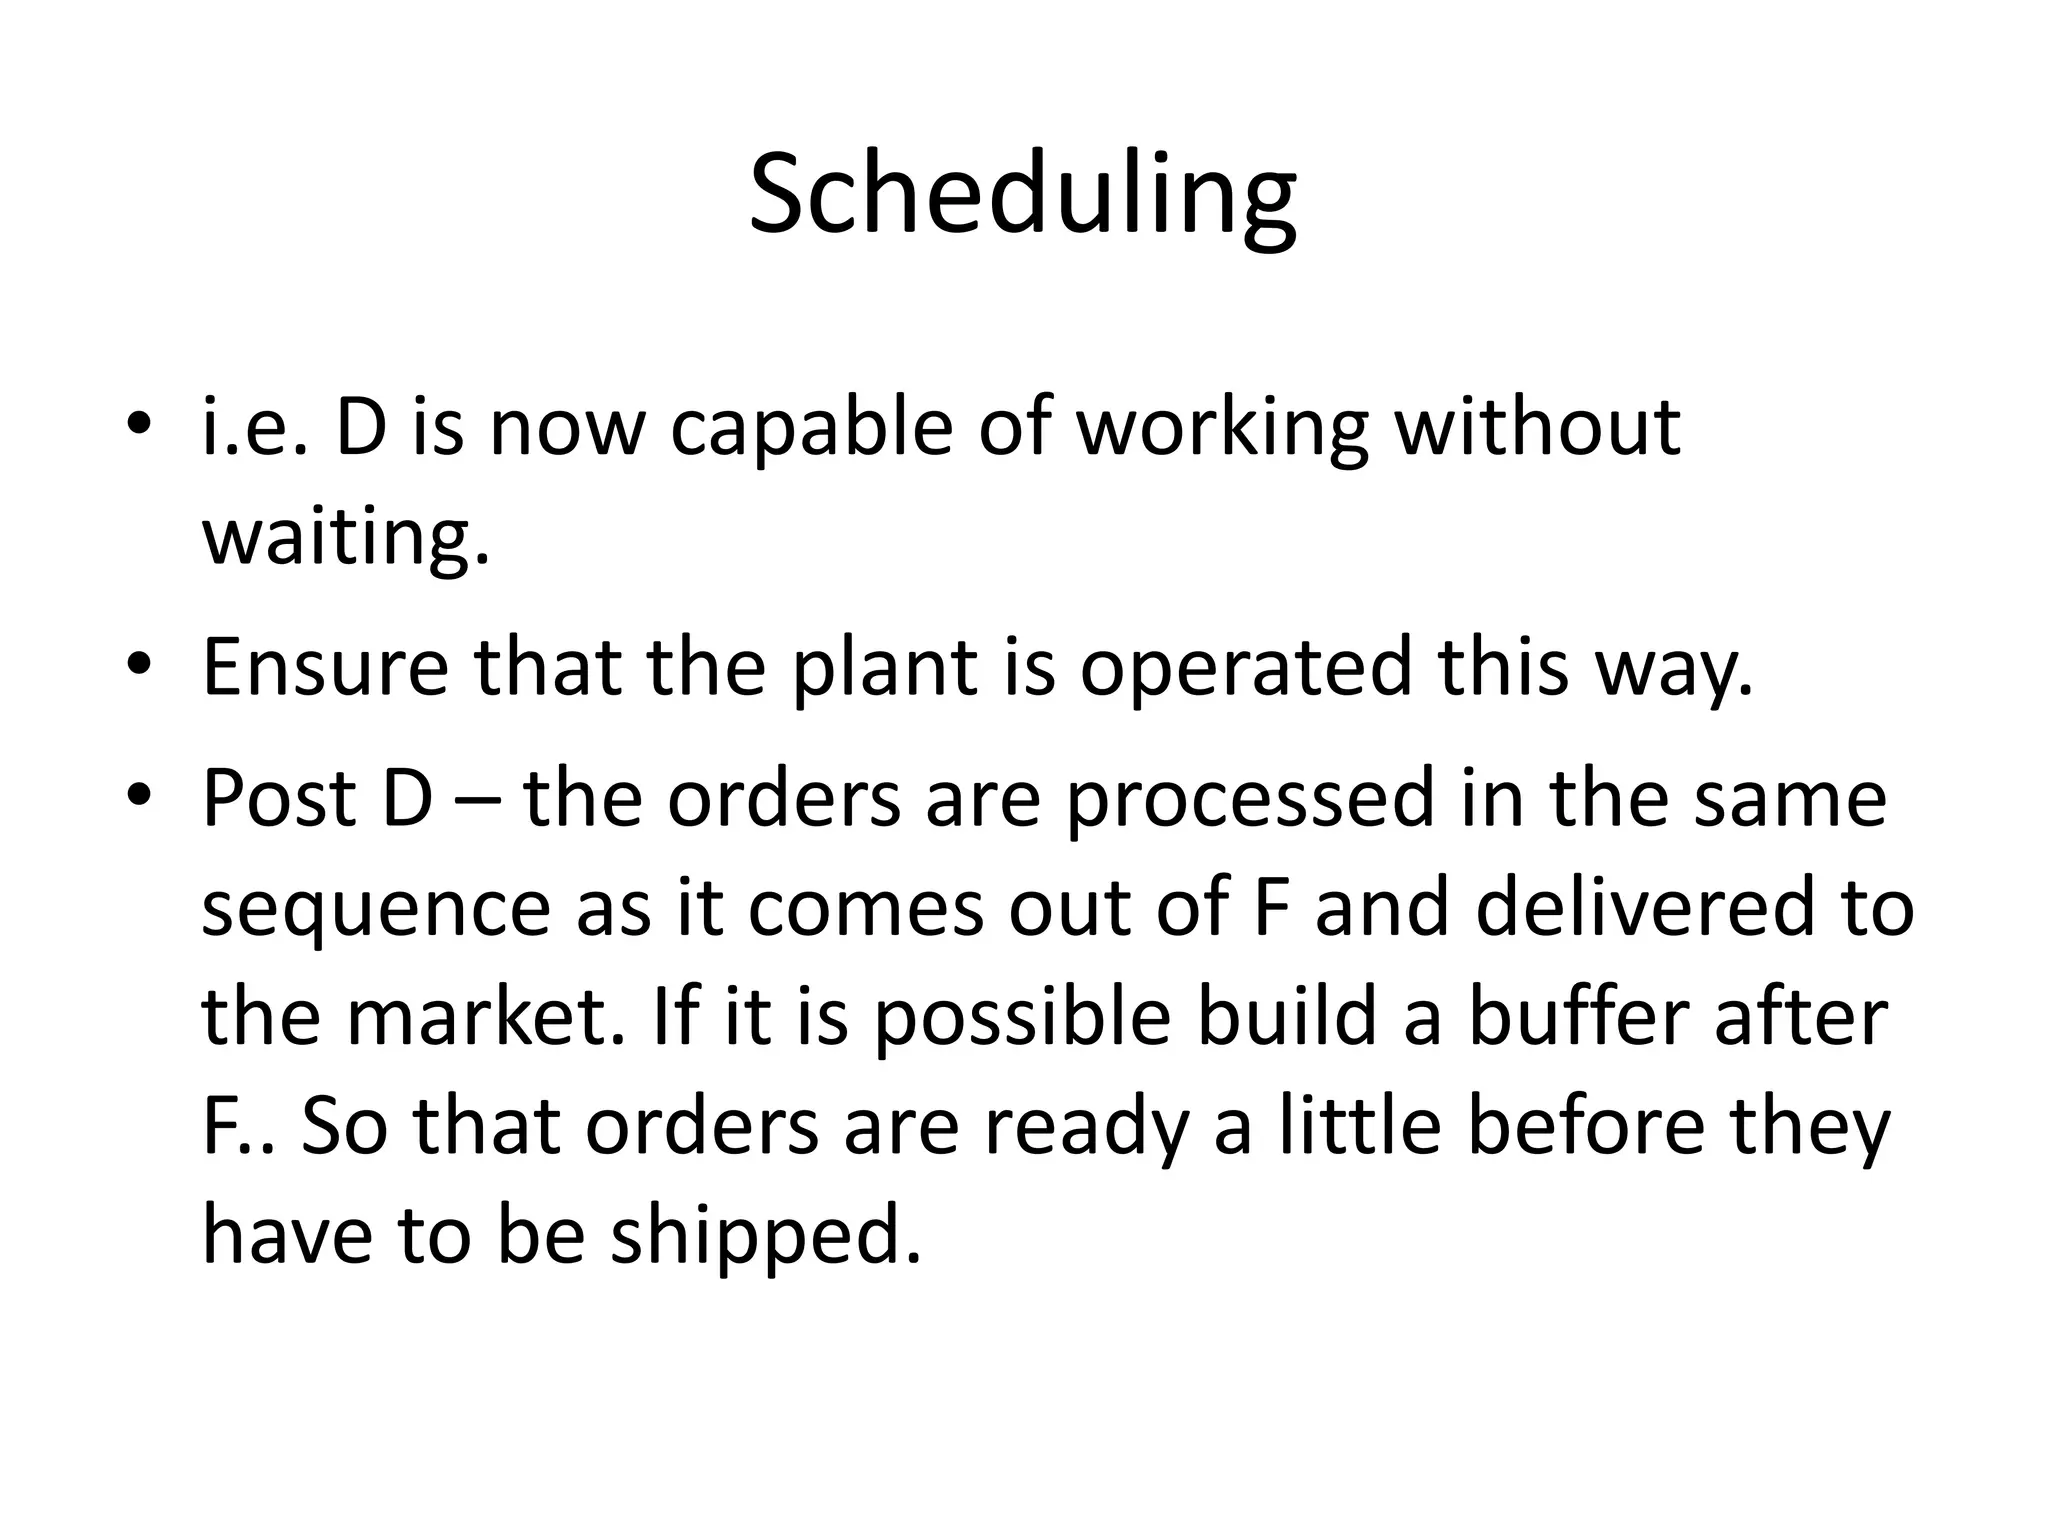
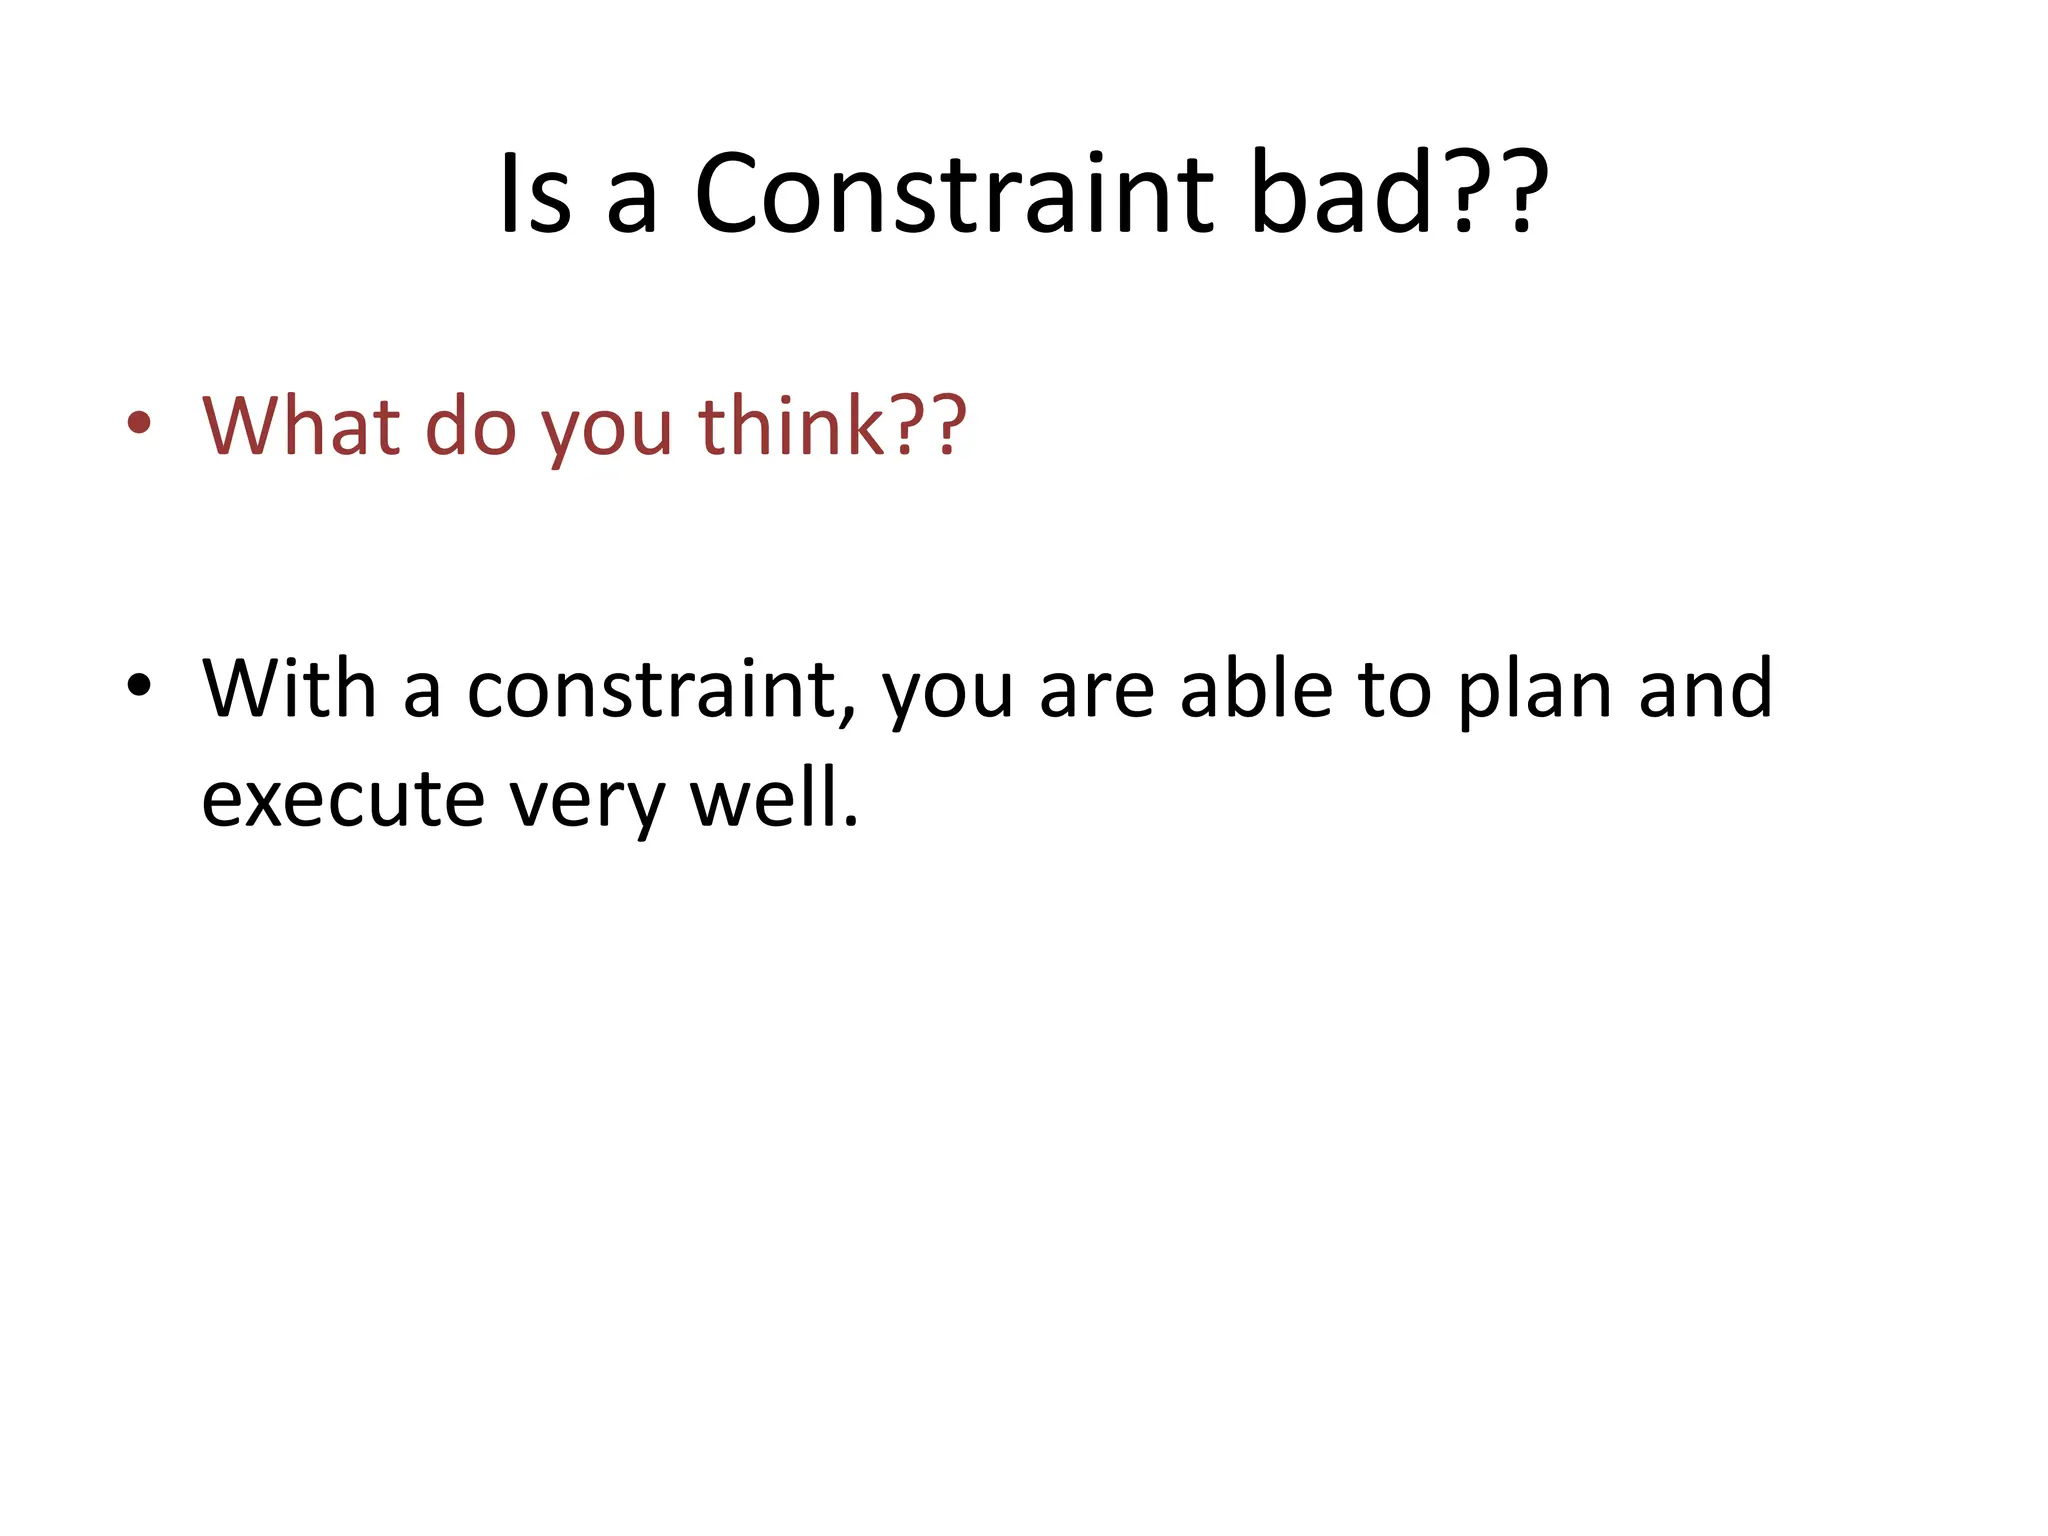
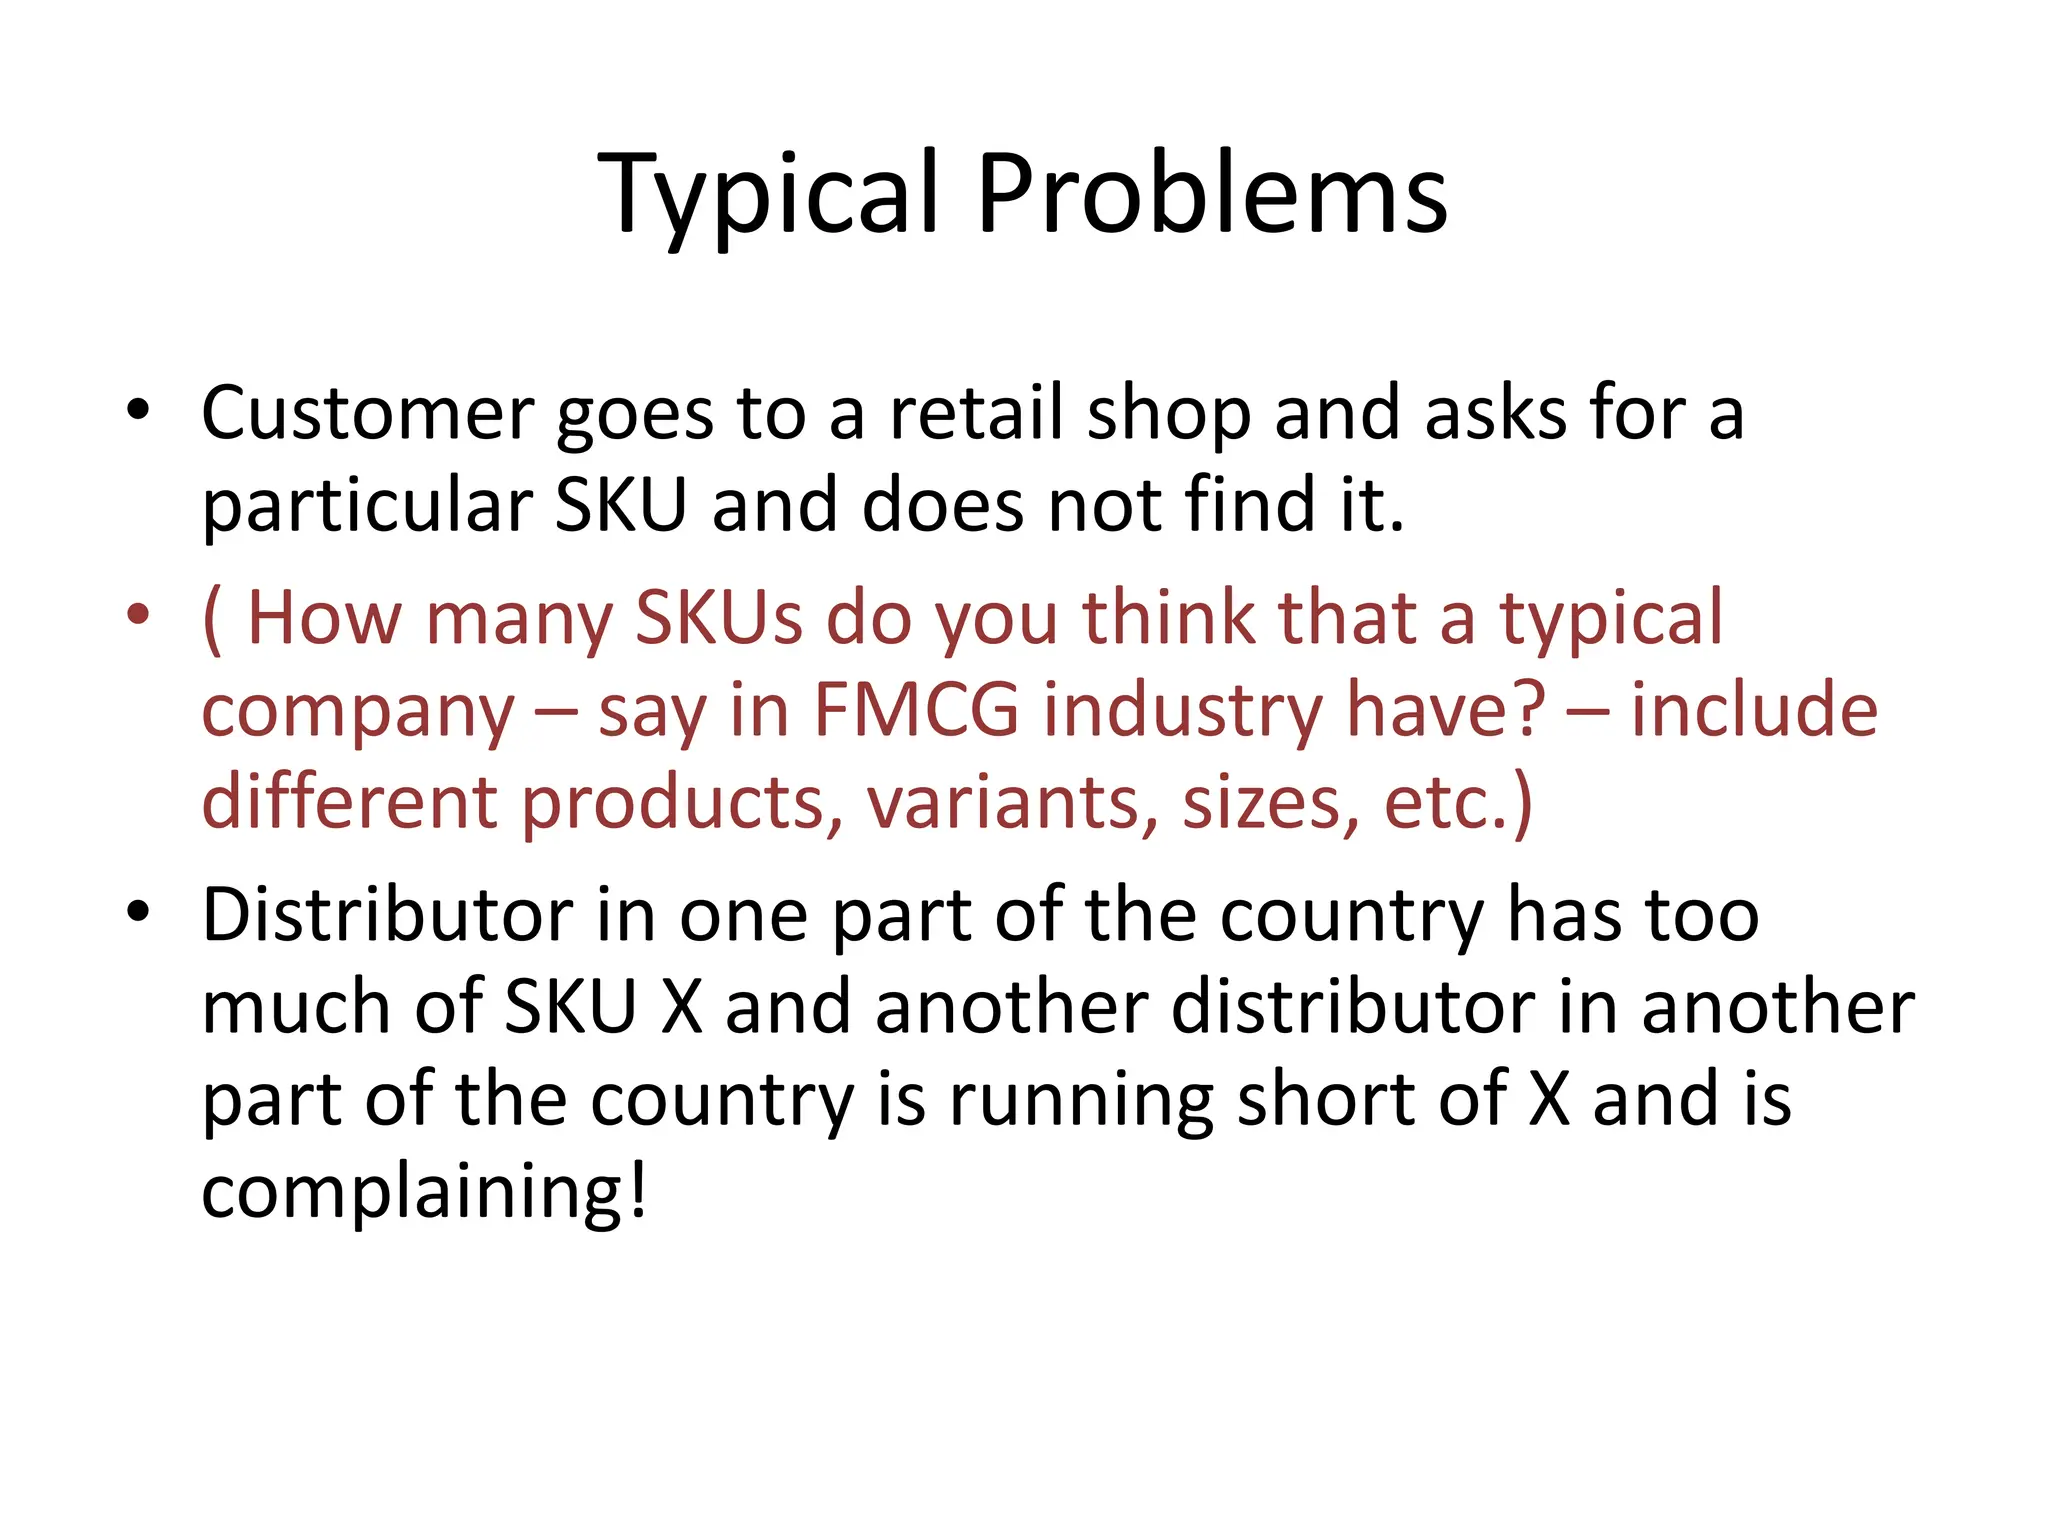
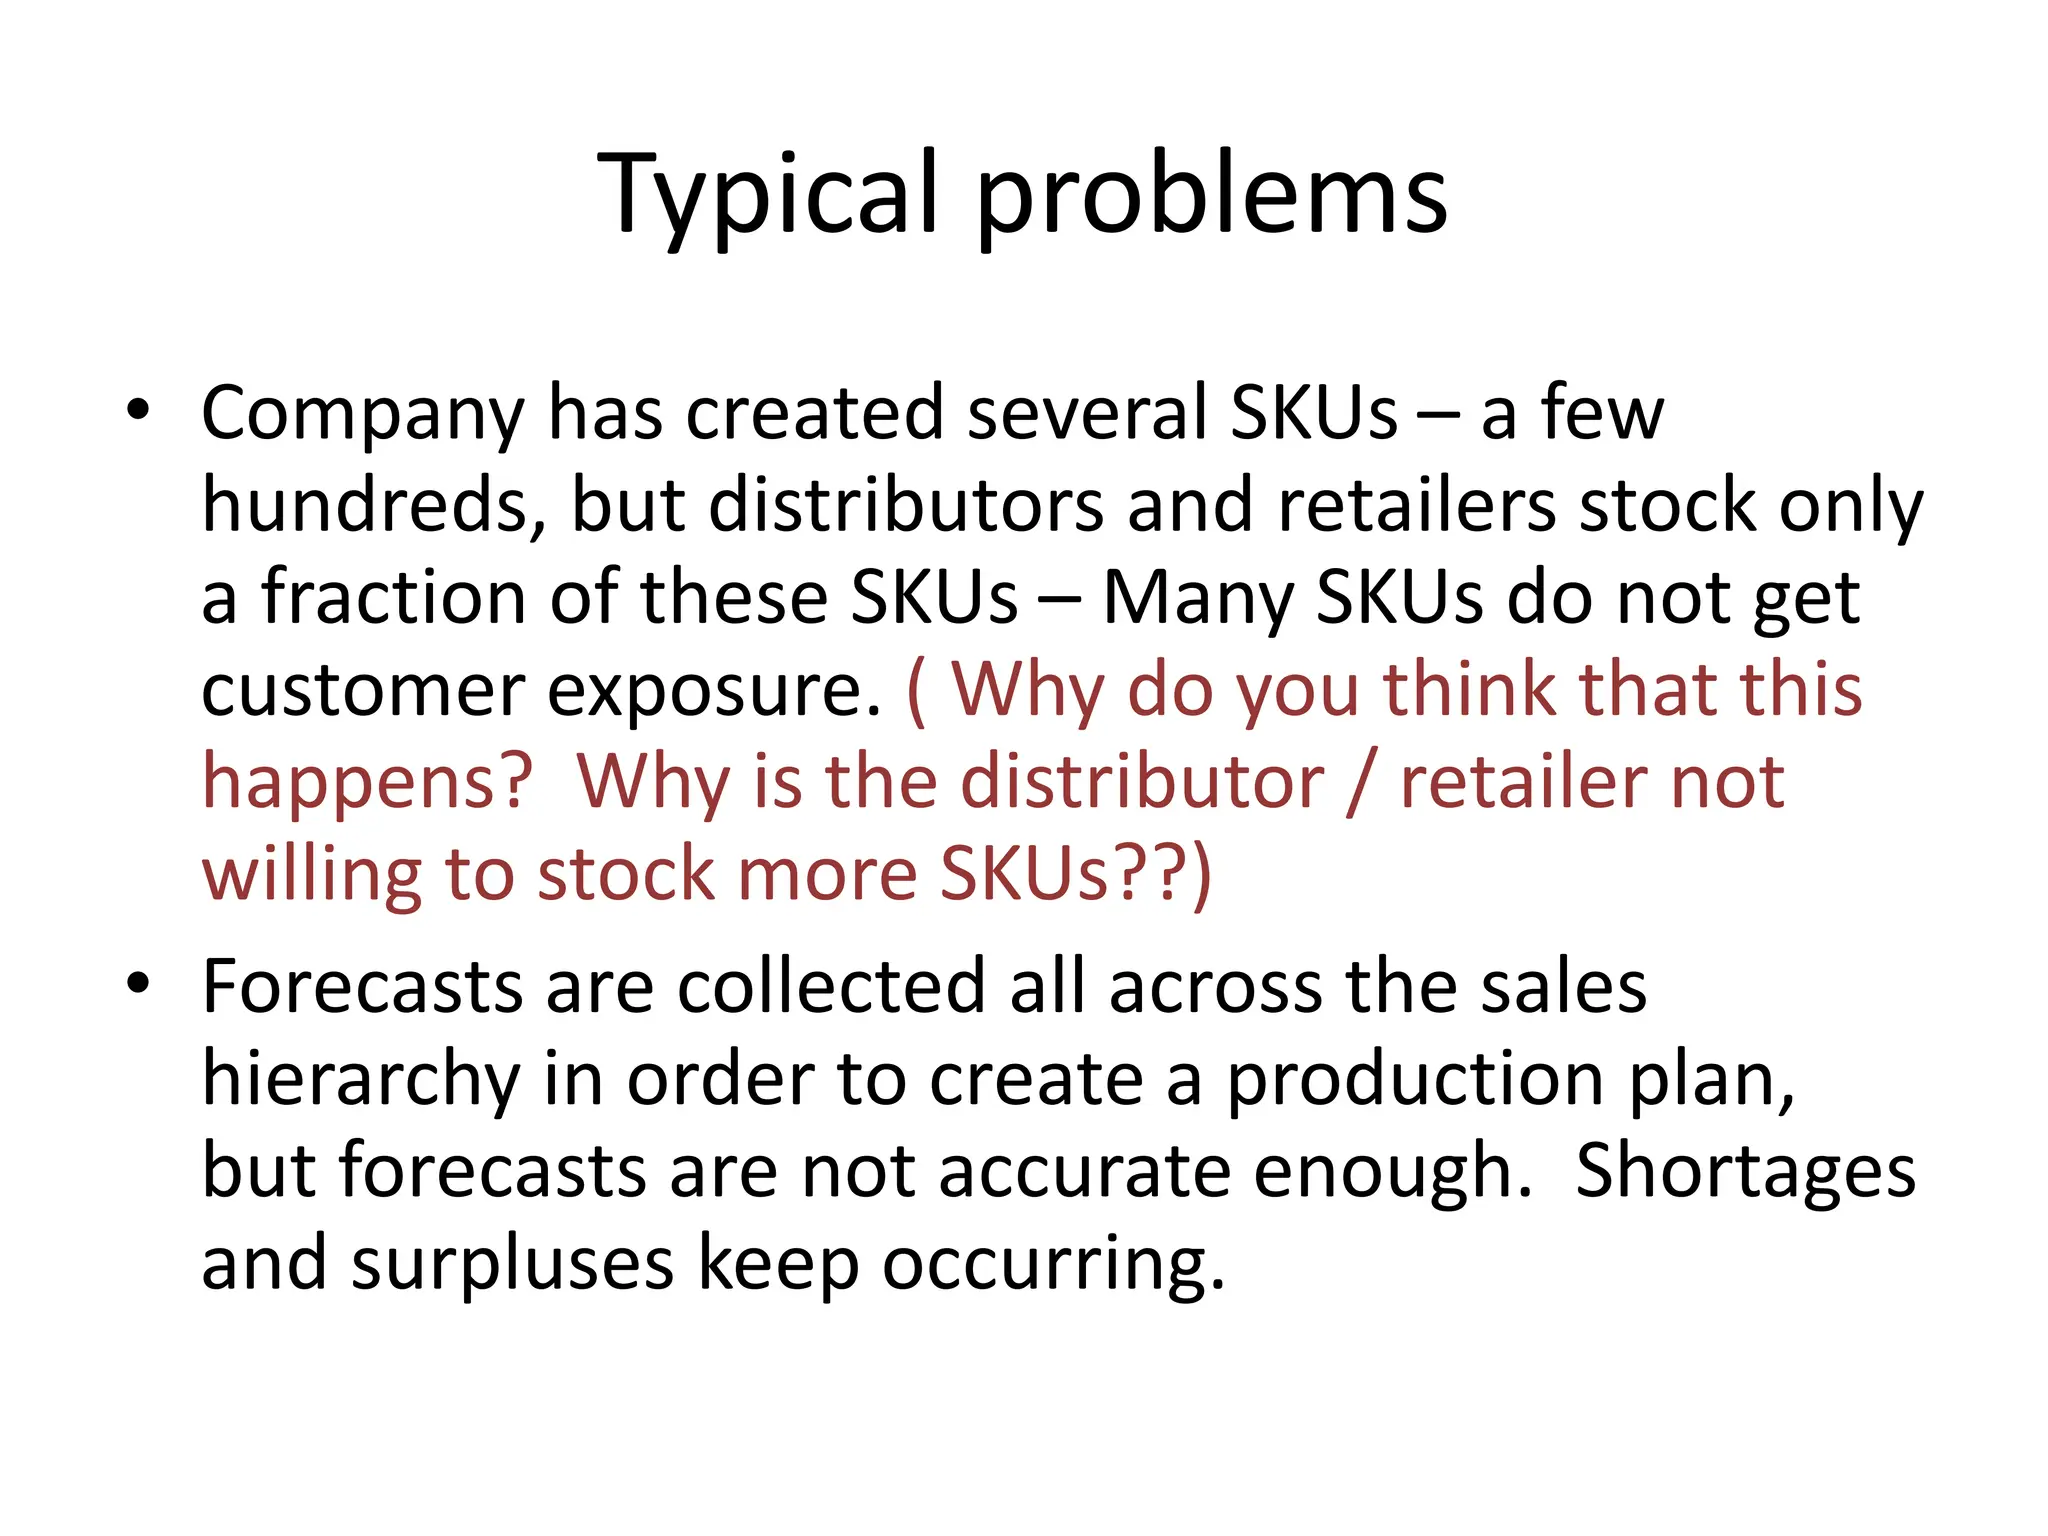
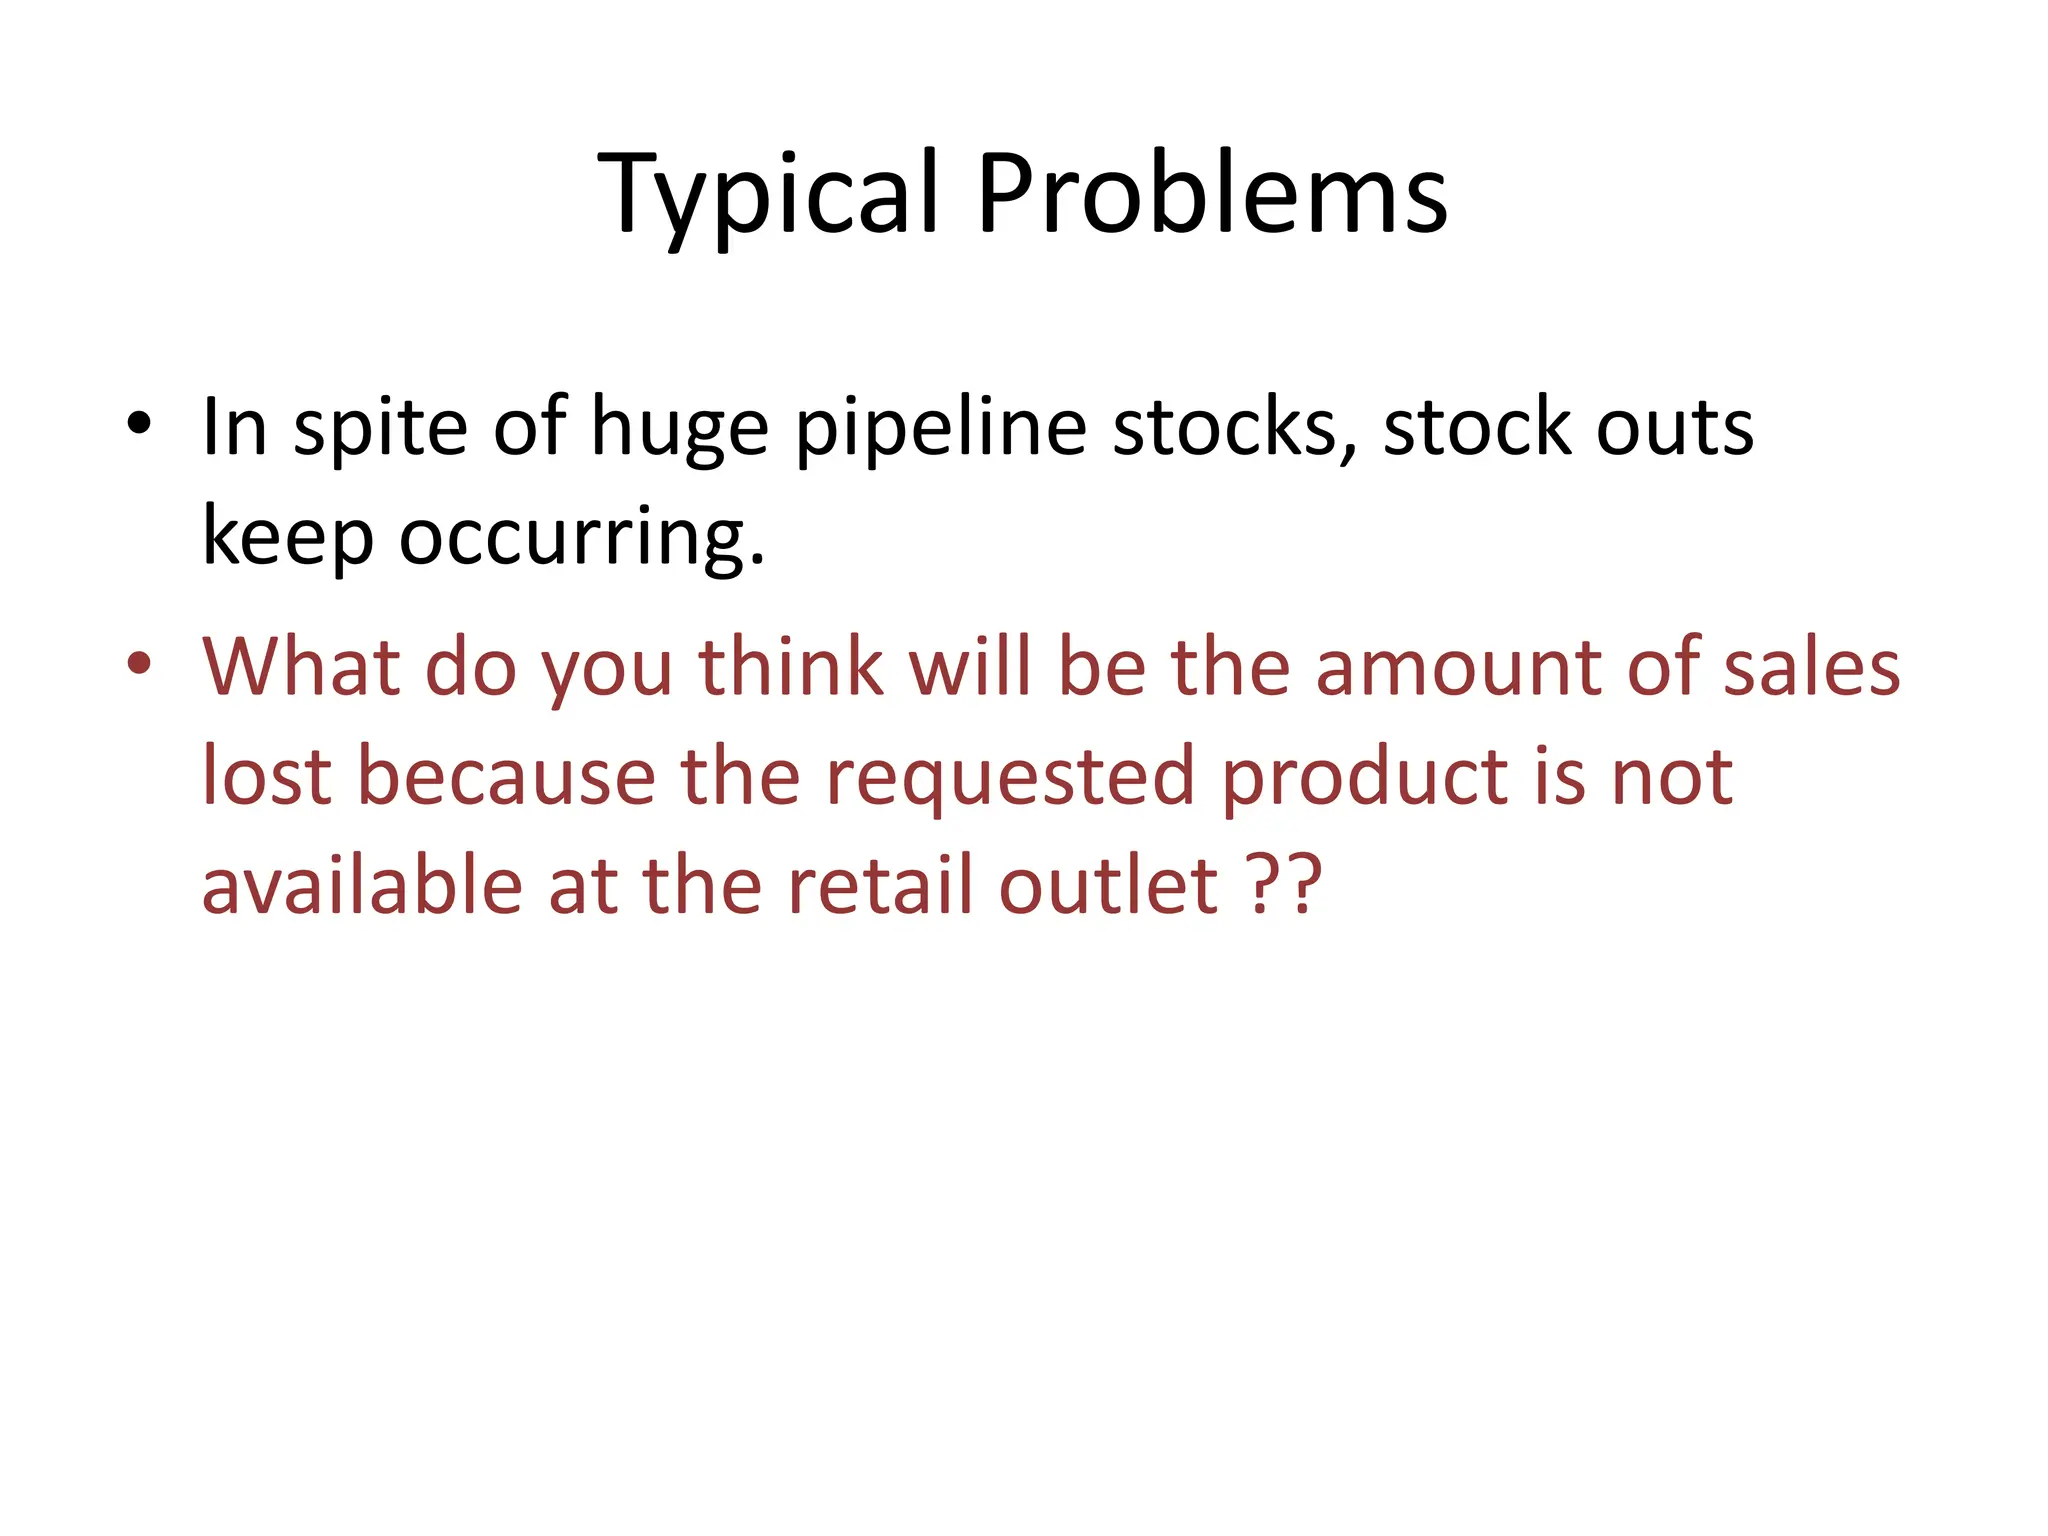
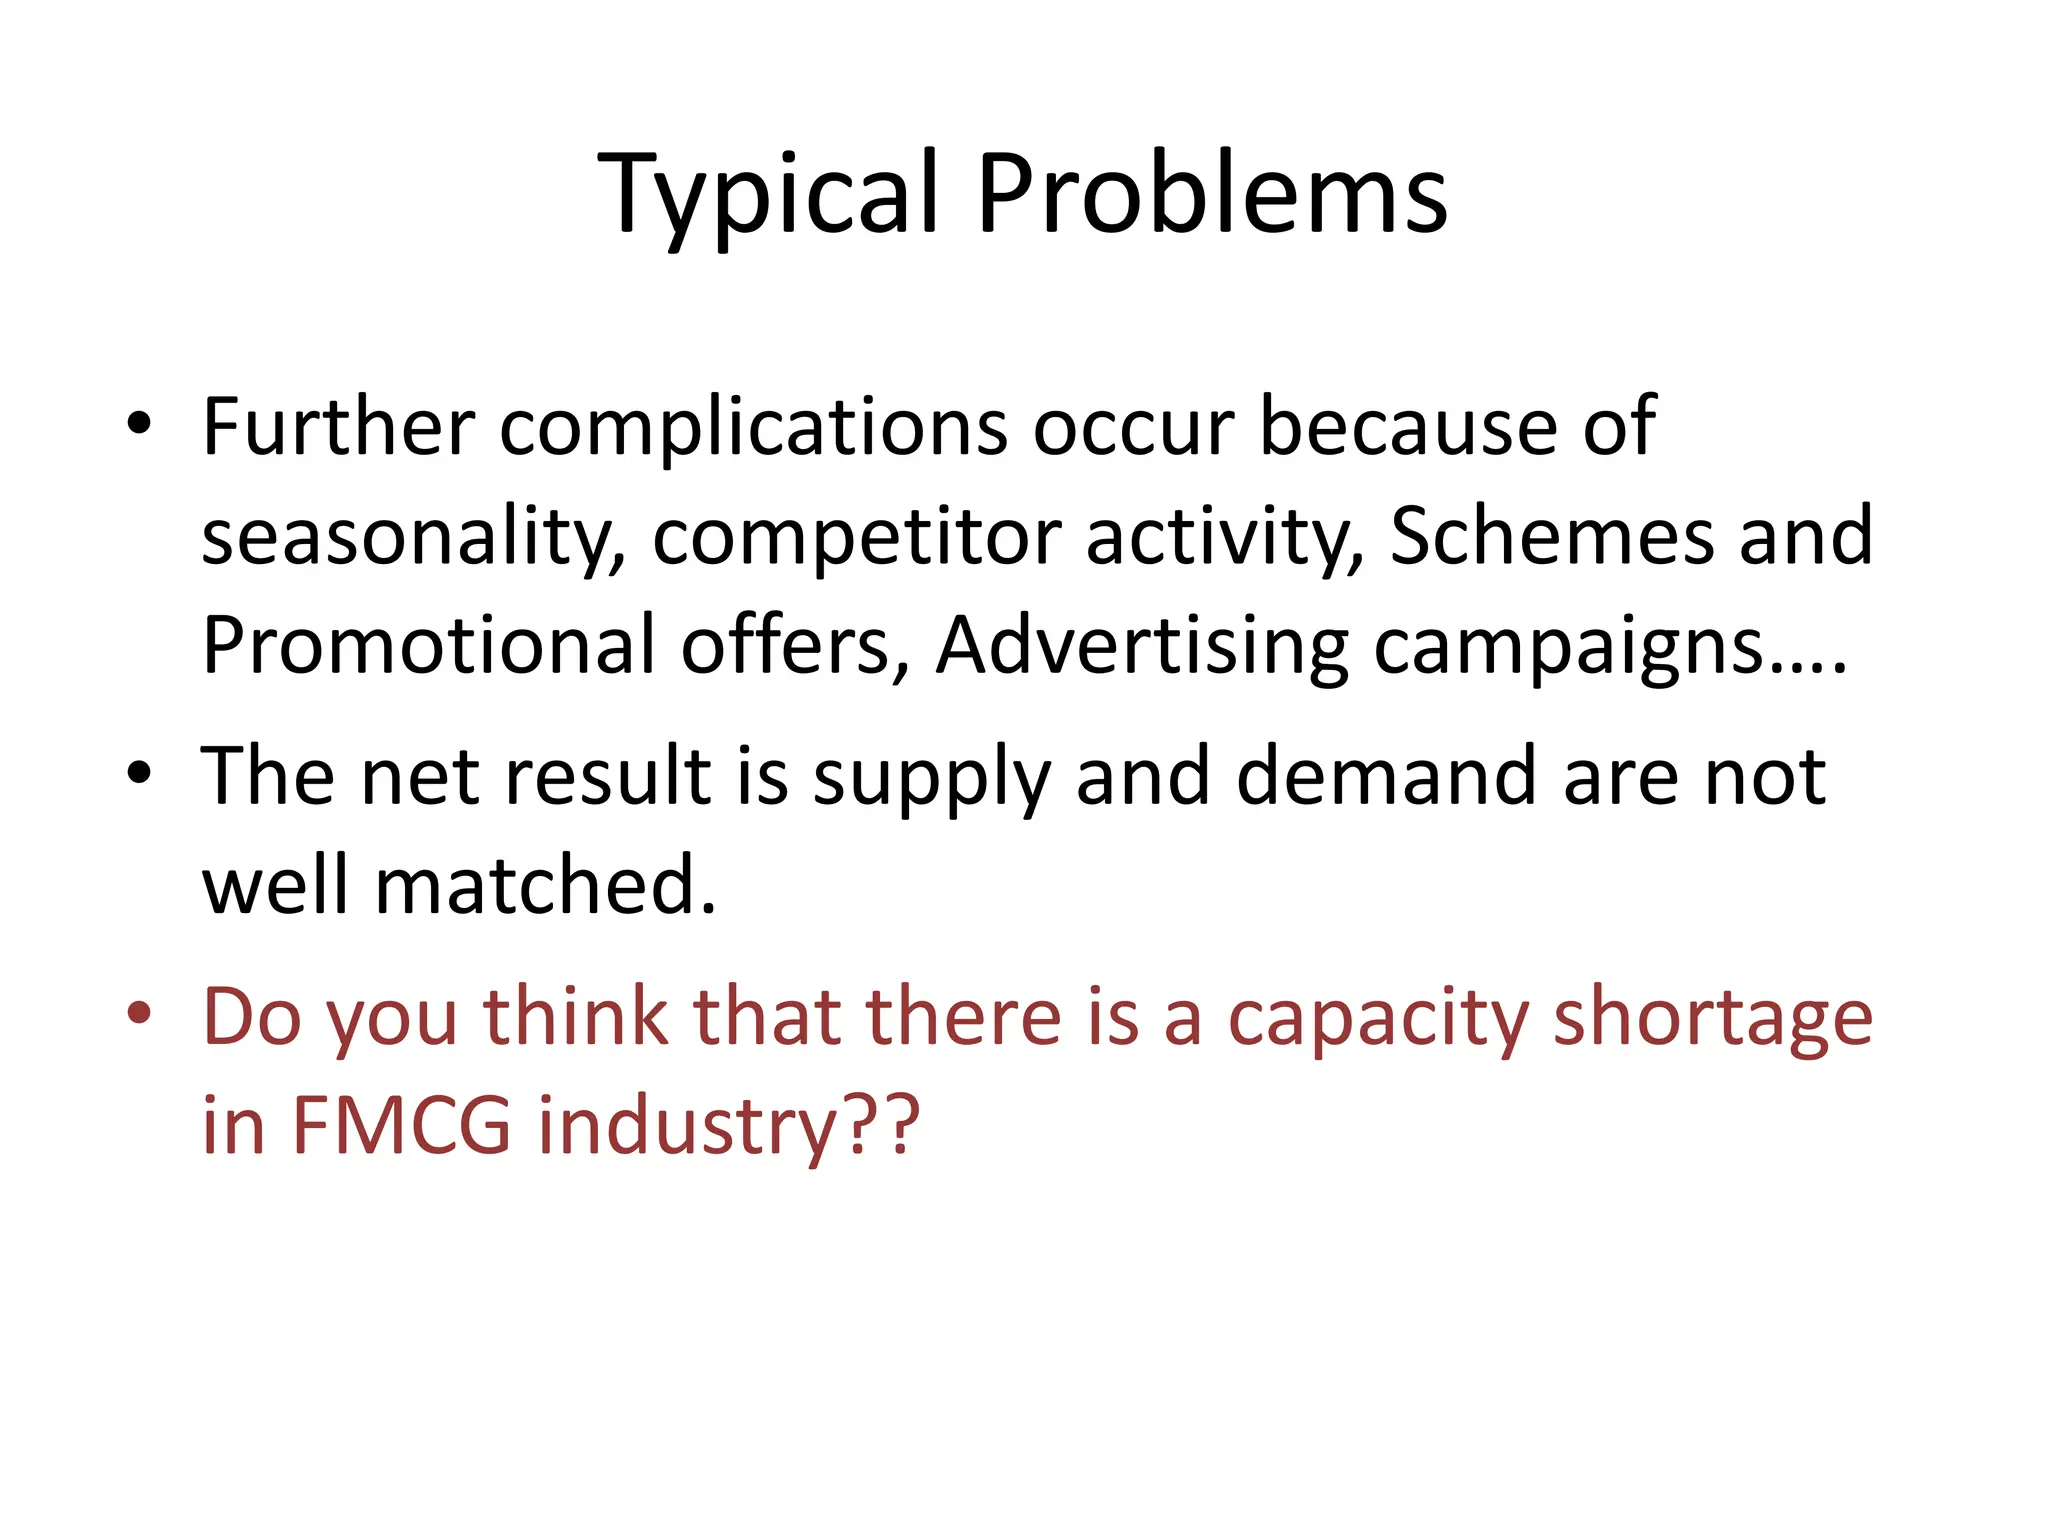
Why Study TOC?
• You can show dramatic improvements
• You can solve complex problems – using TOC
Thinking Process
• You can plan for using resources effectively
and also improve your system.
• Most methods either help you plan or
improve your system – TOC can help you do
both.
Introduction to Theory of
Constraints
R Raghavendra Ravi
July 2023
Theory of Constraints
• Theory of Constraints (TOC) is a body of
knowledge developed by Dr Eliyahu Goldratt.
• Most people believe that TOC is applicable
only to Operations – this is not true.
• TOC is based on Systems Theory (A system
cannot be understood by understanding the
components of the system).
• TOC can be applied to several situations –
Supply Chain, Projects, Sales, …
Theory of Constraints
• For those of you who are interested in
studying application of TOC is varied fields:
• Theory of Constraints Handbook 1st Edition
• by James Cox (Author), John Schleier (Author)
• This book contains chapters dedicated to
different applications.
Theory of Constraints
• TOC is based on rigorous cause and effect analysis
of situations.
• TOC is often counter intuitive.
• In many ways, it is not a new theory, but it looks
at old theories with a new lens.
• More Practitioner led than academic – hence not
many research papers.
• Many Heuristics
• Some would like to call this as “Constraint
Management” than Theory
Our Course
• There are 4 blocks in our course:
• 1) Basic Tenets of TOC
• 2) Drum Buffer Rope (DBR): Application of
TOC to processes – we will study DBR
application to a)Production or Service Process,
b) distribution , c) Projects
• Please revise your 1st year chapters on Process
Analysis, Distribution and PERT etc.
Our Course
• 3) Throughput Accounting – this has
implications for many managerial decisions
like Product Mix, Make or Buy, Pricing,
Investments, Performance evaluation etc,
• This is largely based on relevant costing
approaches.
• It differs with Standard Costing, Activity Based
Costing etc.
Our course
• 4) TOC Thinking Process
• This is a fundamental contribution made by
Goldratt towards problem solving.
• This module will be taught by Prof Harshal
Lowalekar in sessions 11 to 20.
• TOC TP enables you to verbalize your
understanding of a situation and arrive at a
consensus on What is the problem?
Our course
• TOC Thinking Process:
• Often consensus does not exist in an
organization – different people have different
perceptions regarding the problem.
• TOC TP is a structured method of verbalizing
the problem and a systematic approach to
using our intuition to solve the problem.
• More on this a little later in the course.
Theory of Constraints
• TOC also relies heavily on other management
theories and methods – but, at times looks at
it differently.
• It is not in conflict with Six Sigma or TQM or
Lean or any such methodology which are all
aimed at process level improvements.
• TOC is a system level approach.
• We can also combine some of these
approaches with TOC.
Theory of Constraints
Part I
Goals, Measurement, Throughput,
Inventory and Operating Expense.
Theory of Constraints
• The Theory of Constraints (TOC) is a body of
knowledge that has been developed over the
past twenty years by Dr Eliyahu Goldratt and
other practitioners.
This body of knowledge challenges many of the
assumptions about how we currently manage our
businesses and organisations.
It is based on the logic of cause and effect and
has been derived from the hard sciences.
Theory of Constraints
• It is often counter intuitive.
• Eg. Theory of Constraints looks at the
company as a whole and asserts that the sum
of local optima does not lead to global
optima.
• We often think that if every part of a company
is working at its best, then the whole company
will be working at its best!!
Theory of Constraints
• TOC also relies heavily on other management
theories and methods – but, at times looks at
it differently. In fact one of the reviews says
that TOC is refocuses some of the existing
theories.
• It is not in conflict with Six Sigma or TQM or
Lean or any such methodology which are all
aimed at process level improvements.
• TOC is a system level approach.
Theory of Constraints
• “The Goal” Published in 1980 By Goldratt
explains several principles of Theory of
Constraints.
• Book describes how Scheduling, use of
resources & inventories are all going wrong.
• Faulty understanding, faulty performance
measurements, wrong view of cost data,
traditional view of usage of assets and people
lead businesses into wrong decisions.
Theory of Constraints
• Since The Goal talks about a manufacturing situation –
people think TOC is about manufacturing.
• Goldratt wrote :
Goal II – exploring supply chain problems
Critical Chain – he applies TOC to Project
Management
Necessary but not Sufficient – is about IT
Theory of Constraints can be applied to any system
and hence is not restricted to a function or field
Why Study TOC
• Useful body of knowledge
• Interesting analytical approach for managers
• Very powerful in the hands of a good Consultant.
Can show some quick results without much
investments.
• Looks at business (or a system) as a whole and
not functional / divisional. An integrated view.
(This sometimes causes problems. Many
Organizations are run in a Fragmented manner)
Example
• Imagine that a Plant implements TOC and improves
productivity and output by 20%.
• With all these improvements, Sales of the company
goes up by say 20%. Now Sales is above budget.
• What happens to the “excess people” in the plant
now?
• Unless we are willing to push Sales team beyond their
+20%, the firm may end up downsizing the plant !
• These are risks associated with implementing TOC in a
firm which has not fully understood impact of TOC
Goal of a Firm
• A business or a company can talk of several
goals – Customer satisfaction, technology
leadership, Commitment to Quality, employee
happiness, being a responsible Corporate
Citizen etc.
• None of these are sustainable without profit.
• While all the goals are necessary, Profit alone
will allow us to sustain the company in
providing Customer satisfaction …..etc.
Goals of a Firm
• But we are seeking profits for the long term
and hence TOCs premise is:
GOAL OF A FIRM IS TO MAKE MONEY NOW
AND IN THE FUTURE.
Even if you do not agree, we can use this
statement of the goal of the firm for our study
now.
Performance Measurements
• Generally accepted measures :
*NET PROFIT - Absolute measurement in Rs./$
*RETURN ON INVESTMENT/ASSETS/
EQUITY/CAPITAL EMPLOYED – a relative
measure.
*CASH FLOW – without this, you do not
survive.
So how do we judge our managerial decisions?
Judging Managerial Decisions
• If any decision improves – Profits, Profitability
& Cash Flow – then those decisions are right.
• But can an operating manager get these data
to judge whether he is on right track?
• You get such reports from “Finance” once in a
quarter …. Too late for decision making.
• So, What do we do?
A word on Cash Flow
• If you have cash flow, even if you are not
profitable, you will survive for some time. BUT
without cash flow, even if you have profits,
you will collapse.
• Several companies, without planning, lock up
cash in investments, inventories etc. Or do not
collect – allowing accounts receivable to rise
and rise.
Performance Measurement
• At the Operational level, we cannot use profit,
profitability and cash flow for day to day
decisions.
• Then what else can guide us to the right
decisions?
• TOC suggests: 1) Throughput
2) Inventory &
3) Operating expenses
Performance Measurement
• Throughput - the rate at which a company
makes money through sales (Cash coming in
should increase)
Notice the emphasis on “through sales” – it
does not recognize “inventory profits” of
“manufacturing profit”
Throughput is defined as Sales price less
bought outs ( raw materials and services) –
labour cost, machine hours etc. ignored.
Throughput
• The idea is:
“Producing” without selling simply increases
INVENTORY and CONSUMES CASH.
* Several businesses value finished goods
inventory and WIP – with “value added” and
this leads to severe distortions.
Often, inventory becomes unsalable and is
scrapped.
Throughput
• Notice that we are not including labour,
depreciation, administrative expenses etc.
Too much time is spent in classifying expenses
as direct and indirect. Also in allocating
overheads to products, including inventory.
These often distort the picture leading to
wrong decisions.
• TOC tries to create simple, reliable rules for
decisions.
Inventory
• Inventory – all the money that the system has
invested in purchasing things it intends to sell.
• Operating Expenses – All the money the
system spends to turn inventory into
throughput.
• How will you treat investment in machinery
and depreciation in this method?
Goal of the firm now:
• Increase throughput,
While reducing Inventory
and Operating expense
____________________________
But what is priority in this case? If all three
cannot happen at the same time, how should
we prioritize?
Priority
• First, increase Throughput.
• Second, decrease Inventory.
• Third, decrease Operating Expense.
• This is counter intuitive.
• This is the opposite of what most companies will
do. Many would first cut Operating Expense, then
deal with inventory and finally would come to
Throughput.
T, I or OE
• Theoretically – I and OE have a limit below
which it cannot be reduced – a little above
zero.
• But Throughput can be increased –
theoretically there is no upper limit.
• Thus the best approach is to keep increasing T
primarily, while reducing I and OE as a
secondary priority.
Are our measures right?
• Let us also check if our 3 measures
corresponds to Profits, Profitability and Cash
flow.
How do T, I, and OE Relate to Net
Profit, ROI and Cash Flow
• Net Profit = T - OE
– As T increases so does profit
– As OE decreases profit increases
• ROI = (T - OE) / I
– As T increases so does ROI
– As OE and/or I decreases ROI increases
• Cash Flow = T- I - OE
– As T increases so does Cash Flow
– As OE and/or I decreases Cash Flow increases
How do T, I, and OE Relate to Net
Profit, ROI and Cash Flow?
Net Profit
increase
ROI
increase
Cash Flow
increase
T
increase
I
decrease
OE
decrease
Operational Measures
• For Operating managers it is easier to check
whether Throughput is increasing, inventory is
decreasing or Operating expense is decreasing
RATHER THAN
Check Profits / Profitability / Cash Flow.
Also, Productivity is – ALL ACTIONS THAT TAKE
YOU CLOSER TO YOUR GOAL.
Productive??
• To know whether you are productive – just
check if you are closer to your goals – meaning
• Is Throughput increasing?
• Is Inventory falling?
• Is Operating expense coming down?
• Basically – do not measure productivity as
output per labour hour / day etc.
Theory of Constraints
Part II
Tenets and Rules
System
• How would you define a SYSTEM?
A System is:
• A group of interacting, interrelated, or
interdependent elements forming a complex
whole and has a GOAL.
• Let us use this definition – meaning the
elements of the system have to work towards
the ‘common’ goal of the system – like a
business
System
• No part of the system can do what the system
does.
• Every subsystem has an impact on whether
other subsystems can perform well or not..
• Eg.. Human body – if your kidney is not
functioning well, Heart also cannot …
Tenets and Premises of Theory of
Constraints
• The Theory of Constraints is based on the
premise that:-
“Every real system, such as a business, must
have within it at least one constraint. If this
were not the case then the system could
produce unlimited amounts of whatever it
was striving for, profit in the case of a
business.……………….” Eli Goldratt
TOC – another angle
• The first major insight of TOC is :
Many of us believe that our “company” has several
constraints. I.e. if we ask as to why profits are not
increasing, we may come up with a list of 25 factors –
we will call them constraints which are holding us
back! Typically – we do not have good people, there
is too much attrition, factory is not delivering, we
have quality issues, distributor is not performing, we
are short of working capital etc.
TOC – another angle
• We believe that all of these are preventing us
from enhancing profits.
• TOC points out while most of them appear as
constraints, they are NOT constraints , as yet.
They may be potential constraints, but not yet
constraints.
TOC – another angle
• TOC does not promise to solve all problems. It
attempts to identify the leverage point in a
system and work on it.
• In any system there is a leverage point – the
point at which a slight improvement can make
a large improvement in profits of a company.
TOC calls the leverage point as the constraint.
TOC – Key insight
• TOC says that at any point in time there is only
one constraint which is holding the company back
( at most two ) and not 25.
• If you release the current constraint, then
something else will become a constraint. But at
the moment there is only one constraint.
• If you are improving anything other than the
constraint, there will be no improvement at all!!
• Literature points out that there are instances
where there is more than one constraint and in a
dynamic situation, it can even change.
Types of Constraints
• Physical – a) Can be internal to the company
like machine capacity or b) External market.
• Policy – we may have a policy which holds us
back (eg. No over time or don’t buy unless
the vendor gives credit of 60 days etc. If you
spot a Policy Constraint – eliminate it.
• Physical Constraint ?? Let us go further.
Five Focusing Steps of TOC
• Identify the constraint.
• Decide how to exploit the constraint
• Subordinate everything else to the decision
made in step 2.
• Elevate the constraint.
• If the constraint is broken in step 4, start over
and do not allow inertia to become a
constraint.
Looks simple ?
• But there are challenges – is it easy to agree
on what is the constraint?
• Exploiting the constraint is another issue.
• Subordinating everything else to the
constraint – this needs discipline.
• In most cases Elevating the Constraint can
actually wait. Exploiting the constraint, most
often brings 25 to 100% improvement in
performance.
Let us look at an example
• If you are not consciously aware of your
constraint, it is most likely that you are not
exploiting it fully!
• Eg. In many companies they say that Market is
their constraint – they can produce more if
required.
• But if you ask them – How many orders did
you fulfill ON TIME IN FULL last month? You
will not get a clear answer …
Eg,
• Assume Sales Price Rs. 100
• RM Costs 60
• OH 30
• Profit 10
• Total Demand is, say 100
• IF the company is fulfilling only 60% of the orders,
then ..
• Profit = 60 x 100 – (60 x 60) – (60 x 30) = Rs.600
• What will be the % increase in profits if they
increase their productivity to 80 ( i.e. by 33%)?
Eg.
• It will be huge:
• Profit now will be = 80 x 100 –( 80 x 60) - 1800
• = 1400
• Remember – OH will not increase from 1800
• The increase in profits is (1400 -600)/ 600
• = 133%
• i.e. a 33% increase in exploitation of the constraint ( or
increase in productivity) increases profit by 133%
• Most often, firms do not know what is their constraint
– particularly when the constraint is a POLICY !
TOC
• Theory of Constraints looks at the company as a
whole and asserts that the sum of local optima does
not lead to global optima.
• TOC states :
- Do not balance capacity – balance flow. ( We will
study this in the next module)
- Bottlenecks determine the level of output which can
be obtained from a system. Non bottleneck resource
utilization is not determined by its own potential but
by that of the constraint (bottleneck)
TOC
- an hour lost at a bottleneck is an hour lost for
the entire system.
- an hour lost on a NON BOTTLENECK has no
effect on the throughput.
- Bottlenecks govern throughput and inventory
in the system.
- Utilization and Activation of a resource is not
the same.
Some principles
• Some constraints are physical and others are
policy. Physical constraints are relatively easy
to eliminate. But policy constraints when
removed result in larger improvements.
• Inertia is the worst enemy of improvement.
• Ideas are NOT solutions. Implementation is
the key.
Thus …
• It is not in conflict with several other
improvement methodologies like TQM, TPM,
Lean manufacturing, Six Sigma etc.
• It attempts to focus these methodologies on
to the “constraint” rather than dissipating
energies in all directions.
• We can later study application of TOC to a
generic business situation – in Operations.
Theory of Constraints
Part III
Applying it to Operations /
Scheduling.
Production through the eyes of TOC
• Production or Operational Flow is any process where more than
one resource works on the same flow of product / service
• The “products” can be physical items, paper work, a service,
information; almost anything.
• It occurs everywhere in life, but let us consider a very basic
process flow
A B C D E F
The Nature of Production Flow
• If each resource has the average capacity as indicated and
• Each resource feeds the next, fully dependent resource at the
best possible rate,
• What do you expect the average output of this chain to be?
Capacity:
(Units per
Hour)
?
• Resource D has a capacity of only 10 units per hour and since
all the flow must go through it, the chain can only produce 10
units per hour
11 12 13 10 12 11
A B C D E F
What about wasted capacity savings?
• If we evaluate the same flow diagram in terms of waste,
where are we wasting?
1111 12 13 10 12 111
10
A B C D E F
• If Resource D and thus the chain can only produce 10 units per
hour, all the resources that has a capacity of more than 10 units
per hour has some excess capacity or “fat” and this could safely
be saved by trimming it off!
• If we assume an equal distribution of expenses, all excess
capacity can be trimmed quickly and thus realise an immediate
saving of more than 15% without affecting the output!
Perfectly Balanced Capacity
• This is what we intuitively want to achieve.
• The best balance of cost and capability to make the most money
• No wasted capacity
• A WELL BALANCED PLANT !!!
10 10 10 10 10 10
10
A B C D E F
But what about fluctuations?
• Will the day-to-day fluctuations average out over time?
• Will we see the intended savings materialise in real
bottom line results?
• Can we perhaps explain why so many companies do not
see their savings in real money terms?
10 10 10 10 10 10
10
A B C D E F
Let’s take a closer look !!!
What happens in the real world?
We all know that statistical variation is a reality
AND
Interdependency is a reality in a chain of dependent events
BUT
How does the COMBINATION of these two realities affect us in our
day-to-day management?
Statistical Fluctuation is Reality
The output of any resource fluctuates over time, e.g. at 10 units
per hour on average
OR?
Distribution in reality
10
0
12
10
8
Normal Distribution
10
8 12
Maximum and Minimum Output?
• What will the output be on an exceptionally good day?
• Perhaps 12 units per hour?
• And what will the output be on an exceptionally bad day?
• Zero units per hour!!
12
10
8
Distribution in reality
10
0
The probability of producing 10 or more
• Lets assume that each resource has a 50% probability of producing more than 10
units per hour
• What will the probability be that all the resources in the chain will be producing
more than 10 units per hour?
• .5 x.5 x.5 x.5 x.5 x.5 = 0.016 OR a 1.6% probability!
• The implication is that there is a 98.4% probability that the chain will produce less
than 10 units per hour
• Why this dramatic effect?
10 10 10 10 10 10
A B C D E F
10
Blockage and Starvation
• Whenever a resource performs less than the chain, every resource in front
of it has to slow down and
• Every resource after it sits waiting for work
10 10 10 #? 10 10
A B C D E F #?
• The whole chain performs only as fast as the momentarily
slowest resource – always!
• Interdependence is reality !!!!
Negative fluctuation results
in :
- downstream starvation and
- upstream blockage
How much will it produce on average?
10 10 10 10 10 10
?
A B C D E F
Assuming that each resource has an availability of 90% (a fair industrial
standard), the chain will produce:
Output of the chain = (.9 x .9 x .9 x .9 x .9 x .9) x 10
= 5.3 or 53%of design capacity
Availability
90%
• Six resources, each with a 90% availability, will produce on
average about 53% of design capacity in an interdependent chain
Blockage and Starvation
• Whenever a resource performs less than the chain, every resource in front
of it has to slow down and
• Every resource after it sits waiting for work
10 10 10 #? 10 10
A B C D E F #?
• The whole chain performs only as fast as the momentarily
slowest resource – always!
• Interdependence is reality !!!!
Negative fluctuation results
in :
- downstream starvation and
- upstream blockage
A B C D E F
98%
95%
98%
Chain output = (.98) x (.95) x (.98) = 91%
What should we do to get to 90% (or more)
What must be in place to keep D running
as close as possible to 100%?
- MAXIMISED AVAILABILITY (Maintenance)
- MAXIMISED ABILITY TO WORK (No blockage or starvation)
Protective Capacity
The drum-buffer-rope solution elements
A B C D E F Due date
Releasing material – the rope
Constraint buffer
management
Shipping buffer
management
Buffer
management
The drum and rope provide the “logistics” of the solution.
Buffer management (removing zone II holes) is the key to improvement.
The drum
schedule
Typical results achieved in operations
• Throughput - up 63%
• Due Date Performance – up 44%
• Inventory Levels – down 49%
• Lead Times – down 70%
• Implementation time - usually within a few months to a year.
Data from “The World of Theory of Constraints” by V. Mabin and
S. Balderstone, 2000.
Mean of published results excluding outliers eg. 600%
improvement by Lucent.
Note: Respondents in survey mostly from US & Europe.
Theory of Constraints
• The constraint determines Throughput (the
rate at which a company makes money
through sales.)
• An hour lost on the constraint is an hour lost
for the system.
• An hour saved on a non-constraint is a mirage.
Five Focusing Steps of TOC
• Identify the constraint.
• Decide how to exploit the constraint
• Subordinate everything else to the decision
made in step 2.
• Elevate the constraint.
• If the constraint is broken in step 4, start over
and do not allow inertia to become a
constraint.
How do we Exploit the Constraint on
the Shop Floor?
• We now know that the constraint must run at
100% efficiency to make the most money.
• Question: Should the non-constraints be
required to run at 100% capacity?
• The answer is: NO! If non-constraint
resources run at 100% capacity, then WIP is
increased.
Drum-Buffer-Rope
• Production scheduling system following TOC
principles.
• It is a hybrid push/pull system.
• The purpose DBR is to exploit the constraint.
A Few Points
• How will you decide on set ups? Will you have
more set ups or less??
• Will this rule be different for bottlenecks and
non bottlenecks?
• Where should the buffers be kept?
• Where there is excess capacity – time itself is
a buffer - Your Comments??
Set ups
• Bottlenecks – fewer set ups and larger batch
sizes – so that more of its “productive
capacity” is available.
• Non bottlenecks – more set ups and smaller
batch sizes – reduce inventory and improve
cycle times.
Buffers
• As we discussed earlier:
We need a buffer for protecting the capacity of
the bottleneck.
If we have capacity larger than our requirement,
we can have a buffer at the end – i.e. just before
the market – this will improve our delivery
performance.
How will you schedule orders?
• Imagine the same kind of plant which we
studied – with D as the constraint.. How will
you schedule various orders??
• Basically – use delivery deadlines and figure
out as to when the order has to pass through
the constraint – D.
• i.e. Schedule the constraint first.
• Then figure our release of orders at A such
that a small buffer is built in front of D
Scheduling
• i.e. D is now capable of working without
waiting.
• Ensure that the plant is operated this way.
• Post D – the orders are processed in the same
sequence as it comes out of F and delivered to
the market. If it is possible build a buffer after
F.. So that orders are ready a little before they
have to be shipped.
Is a Constraint bad??
• What do you think??
• With a constraint, you are able to plan and
execute very well.
Configuration of Plants
• Due to shortage of time, we are not discussing
various configurations of manufacturing
plants.
• Just to run them through quickly – there are
predominantly 4 types of production
organizations :
Plant Configurations - V
E F G H I
B C D
A
Plant Configurations - A
E F G H I
B C D
A
Plant Configurations - T
D E
A B C F
G H
Plant Configurations - I
A B C D E
A B C D E
A B C D E
Plant Configurations
• The characteristics of these plants are
different from each other and hence the way
we use TOC to schedule and control both –
operations and buffers will also be different.
Finding the Bottleneck
• In a plant full of machines, where is the
bottleneck?
– Consistently High Load / Utilization
– Queues
– Expediting
Theory of Constraints
Part 4
Applying TOC to Supply Chain – A
brief study
Supply Chain
• Let us study a typical Supply Chain situation:
• Vendor
• manufacturer
• warehouses
• distributors
• retailer
• customer.
Typical Problems
• Customer goes to a retail shop and asks for a
particular SKU and does not find it.
• ( How many SKUs do you think that a typical
company – say in FMCG industry have? – include
different products, variants, sizes, etc.)
• Distributor in one part of the country has too
much of SKU X and another distributor in another
part of the country is running short of X and is
complaining!
Typical problems
• Company has created several SKUs – a few
hundreds, but distributors and retailers stock only
a fraction of these SKUs – Many SKUs do not get
customer exposure. ( Why do you think that this
happens? Why is the distributor / retailer not
willing to stock more SKUs??)
• Forecasts are collected all across the sales
hierarchy in order to create a production plan,
but forecasts are not accurate enough. Shortages
and surpluses keep occurring.
Typical Problems
• In spite of huge pipeline stocks, stock outs
keep occurring.
• What do you think will be the amount of sales
lost because the requested product is not
available at the retail outlet ??
Typical Problems
• Further complications occur because of
seasonality, competitor activity, Schemes and
Promotional offers, Advertising campaigns….
• The net result is supply and demand are not
well matched.
• Do you think that there is a capacity shortage
in FMCG industry??
Therefore the Constraint is ..
• The market – the constraint is external
• If market is the constraint – what would
exploiting the constraint mean??
Exploiting the Constraint
• Supplying every customer who comes and
asks for our company’s product immediately is
the meaning of exploiting the constraint.
• Now we have arrived at a classical conflict.
• Already we have a lot of inventory / to be
profitable we have to reduce inventory
• At the same time, We cannot meet varying
customer requirement without increasing
inventory!!
A simplified solution
• To keep this module short, let us do a
simplified analysis and arrive at a solution.
• Shall we blame the forecast? If only we had an
accurate forecast of the sale of each SKU in
each of the outlets …..
• Do you think that this is realistic??
• TOC thinking process asks us to focus on the
conflict and uncover underlying assumptions.
Simplified Solution
• Just now we concluded that ‘perfect forecast’
is not possible. BUT – can we forecast better,
sales in an area? In a state? In a region? In the
whole country??
• Surely – the accuracy of a national forecast
will be several times more accurate compared
to a forecast of a smaller market. Typically the
forecast quality improves by a square root of
the number of markets you aggregate.
What do we do intuitively?
• The moment we produce goods we want to
move it from the factory ( It does not have to
be a manufacturing situation – the same is
true for a warehouse – we try to move the
goods down the supply chain the moment we
receive it). This is intuitively our idea of
efficiency.
TOC – counter intuitive solution
• TOC says – why should you move goods from a
place where you have higher forecast accuracy to
a place of lower forecast accuracy in a hurry?
• Remember – once goods leave, it is very difficult
to bring it back or ship it to another location – eg.
You will rarely move excess stock from MP into
Andhra Pradesh – sales tax, octroi, transportation
costs, adjustments needed in invoicing,
documentation … etc are deterrents.
TOC says
• Build a large warehouse at the factory – keep
goods there.
• Further down the supply chain keep lower
quantities and replenish more often. BUT
more larger number of SKUs (Remember, we
have to exploit the constraint…. Customer
asking for a specific SKU !!)
BUT …
• Who will pay the extra freight charges??
• Why will distributors and retailers agree to
buying more SKUs??
• It has now been proven that freight costs do
not increase much and the huge reduction in
inventories ( when you aggregate inventories,
you are able to reduce the overall inventories).
Also,
• Your distributors & retailers do not buy several
SKUs for two reasons:
• 1) I do not want to invest more money on your
products.
• 2) I do not get replenishment of fast moving
products when I want – so I order more of it.
• You have a better chance of convincing them if
you replenish faster. Lower number of units, but
more SKUs can be accommodated in the same
level of ‘investment’.
Controlling the inventory
• At each stage in the supply chain, for specific
SKUs we need to work out inventory levels.
Divide these inventory levels into – Green ,
yellow and Red levels – as long as inventory is
in green region – Ok / Yellow check if next lot
Is coming – RED – expedite.
Controlling Inventory
• If you are often getting into RED zone , your
buffers are low – increase it.
• If you are all the time in Green Zone – your
buffers are too high , reduce it.
___________________________________
What about SEASONALITY? Ahead of the season
increase the buffers by a factor based on your
experience and after the season, bring down
the buffer stock.
What about growth in Sales?
• The inventory buffer levels are dynamic – as
we said, if you keep getting to RED zone often,
you need to increase it and if it does not go
below the GREEN at all, then reduce it.
• What happened to FORECAST ACCURACY?
• I need Forecast for Aggregate Planning,
Capacity Planning etc.. But for day to day
production planning, I look at reduction in
stock levels in the plant warehouse!!

Introduction to Theory of Constraints 2023.pptx

  • 1.
    Why Study TOC? •You can show dramatic improvements • You can solve complex problems – using TOC Thinking Process • You can plan for using resources effectively and also improve your system. • Most methods either help you plan or improve your system – TOC can help you do both.
  • 2.
    Introduction to Theoryof Constraints R Raghavendra Ravi July 2023
  • 3.
    Theory of Constraints •Theory of Constraints (TOC) is a body of knowledge developed by Dr Eliyahu Goldratt. • Most people believe that TOC is applicable only to Operations – this is not true. • TOC is based on Systems Theory (A system cannot be understood by understanding the components of the system). • TOC can be applied to several situations – Supply Chain, Projects, Sales, …
  • 4.
    Theory of Constraints •For those of you who are interested in studying application of TOC is varied fields: • Theory of Constraints Handbook 1st Edition • by James Cox (Author), John Schleier (Author) • This book contains chapters dedicated to different applications.
  • 5.
    Theory of Constraints •TOC is based on rigorous cause and effect analysis of situations. • TOC is often counter intuitive. • In many ways, it is not a new theory, but it looks at old theories with a new lens. • More Practitioner led than academic – hence not many research papers. • Many Heuristics • Some would like to call this as “Constraint Management” than Theory
  • 6.
    Our Course • Thereare 4 blocks in our course: • 1) Basic Tenets of TOC • 2) Drum Buffer Rope (DBR): Application of TOC to processes – we will study DBR application to a)Production or Service Process, b) distribution , c) Projects • Please revise your 1st year chapters on Process Analysis, Distribution and PERT etc.
  • 7.
    Our Course • 3)Throughput Accounting – this has implications for many managerial decisions like Product Mix, Make or Buy, Pricing, Investments, Performance evaluation etc, • This is largely based on relevant costing approaches. • It differs with Standard Costing, Activity Based Costing etc.
  • 8.
    Our course • 4)TOC Thinking Process • This is a fundamental contribution made by Goldratt towards problem solving. • This module will be taught by Prof Harshal Lowalekar in sessions 11 to 20. • TOC TP enables you to verbalize your understanding of a situation and arrive at a consensus on What is the problem?
  • 9.
    Our course • TOCThinking Process: • Often consensus does not exist in an organization – different people have different perceptions regarding the problem. • TOC TP is a structured method of verbalizing the problem and a systematic approach to using our intuition to solve the problem. • More on this a little later in the course.
  • 10.
    Theory of Constraints •TOC also relies heavily on other management theories and methods – but, at times looks at it differently. • It is not in conflict with Six Sigma or TQM or Lean or any such methodology which are all aimed at process level improvements. • TOC is a system level approach. • We can also combine some of these approaches with TOC.
  • 11.
    Theory of Constraints PartI Goals, Measurement, Throughput, Inventory and Operating Expense.
  • 12.
    Theory of Constraints •The Theory of Constraints (TOC) is a body of knowledge that has been developed over the past twenty years by Dr Eliyahu Goldratt and other practitioners. This body of knowledge challenges many of the assumptions about how we currently manage our businesses and organisations. It is based on the logic of cause and effect and has been derived from the hard sciences.
  • 13.
    Theory of Constraints •It is often counter intuitive. • Eg. Theory of Constraints looks at the company as a whole and asserts that the sum of local optima does not lead to global optima. • We often think that if every part of a company is working at its best, then the whole company will be working at its best!!
  • 14.
    Theory of Constraints •TOC also relies heavily on other management theories and methods – but, at times looks at it differently. In fact one of the reviews says that TOC is refocuses some of the existing theories. • It is not in conflict with Six Sigma or TQM or Lean or any such methodology which are all aimed at process level improvements. • TOC is a system level approach.
  • 15.
    Theory of Constraints •“The Goal” Published in 1980 By Goldratt explains several principles of Theory of Constraints. • Book describes how Scheduling, use of resources & inventories are all going wrong. • Faulty understanding, faulty performance measurements, wrong view of cost data, traditional view of usage of assets and people lead businesses into wrong decisions.
  • 16.
    Theory of Constraints •Since The Goal talks about a manufacturing situation – people think TOC is about manufacturing. • Goldratt wrote : Goal II – exploring supply chain problems Critical Chain – he applies TOC to Project Management Necessary but not Sufficient – is about IT Theory of Constraints can be applied to any system and hence is not restricted to a function or field
  • 17.
    Why Study TOC •Useful body of knowledge • Interesting analytical approach for managers • Very powerful in the hands of a good Consultant. Can show some quick results without much investments. • Looks at business (or a system) as a whole and not functional / divisional. An integrated view. (This sometimes causes problems. Many Organizations are run in a Fragmented manner)
  • 18.
    Example • Imagine thata Plant implements TOC and improves productivity and output by 20%. • With all these improvements, Sales of the company goes up by say 20%. Now Sales is above budget. • What happens to the “excess people” in the plant now? • Unless we are willing to push Sales team beyond their +20%, the firm may end up downsizing the plant ! • These are risks associated with implementing TOC in a firm which has not fully understood impact of TOC
  • 19.
    Goal of aFirm • A business or a company can talk of several goals – Customer satisfaction, technology leadership, Commitment to Quality, employee happiness, being a responsible Corporate Citizen etc. • None of these are sustainable without profit. • While all the goals are necessary, Profit alone will allow us to sustain the company in providing Customer satisfaction …..etc.
  • 20.
    Goals of aFirm • But we are seeking profits for the long term and hence TOCs premise is: GOAL OF A FIRM IS TO MAKE MONEY NOW AND IN THE FUTURE. Even if you do not agree, we can use this statement of the goal of the firm for our study now.
  • 21.
    Performance Measurements • Generallyaccepted measures : *NET PROFIT - Absolute measurement in Rs./$ *RETURN ON INVESTMENT/ASSETS/ EQUITY/CAPITAL EMPLOYED – a relative measure. *CASH FLOW – without this, you do not survive. So how do we judge our managerial decisions?
  • 22.
    Judging Managerial Decisions •If any decision improves – Profits, Profitability & Cash Flow – then those decisions are right. • But can an operating manager get these data to judge whether he is on right track? • You get such reports from “Finance” once in a quarter …. Too late for decision making. • So, What do we do?
  • 23.
    A word onCash Flow • If you have cash flow, even if you are not profitable, you will survive for some time. BUT without cash flow, even if you have profits, you will collapse. • Several companies, without planning, lock up cash in investments, inventories etc. Or do not collect – allowing accounts receivable to rise and rise.
  • 24.
    Performance Measurement • Atthe Operational level, we cannot use profit, profitability and cash flow for day to day decisions. • Then what else can guide us to the right decisions? • TOC suggests: 1) Throughput 2) Inventory & 3) Operating expenses
  • 25.
    Performance Measurement • Throughput- the rate at which a company makes money through sales (Cash coming in should increase) Notice the emphasis on “through sales” – it does not recognize “inventory profits” of “manufacturing profit” Throughput is defined as Sales price less bought outs ( raw materials and services) – labour cost, machine hours etc. ignored.
  • 26.
    Throughput • The ideais: “Producing” without selling simply increases INVENTORY and CONSUMES CASH. * Several businesses value finished goods inventory and WIP – with “value added” and this leads to severe distortions. Often, inventory becomes unsalable and is scrapped.
  • 27.
    Throughput • Notice thatwe are not including labour, depreciation, administrative expenses etc. Too much time is spent in classifying expenses as direct and indirect. Also in allocating overheads to products, including inventory. These often distort the picture leading to wrong decisions. • TOC tries to create simple, reliable rules for decisions.
  • 28.
    Inventory • Inventory –all the money that the system has invested in purchasing things it intends to sell. • Operating Expenses – All the money the system spends to turn inventory into throughput. • How will you treat investment in machinery and depreciation in this method?
  • 29.
    Goal of thefirm now: • Increase throughput, While reducing Inventory and Operating expense ____________________________ But what is priority in this case? If all three cannot happen at the same time, how should we prioritize?
  • 30.
    Priority • First, increaseThroughput. • Second, decrease Inventory. • Third, decrease Operating Expense. • This is counter intuitive. • This is the opposite of what most companies will do. Many would first cut Operating Expense, then deal with inventory and finally would come to Throughput.
  • 31.
    T, I orOE • Theoretically – I and OE have a limit below which it cannot be reduced – a little above zero. • But Throughput can be increased – theoretically there is no upper limit. • Thus the best approach is to keep increasing T primarily, while reducing I and OE as a secondary priority.
  • 32.
    Are our measuresright? • Let us also check if our 3 measures corresponds to Profits, Profitability and Cash flow.
  • 33.
    How do T,I, and OE Relate to Net Profit, ROI and Cash Flow • Net Profit = T - OE – As T increases so does profit – As OE decreases profit increases • ROI = (T - OE) / I – As T increases so does ROI – As OE and/or I decreases ROI increases • Cash Flow = T- I - OE – As T increases so does Cash Flow – As OE and/or I decreases Cash Flow increases
  • 34.
    How do T,I, and OE Relate to Net Profit, ROI and Cash Flow? Net Profit increase ROI increase Cash Flow increase T increase I decrease OE decrease
  • 35.
    Operational Measures • ForOperating managers it is easier to check whether Throughput is increasing, inventory is decreasing or Operating expense is decreasing RATHER THAN Check Profits / Profitability / Cash Flow. Also, Productivity is – ALL ACTIONS THAT TAKE YOU CLOSER TO YOUR GOAL.
  • 36.
    Productive?? • To knowwhether you are productive – just check if you are closer to your goals – meaning • Is Throughput increasing? • Is Inventory falling? • Is Operating expense coming down? • Basically – do not measure productivity as output per labour hour / day etc.
  • 37.
    Theory of Constraints PartII Tenets and Rules
  • 38.
    System • How wouldyou define a SYSTEM?
  • 39.
    A System is: •A group of interacting, interrelated, or interdependent elements forming a complex whole and has a GOAL. • Let us use this definition – meaning the elements of the system have to work towards the ‘common’ goal of the system – like a business
  • 40.
    System • No partof the system can do what the system does. • Every subsystem has an impact on whether other subsystems can perform well or not.. • Eg.. Human body – if your kidney is not functioning well, Heart also cannot …
  • 41.
    Tenets and Premisesof Theory of Constraints • The Theory of Constraints is based on the premise that:- “Every real system, such as a business, must have within it at least one constraint. If this were not the case then the system could produce unlimited amounts of whatever it was striving for, profit in the case of a business.……………….” Eli Goldratt
  • 42.
    TOC – anotherangle • The first major insight of TOC is : Many of us believe that our “company” has several constraints. I.e. if we ask as to why profits are not increasing, we may come up with a list of 25 factors – we will call them constraints which are holding us back! Typically – we do not have good people, there is too much attrition, factory is not delivering, we have quality issues, distributor is not performing, we are short of working capital etc.
  • 43.
    TOC – anotherangle • We believe that all of these are preventing us from enhancing profits. • TOC points out while most of them appear as constraints, they are NOT constraints , as yet. They may be potential constraints, but not yet constraints.
  • 44.
    TOC – anotherangle • TOC does not promise to solve all problems. It attempts to identify the leverage point in a system and work on it. • In any system there is a leverage point – the point at which a slight improvement can make a large improvement in profits of a company. TOC calls the leverage point as the constraint.
  • 45.
    TOC – Keyinsight • TOC says that at any point in time there is only one constraint which is holding the company back ( at most two ) and not 25. • If you release the current constraint, then something else will become a constraint. But at the moment there is only one constraint. • If you are improving anything other than the constraint, there will be no improvement at all!! • Literature points out that there are instances where there is more than one constraint and in a dynamic situation, it can even change.
  • 46.
    Types of Constraints •Physical – a) Can be internal to the company like machine capacity or b) External market. • Policy – we may have a policy which holds us back (eg. No over time or don’t buy unless the vendor gives credit of 60 days etc. If you spot a Policy Constraint – eliminate it. • Physical Constraint ?? Let us go further.
  • 47.
    Five Focusing Stepsof TOC • Identify the constraint. • Decide how to exploit the constraint • Subordinate everything else to the decision made in step 2. • Elevate the constraint. • If the constraint is broken in step 4, start over and do not allow inertia to become a constraint.
  • 48.
    Looks simple ? •But there are challenges – is it easy to agree on what is the constraint? • Exploiting the constraint is another issue. • Subordinating everything else to the constraint – this needs discipline. • In most cases Elevating the Constraint can actually wait. Exploiting the constraint, most often brings 25 to 100% improvement in performance.
  • 49.
    Let us lookat an example • If you are not consciously aware of your constraint, it is most likely that you are not exploiting it fully! • Eg. In many companies they say that Market is their constraint – they can produce more if required. • But if you ask them – How many orders did you fulfill ON TIME IN FULL last month? You will not get a clear answer …
  • 50.
    Eg, • Assume SalesPrice Rs. 100 • RM Costs 60 • OH 30 • Profit 10 • Total Demand is, say 100 • IF the company is fulfilling only 60% of the orders, then .. • Profit = 60 x 100 – (60 x 60) – (60 x 30) = Rs.600 • What will be the % increase in profits if they increase their productivity to 80 ( i.e. by 33%)?
  • 51.
    Eg. • It willbe huge: • Profit now will be = 80 x 100 –( 80 x 60) - 1800 • = 1400 • Remember – OH will not increase from 1800 • The increase in profits is (1400 -600)/ 600 • = 133% • i.e. a 33% increase in exploitation of the constraint ( or increase in productivity) increases profit by 133% • Most often, firms do not know what is their constraint – particularly when the constraint is a POLICY !
  • 52.
    TOC • Theory ofConstraints looks at the company as a whole and asserts that the sum of local optima does not lead to global optima. • TOC states : - Do not balance capacity – balance flow. ( We will study this in the next module) - Bottlenecks determine the level of output which can be obtained from a system. Non bottleneck resource utilization is not determined by its own potential but by that of the constraint (bottleneck)
  • 53.
    TOC - an hourlost at a bottleneck is an hour lost for the entire system. - an hour lost on a NON BOTTLENECK has no effect on the throughput. - Bottlenecks govern throughput and inventory in the system. - Utilization and Activation of a resource is not the same.
  • 54.
    Some principles • Someconstraints are physical and others are policy. Physical constraints are relatively easy to eliminate. But policy constraints when removed result in larger improvements. • Inertia is the worst enemy of improvement. • Ideas are NOT solutions. Implementation is the key.
  • 55.
    Thus … • Itis not in conflict with several other improvement methodologies like TQM, TPM, Lean manufacturing, Six Sigma etc. • It attempts to focus these methodologies on to the “constraint” rather than dissipating energies in all directions. • We can later study application of TOC to a generic business situation – in Operations.
  • 56.
    Theory of Constraints PartIII Applying it to Operations / Scheduling.
  • 57.
    Production through theeyes of TOC • Production or Operational Flow is any process where more than one resource works on the same flow of product / service • The “products” can be physical items, paper work, a service, information; almost anything. • It occurs everywhere in life, but let us consider a very basic process flow A B C D E F
  • 58.
    The Nature ofProduction Flow • If each resource has the average capacity as indicated and • Each resource feeds the next, fully dependent resource at the best possible rate, • What do you expect the average output of this chain to be? Capacity: (Units per Hour) ? • Resource D has a capacity of only 10 units per hour and since all the flow must go through it, the chain can only produce 10 units per hour 11 12 13 10 12 11 A B C D E F
  • 59.
    What about wastedcapacity savings? • If we evaluate the same flow diagram in terms of waste, where are we wasting? 1111 12 13 10 12 111 10 A B C D E F • If Resource D and thus the chain can only produce 10 units per hour, all the resources that has a capacity of more than 10 units per hour has some excess capacity or “fat” and this could safely be saved by trimming it off! • If we assume an equal distribution of expenses, all excess capacity can be trimmed quickly and thus realise an immediate saving of more than 15% without affecting the output!
  • 60.
    Perfectly Balanced Capacity •This is what we intuitively want to achieve. • The best balance of cost and capability to make the most money • No wasted capacity • A WELL BALANCED PLANT !!! 10 10 10 10 10 10 10 A B C D E F
  • 61.
    But what aboutfluctuations? • Will the day-to-day fluctuations average out over time? • Will we see the intended savings materialise in real bottom line results? • Can we perhaps explain why so many companies do not see their savings in real money terms? 10 10 10 10 10 10 10 A B C D E F Let’s take a closer look !!!
  • 62.
    What happens inthe real world? We all know that statistical variation is a reality AND Interdependency is a reality in a chain of dependent events BUT How does the COMBINATION of these two realities affect us in our day-to-day management?
  • 63.
    Statistical Fluctuation isReality The output of any resource fluctuates over time, e.g. at 10 units per hour on average OR? Distribution in reality 10 0 12 10 8 Normal Distribution 10 8 12
  • 64.
    Maximum and MinimumOutput? • What will the output be on an exceptionally good day? • Perhaps 12 units per hour? • And what will the output be on an exceptionally bad day? • Zero units per hour!! 12 10 8 Distribution in reality 10 0
  • 65.
    The probability ofproducing 10 or more • Lets assume that each resource has a 50% probability of producing more than 10 units per hour • What will the probability be that all the resources in the chain will be producing more than 10 units per hour? • .5 x.5 x.5 x.5 x.5 x.5 = 0.016 OR a 1.6% probability! • The implication is that there is a 98.4% probability that the chain will produce less than 10 units per hour • Why this dramatic effect? 10 10 10 10 10 10 A B C D E F 10
  • 66.
    Blockage and Starvation •Whenever a resource performs less than the chain, every resource in front of it has to slow down and • Every resource after it sits waiting for work 10 10 10 #? 10 10 A B C D E F #? • The whole chain performs only as fast as the momentarily slowest resource – always! • Interdependence is reality !!!! Negative fluctuation results in : - downstream starvation and - upstream blockage
  • 67.
    How much willit produce on average? 10 10 10 10 10 10 ? A B C D E F Assuming that each resource has an availability of 90% (a fair industrial standard), the chain will produce: Output of the chain = (.9 x .9 x .9 x .9 x .9 x .9) x 10 = 5.3 or 53%of design capacity Availability 90% • Six resources, each with a 90% availability, will produce on average about 53% of design capacity in an interdependent chain
  • 68.
    Blockage and Starvation •Whenever a resource performs less than the chain, every resource in front of it has to slow down and • Every resource after it sits waiting for work 10 10 10 #? 10 10 A B C D E F #? • The whole chain performs only as fast as the momentarily slowest resource – always! • Interdependence is reality !!!! Negative fluctuation results in : - downstream starvation and - upstream blockage
  • 69.
    A B CD E F 98% 95% 98% Chain output = (.98) x (.95) x (.98) = 91% What should we do to get to 90% (or more) What must be in place to keep D running as close as possible to 100%? - MAXIMISED AVAILABILITY (Maintenance) - MAXIMISED ABILITY TO WORK (No blockage or starvation) Protective Capacity
  • 70.
    The drum-buffer-rope solutionelements A B C D E F Due date Releasing material – the rope Constraint buffer management Shipping buffer management Buffer management The drum and rope provide the “logistics” of the solution. Buffer management (removing zone II holes) is the key to improvement. The drum schedule
  • 71.
    Typical results achievedin operations • Throughput - up 63% • Due Date Performance – up 44% • Inventory Levels – down 49% • Lead Times – down 70% • Implementation time - usually within a few months to a year. Data from “The World of Theory of Constraints” by V. Mabin and S. Balderstone, 2000. Mean of published results excluding outliers eg. 600% improvement by Lucent. Note: Respondents in survey mostly from US & Europe.
  • 72.
    Theory of Constraints •The constraint determines Throughput (the rate at which a company makes money through sales.) • An hour lost on the constraint is an hour lost for the system. • An hour saved on a non-constraint is a mirage.
  • 73.
    Five Focusing Stepsof TOC • Identify the constraint. • Decide how to exploit the constraint • Subordinate everything else to the decision made in step 2. • Elevate the constraint. • If the constraint is broken in step 4, start over and do not allow inertia to become a constraint.
  • 74.
    How do weExploit the Constraint on the Shop Floor? • We now know that the constraint must run at 100% efficiency to make the most money. • Question: Should the non-constraints be required to run at 100% capacity? • The answer is: NO! If non-constraint resources run at 100% capacity, then WIP is increased.
  • 75.
    Drum-Buffer-Rope • Production schedulingsystem following TOC principles. • It is a hybrid push/pull system. • The purpose DBR is to exploit the constraint.
  • 76.
    A Few Points •How will you decide on set ups? Will you have more set ups or less?? • Will this rule be different for bottlenecks and non bottlenecks? • Where should the buffers be kept? • Where there is excess capacity – time itself is a buffer - Your Comments??
  • 77.
    Set ups • Bottlenecks– fewer set ups and larger batch sizes – so that more of its “productive capacity” is available. • Non bottlenecks – more set ups and smaller batch sizes – reduce inventory and improve cycle times.
  • 78.
    Buffers • As wediscussed earlier: We need a buffer for protecting the capacity of the bottleneck. If we have capacity larger than our requirement, we can have a buffer at the end – i.e. just before the market – this will improve our delivery performance.
  • 79.
    How will youschedule orders? • Imagine the same kind of plant which we studied – with D as the constraint.. How will you schedule various orders?? • Basically – use delivery deadlines and figure out as to when the order has to pass through the constraint – D. • i.e. Schedule the constraint first. • Then figure our release of orders at A such that a small buffer is built in front of D
  • 80.
    Scheduling • i.e. Dis now capable of working without waiting. • Ensure that the plant is operated this way. • Post D – the orders are processed in the same sequence as it comes out of F and delivered to the market. If it is possible build a buffer after F.. So that orders are ready a little before they have to be shipped.
  • 81.
    Is a Constraintbad?? • What do you think?? • With a constraint, you are able to plan and execute very well.
  • 82.
    Configuration of Plants •Due to shortage of time, we are not discussing various configurations of manufacturing plants. • Just to run them through quickly – there are predominantly 4 types of production organizations :
  • 83.
    Plant Configurations -V E F G H I B C D A
  • 84.
    Plant Configurations -A E F G H I B C D A
  • 85.
    Plant Configurations -T D E A B C F G H
  • 86.
    Plant Configurations -I A B C D E A B C D E A B C D E
  • 87.
    Plant Configurations • Thecharacteristics of these plants are different from each other and hence the way we use TOC to schedule and control both – operations and buffers will also be different.
  • 88.
    Finding the Bottleneck •In a plant full of machines, where is the bottleneck? – Consistently High Load / Utilization – Queues – Expediting
  • 89.
    Theory of Constraints Part4 Applying TOC to Supply Chain – A brief study
  • 90.
    Supply Chain • Letus study a typical Supply Chain situation: • Vendor • manufacturer • warehouses • distributors • retailer • customer.
  • 91.
    Typical Problems • Customergoes to a retail shop and asks for a particular SKU and does not find it. • ( How many SKUs do you think that a typical company – say in FMCG industry have? – include different products, variants, sizes, etc.) • Distributor in one part of the country has too much of SKU X and another distributor in another part of the country is running short of X and is complaining!
  • 92.
    Typical problems • Companyhas created several SKUs – a few hundreds, but distributors and retailers stock only a fraction of these SKUs – Many SKUs do not get customer exposure. ( Why do you think that this happens? Why is the distributor / retailer not willing to stock more SKUs??) • Forecasts are collected all across the sales hierarchy in order to create a production plan, but forecasts are not accurate enough. Shortages and surpluses keep occurring.
  • 93.
    Typical Problems • Inspite of huge pipeline stocks, stock outs keep occurring. • What do you think will be the amount of sales lost because the requested product is not available at the retail outlet ??
  • 94.
    Typical Problems • Furthercomplications occur because of seasonality, competitor activity, Schemes and Promotional offers, Advertising campaigns…. • The net result is supply and demand are not well matched. • Do you think that there is a capacity shortage in FMCG industry??
  • 95.
    Therefore the Constraintis .. • The market – the constraint is external • If market is the constraint – what would exploiting the constraint mean??
  • 96.
    Exploiting the Constraint •Supplying every customer who comes and asks for our company’s product immediately is the meaning of exploiting the constraint. • Now we have arrived at a classical conflict. • Already we have a lot of inventory / to be profitable we have to reduce inventory • At the same time, We cannot meet varying customer requirement without increasing inventory!!
  • 98.
    A simplified solution •To keep this module short, let us do a simplified analysis and arrive at a solution. • Shall we blame the forecast? If only we had an accurate forecast of the sale of each SKU in each of the outlets ….. • Do you think that this is realistic?? • TOC thinking process asks us to focus on the conflict and uncover underlying assumptions.
  • 99.
    Simplified Solution • Justnow we concluded that ‘perfect forecast’ is not possible. BUT – can we forecast better, sales in an area? In a state? In a region? In the whole country?? • Surely – the accuracy of a national forecast will be several times more accurate compared to a forecast of a smaller market. Typically the forecast quality improves by a square root of the number of markets you aggregate.
  • 100.
    What do wedo intuitively? • The moment we produce goods we want to move it from the factory ( It does not have to be a manufacturing situation – the same is true for a warehouse – we try to move the goods down the supply chain the moment we receive it). This is intuitively our idea of efficiency.
  • 101.
    TOC – counterintuitive solution • TOC says – why should you move goods from a place where you have higher forecast accuracy to a place of lower forecast accuracy in a hurry? • Remember – once goods leave, it is very difficult to bring it back or ship it to another location – eg. You will rarely move excess stock from MP into Andhra Pradesh – sales tax, octroi, transportation costs, adjustments needed in invoicing, documentation … etc are deterrents.
  • 102.
    TOC says • Builda large warehouse at the factory – keep goods there. • Further down the supply chain keep lower quantities and replenish more often. BUT more larger number of SKUs (Remember, we have to exploit the constraint…. Customer asking for a specific SKU !!)
  • 103.
    BUT … • Whowill pay the extra freight charges?? • Why will distributors and retailers agree to buying more SKUs?? • It has now been proven that freight costs do not increase much and the huge reduction in inventories ( when you aggregate inventories, you are able to reduce the overall inventories).
  • 104.
    Also, • Your distributors& retailers do not buy several SKUs for two reasons: • 1) I do not want to invest more money on your products. • 2) I do not get replenishment of fast moving products when I want – so I order more of it. • You have a better chance of convincing them if you replenish faster. Lower number of units, but more SKUs can be accommodated in the same level of ‘investment’.
  • 105.
    Controlling the inventory •At each stage in the supply chain, for specific SKUs we need to work out inventory levels. Divide these inventory levels into – Green , yellow and Red levels – as long as inventory is in green region – Ok / Yellow check if next lot Is coming – RED – expedite.
  • 106.
    Controlling Inventory • Ifyou are often getting into RED zone , your buffers are low – increase it. • If you are all the time in Green Zone – your buffers are too high , reduce it. ___________________________________ What about SEASONALITY? Ahead of the season increase the buffers by a factor based on your experience and after the season, bring down the buffer stock.
  • 107.
    What about growthin Sales? • The inventory buffer levels are dynamic – as we said, if you keep getting to RED zone often, you need to increase it and if it does not go below the GREEN at all, then reduce it. • What happened to FORECAST ACCURACY? • I need Forecast for Aggregate Planning, Capacity Planning etc.. But for day to day production planning, I look at reduction in stock levels in the plant warehouse!!