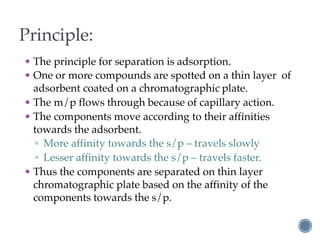
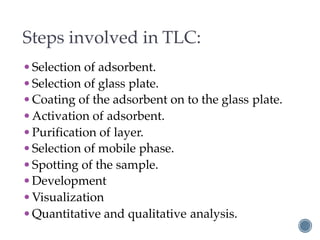
Thin Layer
Chromatography
Prepared By: Ms. Navdha Soni
LJ Institute of Pharmacy
Ahmedabad
Introduction:
•Thin layer chromatography was first discovered
by Izmailov and Schreiber in 1938. Further Stahl
(1958) perfected the method and developed
equipment and standardized adsorbents for the
preparation of uniform layers on glass plates.
And this technique, chromatography using thin
layers of an adsorbent held on a glass plate or
other supporting medium is called as thin layer
chromatography.
Definition:
•Thin layer of chromatography is a method if
analysis in which the stationary phase (a finely
divided solid) is spread as a thin layer on a
rigid supporting plate and mobile phase.
•TLC is often named by other names such as
drop, strip, spread layer, surface
chromatography and open column
chromatography.
Superiority of TLC over other
chromatographic technique:
• Simple equipment. Low cost.
• Short development time.
• Separation of micro gram of the substances can be
achieved.
• Any type of compound can be analyzed.
• Wide choice of stationary phase. May b employed
for adsorption, partition (reversed phase also) or ion
exchange chromatography.
• Early recovery of separated components.
• Easy visualization.
• Sensitivity is better 10 to 100 times paper
chromatography.
• Variable thickness of thin layers.
• Chemically inert stationary phase.
Principle:
• The principle for separation is adsorption.
• One or more compounds are spotted on a thin layer of
adsorbent coated on a chromatographic plate.
• The m/p flows through because of capillary action.
• The components move according to their affinities
towards the adsorbent.
▫ More affinity towards the s/p – travels slowly
▫ Lesser affinity towards the s/p – travels faster.
• Thus the components are separated on thin layer
chromatographic plate based on the affinity of the
components towards the s/p.
Steps involved in TLC:
•Selection of adsorbent.
•Selection of glass plate.
•Coating of the adsorbent on to the glass plate.
•Activation of adsorbent.
•Purification of layer.
•Selection of mobile phase.
•Spotting of the sample.
•Development
•Visualization
•Quantitative and qualitative analysis.
Selection of adsorbent:
• A large no. of coating materials are available.
• Adsorbents classified into:
Adsorbent:
Acidic:
E.g. silica
For acidic analytes
Basic:
E.g. alumina
For basic analytes
Neutral:
E.g. keisleguhr,
Cellulose powder.
For neutral analytes
Adsorbent:
active
Has more active
sites for binding to
the analyte.
inactive
Has less active
sites for the
binding of analyte.
• As stationary phase a special finely ground matrix is
coated on the glass plate, a metal or a plastic film as a
thin layer ( approx 0.25mm).
• Adsorbent doesn’t adhere to plate properly. To
overcome this problem binders are used like gypsum,
starch, hydrated silicon dioxide etc are added to the
adsorbent. E.g. Silica gel G 60, where G indicates
gypsum and 60 is particle size.
• A fluorescent indicator like zinc silicate are added to the
adsorbent to simplify visualization of spot. The
advantage is non fluorescent U.V absorbing analytes
can be detected on a thin layer containing fluorescent
additive.
▫ E.g. silica gel GF
• Such substances show up as dark spots as green
fluorescent indicator.
Glass plates:
• Glass plates which are specific dimensions like 20cm
× 20cm (full plate), 20cm × 10cm (half plate), 20cm ×
5cm (quarter plate).
• Microscopic slides can also be used for some
applications like monitoring the progress of
chemical reaction. The development time is much
shorter like 5mins.
• They should withstand temperatures used for
drying the plates.
Coating of adsorbent on glass plate:
• Main aim is to get uniform thickness of the layer.
• Many techniques are used:
• Pouring:
▫ Measured amount of slurry is poured and plate is
tipped back and forth to spread uniformly.
▫ Disadvantage – uniform thickness cannot be
ensured.
• Dipping:
▫ Whole plate is dipped into slurry.
▫ Disadvantage – backside of plate is also coated and
more amount of slurry is required even to prepare
fewer plates.
• Spraying:
▫ Suspension of adsorbent is sprayed onto plate.
▫ Disadvantage – uniform thickness cannot ne
achieved.
• Spreading:
▫ Widely used.
▫ The slurry after preparation poured into a TLC
spreader and the thickness of layer is adjusted
by adjusting a knob in the spreader.
▫ Now the spreader is rolled on the plate or the plate is
moved while applying the slurry .
▫ Thickness of 0 – 2mm (0.25 for analytical purposes
and 2mm for preparative purpose).
• Pre coated plate:
▫ Ready to use thin layers are now available pre coated.
▫ These are expensive
▫ Thickness varies from 0.1 to 0.2mm.
Activation of adsorbent:
• Coated plates are kept in air for 30 min and then in hot
air oven at 110°C for another 30 min.
• The dried plates can be stored in thermostatically
controlled oven or in desiccators and can be used
when required.
Purification or washing of plates:
• Silica gel contains iron as impurity which causes a
considerable distortion of chromatograph.
• To purify the air dried plates are given a preliminary
development with methanol-conc. Hcl (9:1, v/v). The
iron gets migrated with solvent front to the upper
edge of the plate.
• The plates are again dried and activated.
• Washing can be done for precoated TLC plates also.
Selection of mobile phase:
• The chemical nature if the sample that is to be
separated is known then it is possible to know a
suitable solvents by using original stalh’s triangle
which is inter-relating adsorbent activity, nature of the
solute and nature of the solvent.
• If the triangle is rotated so that at corner M points to the
type of mixture to be separated, this specifies at
corners S and E respectively, the necessary activity of
the adsorbent and the optimum polarity of the eluent.
• Suppose a mixture has hydrocarbons and ketones.
Then from stahl’s triangle, it is found that an active
adsorbent is required, together with a non polar
solvent.
• Mixtures of two or more solvents of different
polarity often give better separation than
chemically homogenous solvents.
• They should be as pure as possible.
Application of sample:
• Concentration of the sample or standard solution should
has to be minimum.
• The spots should be at least 2cm above the base of the
plate and spotting area should not be immersed in
m/p.
• Agla micro syringe is used for quantitative work,
however capillary tubes can be used for qualitative
work.
• To spot the plate, simply touch the capillary tube end to
the coated side of the plate. The solvent should quickly
evaporate leaving mixture behind on the plate.
• Excessive spotting leads to smearing, smudging and
spot overlap will result making identification of
separated components difficult.
Development:
Development tank:
• Different chambers of different sizes are used to hold
TLC plates
• Different development tanks are available
▫ Flat bottom chambers
▫ Twin trough chambers – it require less solvent and
two plates can be developed.
▫ Cylindrical tanks
• Chamber saturation should be done.
• Tank should be lined inside with filtered paper
moistened with m/p so as to saturate with
atmosphere.
• If chamber saturation is not done edge effect occurs.
• Edge effect: where the solvent front moves faster
in middle of the plate than that of the edges.
Therefore spots are distorted and not regular.
• One dimensional development or vertical :
▫ Conventional method
▫ Solvent flows against gravity, because of capillary
action. (bottom to top).
• Horizontal TLC:
▫ plate is kept in horizontal manner.
▫ Spotting is done in middle of the plate and m/p is
added slowly through sides.
• Descending TLC:
▫ Flow of solvent is assisted by gravity and hence
development is
faster.
▫ Solvent holder is on top.
• Multiple development TLC:
§ ▫ Similar to vertical TLC.
§ ▫ After developing once, the plate is dried and
then again kept in same mobile phase (same
composition) and in same direction.
§ ▫ Without detection multiple developments are done.
§ ▫ It is done to separate some complex
mixture ( more no. of compounds).
•Step wise TLC:
▫ Plate size is bigger 30cm plate.
▫ Usually done when development distance is long.
▫ Development:
– Allow first m/p to travel upto 15 to 18cm and then
it is stopped and dried.
– Now it is again kept in another m/p and
development is done.
• Two-dimensional TLC:
▫ First the plates are developed in one axis and the
plates after drying are developed in other axis.
▫ When large number of compounds or complex
mixtures are need to be separated this method can be
followed.
▫ Either same solvent or different solvent system can
be used.
• Gradient TLC:
▫ Isocratic – same composition of m/p used throughout
development .
▫ Gradient – ratio of m/p changed.
• Fractionating TLC:
▫ Spotting is done in the middle at top of the plate and
the m/p is forced though the edges of the plate.
▫ Different fractions are collected at different times
based the affinity of the analyte towards the
adsorbent.
Visualization:
• Colored spots can be visually detected. But for
detecting colorless spots, the following techniques
are used:
• Non specific methods: no. of spots can be detected
but not exact nature or type of compound.
▫ Iodine chamber method : where brown or amber
colored spots are observed when the paper are kept
in a tank with few iodine crystals at the bottom.
▫ UV chamber for fluorescent compounds: when
viewed under UV chamber at 254 or at 365 nm,
fluorescent compounds can be detected.
• Specific methods: specific spray or detecting or
visualizing agents are used to find out the nature of
compound or for identification purposes.
▫ Eg.
– Fecl3 for phenolic and tannin compounds
– ninhydrin for amino acids.
• The detecting techniques can also be categorized as:
▫ Destructive technique: when specific spray agents
are used the samples are destroyed before detection.
– Eg. Ninhydrin reagent
▫ Non destructive technique: methods like UV
chamber, iodine chamber, densitometry method
doesn’t destroy the sample even after detection.
Qualitative analysis:
• Rf value:
▫ Rf= dist travelled by solute/dist travelled by
solvent front
▫ value ranges from 0-1
▫ Ideal values are 0.3-0.8.
▫ It is characteristic to each compound in a particular
combination of sp and mp.
▫ The unknown compound can be identified
by comparing its rf values with standard’s.
▫ if rf = 1 – analyte move along with m/p
without separating.
▫ If rf = 0.1 – analyte is adsorbed to adsorbent and not
moving.
• Rx value:
▫ Distance travelled by sample/dist travelled by
standard.
▫ It is always closer to 1.
▫ m/p allowed to travel throughout the plate.
• Rm values:
▫ To find whether compounds belong to a
homologous series.
▫ It is a combined value.
▫ Delta Rm = log (1/Rf – 1).
Quantitative analysis:
• Can be carried out in two ways:
• Direct method: quantitative determination is
undertaken directly on the layer.
• Indirect method: the substances are removed from
the adsorbent and then determined after elution.
• Direct methods:
▫ Visual assessment of chromatogram.
▫ Determination by measurement of spot area – this
method is based on a relation between spot and
amount of the substance present.
▫ Quantitative TLC incorporating densitometer.
▫ Direct spectrophotometry on thin layer-
– By evaluation of wavelength of maximum
absorbance.
– Characterization of chromatogram zones by reading
the absorption or fluorescence curves directly from
TLC is done by chromatogram spectrophotometer
introduced by zeiss, stahl and jork.
• Indirect method:
▫ Done after eluting the individual spots with
suitable solvent and then filtering off the
stationary phase.
▫ The exact quantity of compounds can be
determined by conventional methods like
colorimetry, uv spectrophotometry, fluorimetry,
flame photometry, electrochemical methods of
analysis.
▫ The spotted area is scooped using certain
apparatus.
Applications:
• TLC is very commonly used technique in
synthetic chemistry for identifying compounds,
determining their purity and the progress of a
reaction.
• Separation of vitamins, antibiotics, proteins,
alkaloids, glycosides.
• Identification of drugs e.g. amino caproic acid,
digitoxin, levodopa.
• Detecting the decomposition products in drug.
• Separation of inorganic ions
• Identification of organic compounds
▫ Even no. alcohols from decanol through
hexacosanolcan be separated on keiselguhr G
with cyclohexane as a developing solvent
Thank You

Thin layer chromatography ns

  • 1.
    Thin Layer Chromatography Prepared By:Ms. Navdha Soni LJ Institute of Pharmacy Ahmedabad
  • 2.
    Introduction: •Thin layer chromatographywas first discovered by Izmailov and Schreiber in 1938. Further Stahl (1958) perfected the method and developed equipment and standardized adsorbents for the preparation of uniform layers on glass plates. And this technique, chromatography using thin layers of an adsorbent held on a glass plate or other supporting medium is called as thin layer chromatography.
  • 3.
    Definition: •Thin layer ofchromatography is a method if analysis in which the stationary phase (a finely divided solid) is spread as a thin layer on a rigid supporting plate and mobile phase. •TLC is often named by other names such as drop, strip, spread layer, surface chromatography and open column chromatography.
  • 4.
    Superiority of TLCover other chromatographic technique: • Simple equipment. Low cost. • Short development time. • Separation of micro gram of the substances can be achieved. • Any type of compound can be analyzed. • Wide choice of stationary phase. May b employed for adsorption, partition (reversed phase also) or ion exchange chromatography. • Early recovery of separated components. • Easy visualization. • Sensitivity is better 10 to 100 times paper chromatography. • Variable thickness of thin layers. • Chemically inert stationary phase.
  • 5.
    Principle: • The principlefor separation is adsorption. • One or more compounds are spotted on a thin layer of adsorbent coated on a chromatographic plate. • The m/p flows through because of capillary action. • The components move according to their affinities towards the adsorbent. ▫ More affinity towards the s/p – travels slowly ▫ Lesser affinity towards the s/p – travels faster. • Thus the components are separated on thin layer chromatographic plate based on the affinity of the components towards the s/p.
  • 6.
    Steps involved inTLC: •Selection of adsorbent. •Selection of glass plate. •Coating of the adsorbent on to the glass plate. •Activation of adsorbent. •Purification of layer. •Selection of mobile phase. •Spotting of the sample. •Development •Visualization •Quantitative and qualitative analysis.
  • 7.
    Selection of adsorbent: •A large no. of coating materials are available. • Adsorbents classified into:
  • 8.
    Adsorbent: Acidic: E.g. silica For acidicanalytes Basic: E.g. alumina For basic analytes Neutral: E.g. keisleguhr, Cellulose powder. For neutral analytes Adsorbent: active Has more active sites for binding to the analyte. inactive Has less active sites for the binding of analyte.
  • 9.
    • As stationaryphase a special finely ground matrix is coated on the glass plate, a metal or a plastic film as a thin layer ( approx 0.25mm). • Adsorbent doesn’t adhere to plate properly. To overcome this problem binders are used like gypsum, starch, hydrated silicon dioxide etc are added to the adsorbent. E.g. Silica gel G 60, where G indicates gypsum and 60 is particle size. • A fluorescent indicator like zinc silicate are added to the adsorbent to simplify visualization of spot. The advantage is non fluorescent U.V absorbing analytes can be detected on a thin layer containing fluorescent additive. ▫ E.g. silica gel GF • Such substances show up as dark spots as green fluorescent indicator.
  • 10.
    Glass plates: • Glassplates which are specific dimensions like 20cm × 20cm (full plate), 20cm × 10cm (half plate), 20cm × 5cm (quarter plate). • Microscopic slides can also be used for some applications like monitoring the progress of chemical reaction. The development time is much shorter like 5mins. • They should withstand temperatures used for drying the plates.
  • 11.
    Coating of adsorbenton glass plate: • Main aim is to get uniform thickness of the layer. • Many techniques are used: • Pouring: ▫ Measured amount of slurry is poured and plate is tipped back and forth to spread uniformly. ▫ Disadvantage – uniform thickness cannot be ensured. • Dipping: ▫ Whole plate is dipped into slurry. ▫ Disadvantage – backside of plate is also coated and more amount of slurry is required even to prepare fewer plates. • Spraying: ▫ Suspension of adsorbent is sprayed onto plate. ▫ Disadvantage – uniform thickness cannot ne achieved.
  • 12.
    • Spreading: ▫ Widelyused. ▫ The slurry after preparation poured into a TLC spreader and the thickness of layer is adjusted by adjusting a knob in the spreader. ▫ Now the spreader is rolled on the plate or the plate is moved while applying the slurry . ▫ Thickness of 0 – 2mm (0.25 for analytical purposes and 2mm for preparative purpose). • Pre coated plate: ▫ Ready to use thin layers are now available pre coated. ▫ These are expensive ▫ Thickness varies from 0.1 to 0.2mm.
  • 14.
    Activation of adsorbent: •Coated plates are kept in air for 30 min and then in hot air oven at 110°C for another 30 min. • The dried plates can be stored in thermostatically controlled oven or in desiccators and can be used when required.
  • 15.
    Purification or washingof plates: • Silica gel contains iron as impurity which causes a considerable distortion of chromatograph. • To purify the air dried plates are given a preliminary development with methanol-conc. Hcl (9:1, v/v). The iron gets migrated with solvent front to the upper edge of the plate. • The plates are again dried and activated. • Washing can be done for precoated TLC plates also.
  • 16.
    Selection of mobilephase: • The chemical nature if the sample that is to be separated is known then it is possible to know a suitable solvents by using original stalh’s triangle which is inter-relating adsorbent activity, nature of the solute and nature of the solvent. • If the triangle is rotated so that at corner M points to the type of mixture to be separated, this specifies at corners S and E respectively, the necessary activity of the adsorbent and the optimum polarity of the eluent.
  • 17.
    • Suppose amixture has hydrocarbons and ketones. Then from stahl’s triangle, it is found that an active adsorbent is required, together with a non polar solvent. • Mixtures of two or more solvents of different polarity often give better separation than chemically homogenous solvents. • They should be as pure as possible.
  • 18.
    Application of sample: •Concentration of the sample or standard solution should has to be minimum. • The spots should be at least 2cm above the base of the plate and spotting area should not be immersed in m/p. • Agla micro syringe is used for quantitative work, however capillary tubes can be used for qualitative work. • To spot the plate, simply touch the capillary tube end to the coated side of the plate. The solvent should quickly evaporate leaving mixture behind on the plate. • Excessive spotting leads to smearing, smudging and spot overlap will result making identification of separated components difficult.
  • 19.
    Development: Development tank: • Differentchambers of different sizes are used to hold TLC plates • Different development tanks are available ▫ Flat bottom chambers ▫ Twin trough chambers – it require less solvent and two plates can be developed. ▫ Cylindrical tanks • Chamber saturation should be done. • Tank should be lined inside with filtered paper moistened with m/p so as to saturate with atmosphere. • If chamber saturation is not done edge effect occurs. • Edge effect: where the solvent front moves faster in middle of the plate than that of the edges. Therefore spots are distorted and not regular.
  • 21.
    • One dimensionaldevelopment or vertical : ▫ Conventional method ▫ Solvent flows against gravity, because of capillary action. (bottom to top). • Horizontal TLC: ▫ plate is kept in horizontal manner. ▫ Spotting is done in middle of the plate and m/p is added slowly through sides. • Descending TLC: ▫ Flow of solvent is assisted by gravity and hence development is faster. ▫ Solvent holder is on top.
  • 22.
    • Multiple developmentTLC: § ▫ Similar to vertical TLC. § ▫ After developing once, the plate is dried and then again kept in same mobile phase (same composition) and in same direction. § ▫ Without detection multiple developments are done. § ▫ It is done to separate some complex mixture ( more no. of compounds).
  • 23.
    •Step wise TLC: ▫Plate size is bigger 30cm plate. ▫ Usually done when development distance is long. ▫ Development: – Allow first m/p to travel upto 15 to 18cm and then it is stopped and dried. – Now it is again kept in another m/p and development is done. • Two-dimensional TLC: ▫ First the plates are developed in one axis and the plates after drying are developed in other axis. ▫ When large number of compounds or complex mixtures are need to be separated this method can be followed. ▫ Either same solvent or different solvent system can be used.
  • 24.
    • Gradient TLC: ▫Isocratic – same composition of m/p used throughout development . ▫ Gradient – ratio of m/p changed. • Fractionating TLC: ▫ Spotting is done in the middle at top of the plate and the m/p is forced though the edges of the plate. ▫ Different fractions are collected at different times based the affinity of the analyte towards the adsorbent.
  • 25.
    Visualization: • Colored spotscan be visually detected. But for detecting colorless spots, the following techniques are used: • Non specific methods: no. of spots can be detected but not exact nature or type of compound. ▫ Iodine chamber method : where brown or amber colored spots are observed when the paper are kept in a tank with few iodine crystals at the bottom. ▫ UV chamber for fluorescent compounds: when viewed under UV chamber at 254 or at 365 nm, fluorescent compounds can be detected.
  • 26.
    • Specific methods:specific spray or detecting or visualizing agents are used to find out the nature of compound or for identification purposes. ▫ Eg. – Fecl3 for phenolic and tannin compounds – ninhydrin for amino acids. • The detecting techniques can also be categorized as: ▫ Destructive technique: when specific spray agents are used the samples are destroyed before detection. – Eg. Ninhydrin reagent ▫ Non destructive technique: methods like UV chamber, iodine chamber, densitometry method doesn’t destroy the sample even after detection.
  • 27.
    Qualitative analysis: • Rfvalue: ▫ Rf= dist travelled by solute/dist travelled by solvent front ▫ value ranges from 0-1 ▫ Ideal values are 0.3-0.8. ▫ It is characteristic to each compound in a particular combination of sp and mp. ▫ The unknown compound can be identified by comparing its rf values with standard’s. ▫ if rf = 1 – analyte move along with m/p without separating. ▫ If rf = 0.1 – analyte is adsorbed to adsorbent and not moving.
  • 28.
    • Rx value: ▫Distance travelled by sample/dist travelled by standard. ▫ It is always closer to 1. ▫ m/p allowed to travel throughout the plate. • Rm values: ▫ To find whether compounds belong to a homologous series. ▫ It is a combined value. ▫ Delta Rm = log (1/Rf – 1).
  • 29.
    Quantitative analysis: • Canbe carried out in two ways: • Direct method: quantitative determination is undertaken directly on the layer. • Indirect method: the substances are removed from the adsorbent and then determined after elution. • Direct methods: ▫ Visual assessment of chromatogram. ▫ Determination by measurement of spot area – this method is based on a relation between spot and amount of the substance present. ▫ Quantitative TLC incorporating densitometer. ▫ Direct spectrophotometry on thin layer- – By evaluation of wavelength of maximum absorbance. – Characterization of chromatogram zones by reading the absorption or fluorescence curves directly from TLC is done by chromatogram spectrophotometer introduced by zeiss, stahl and jork.
  • 30.
    • Indirect method: ▫Done after eluting the individual spots with suitable solvent and then filtering off the stationary phase. ▫ The exact quantity of compounds can be determined by conventional methods like colorimetry, uv spectrophotometry, fluorimetry, flame photometry, electrochemical methods of analysis. ▫ The spotted area is scooped using certain apparatus.
  • 31.
    Applications: • TLC isvery commonly used technique in synthetic chemistry for identifying compounds, determining their purity and the progress of a reaction. • Separation of vitamins, antibiotics, proteins, alkaloids, glycosides. • Identification of drugs e.g. amino caproic acid, digitoxin, levodopa. • Detecting the decomposition products in drug. • Separation of inorganic ions • Identification of organic compounds ▫ Even no. alcohols from decanol through hexacosanolcan be separated on keiselguhr G with cyclohexane as a developing solvent
  • 32.