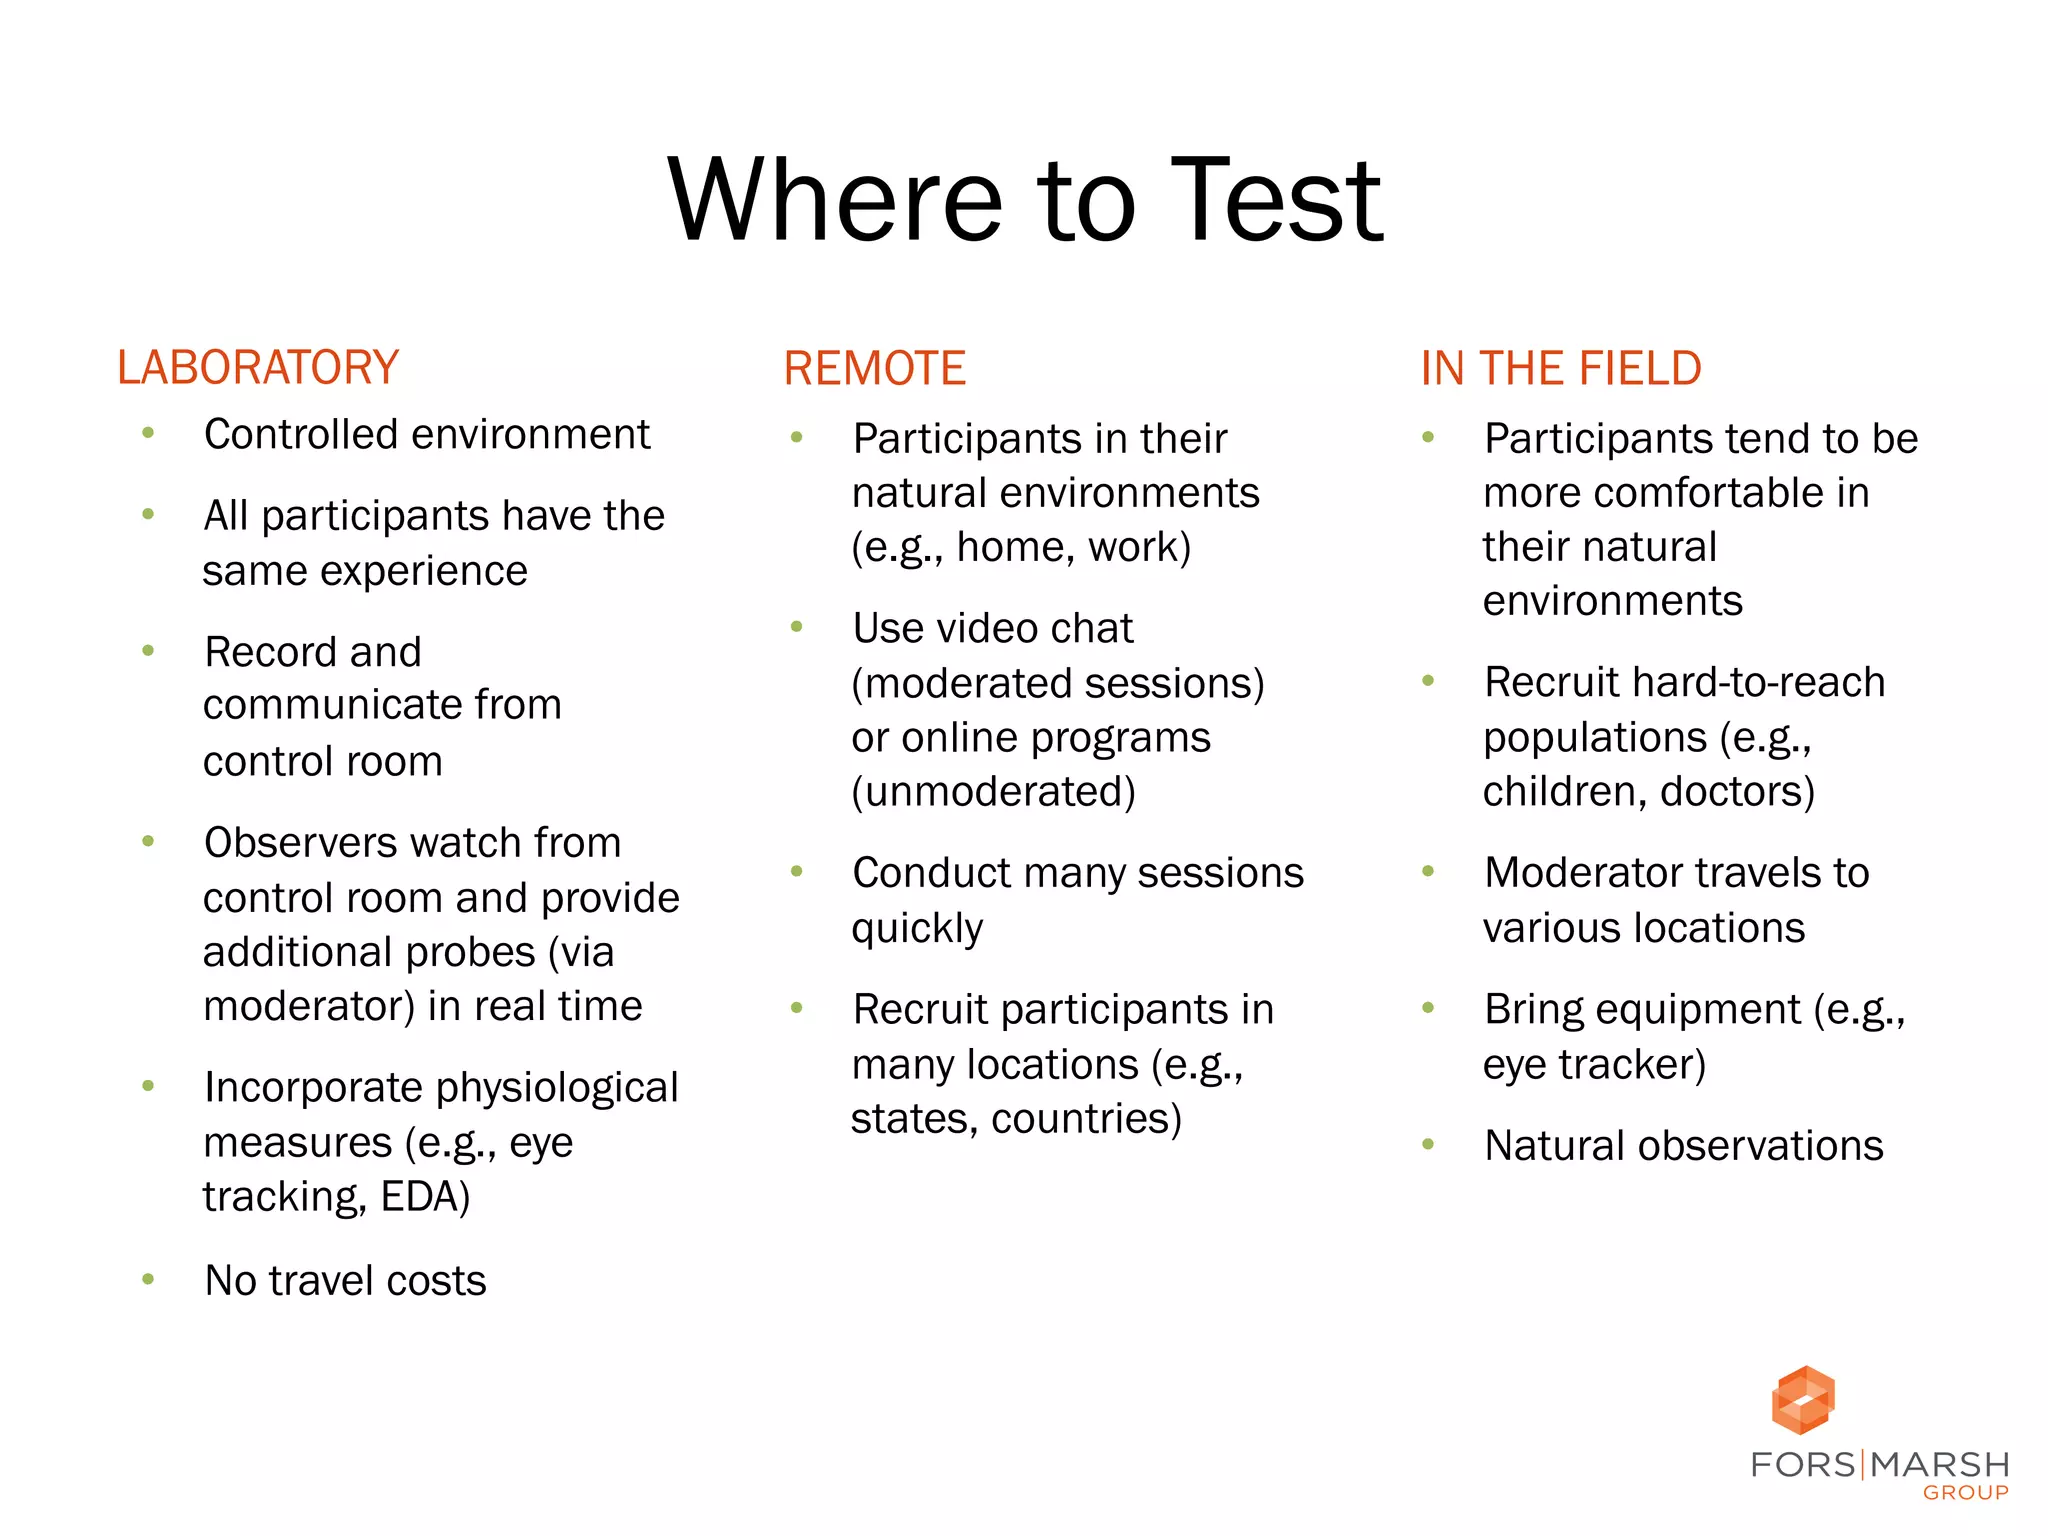
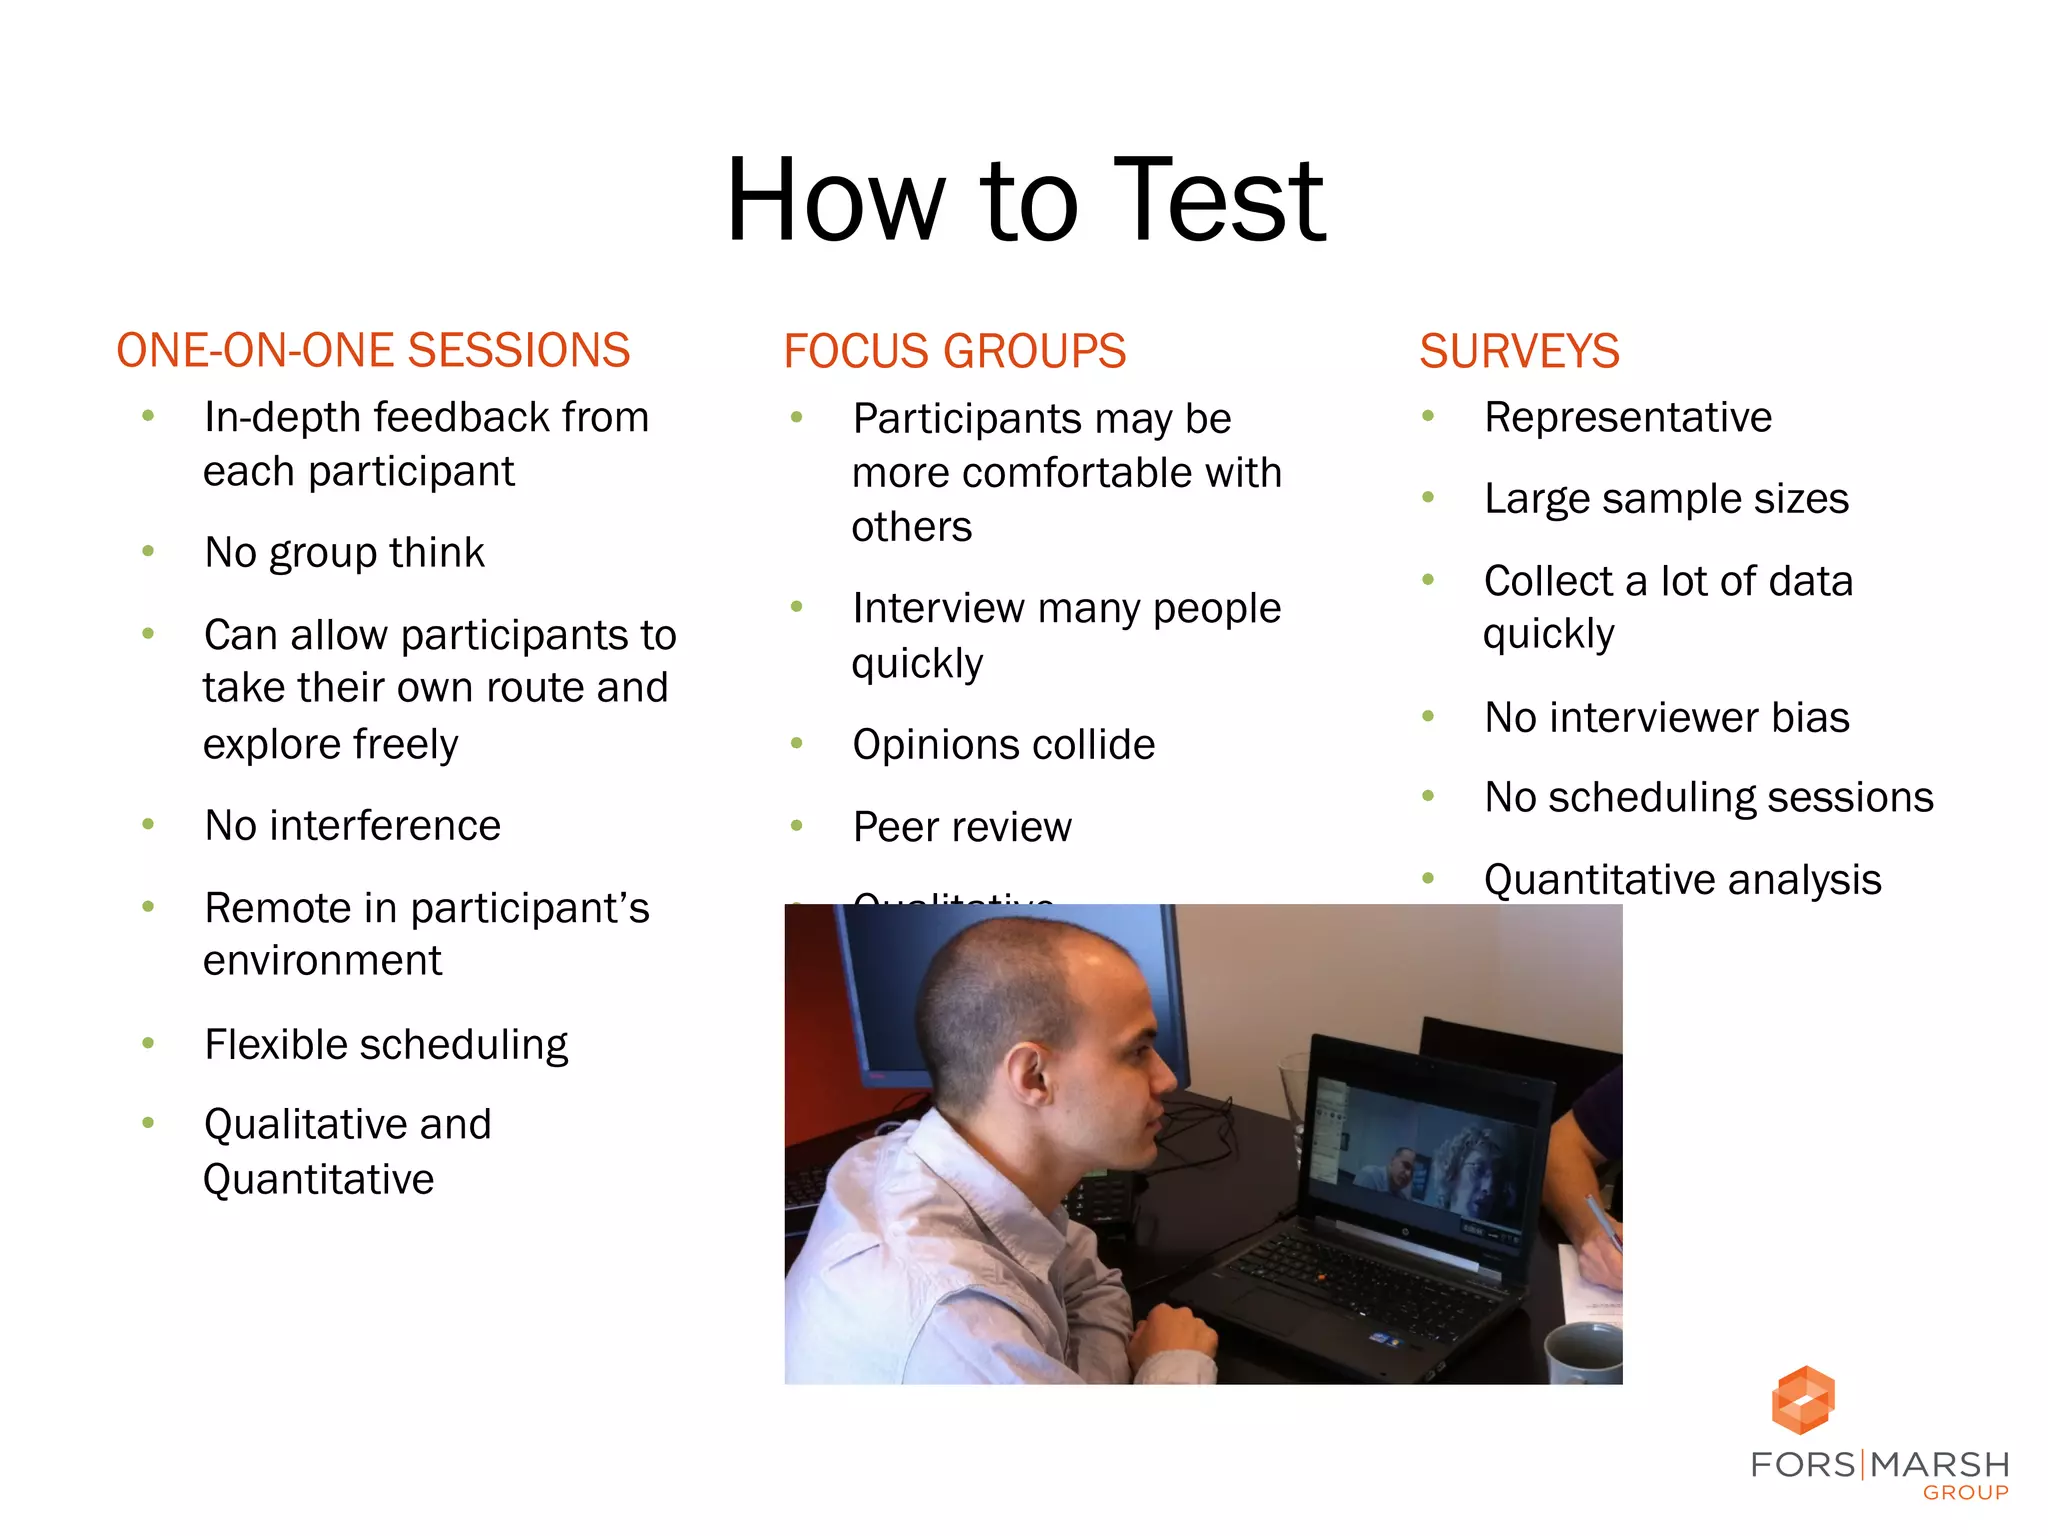
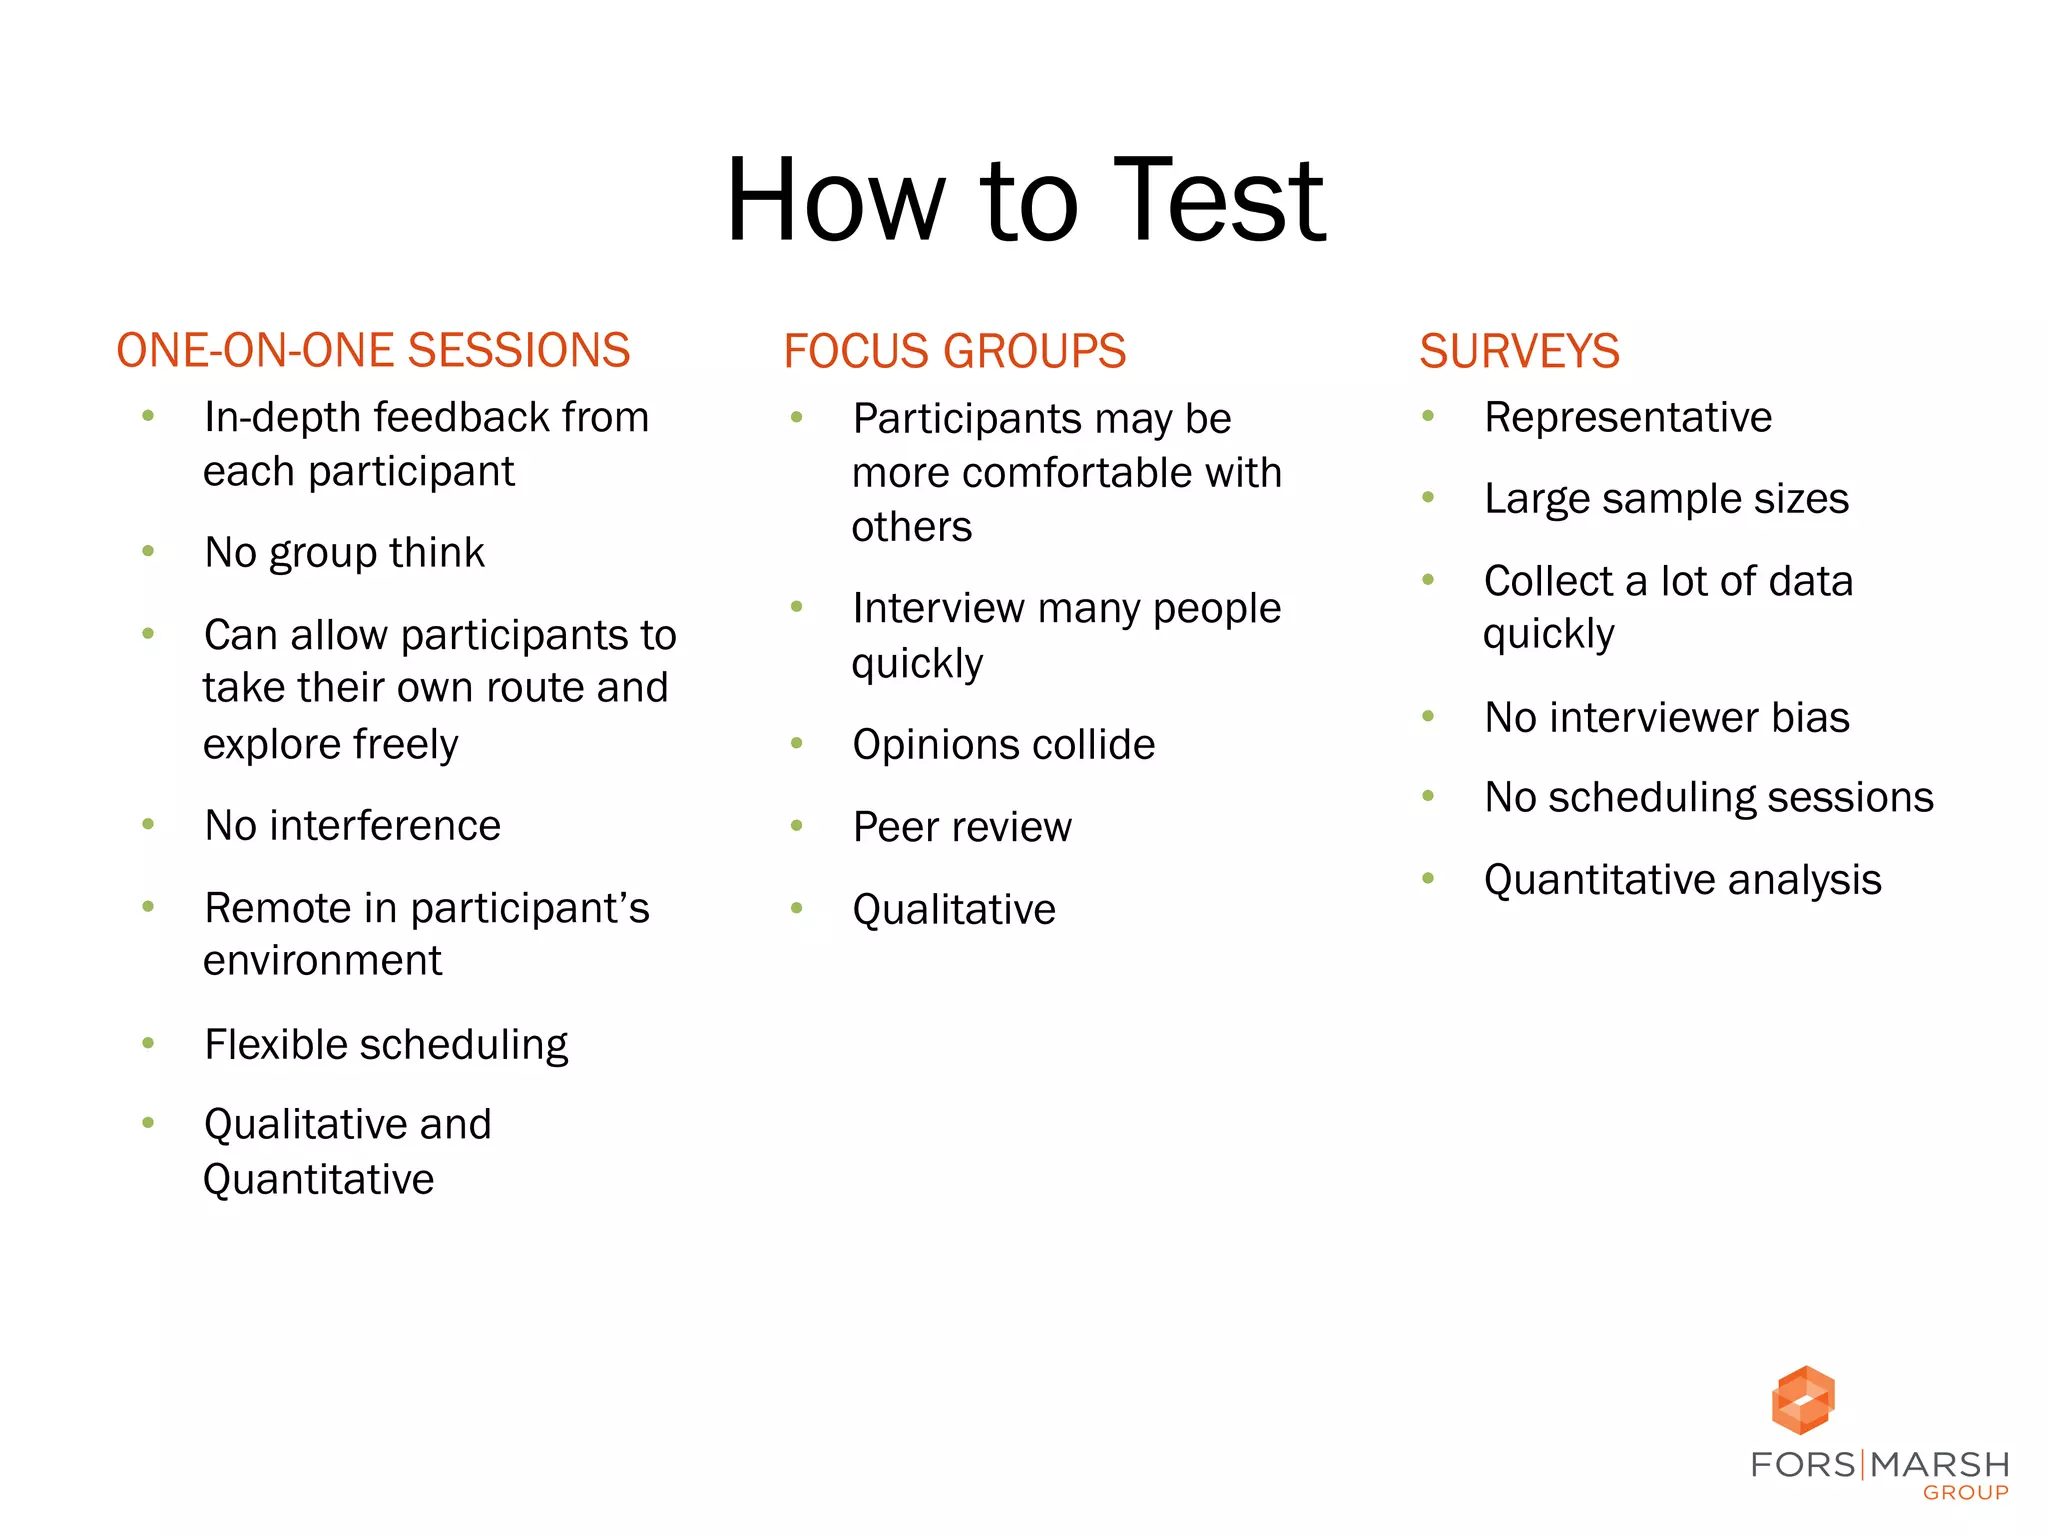
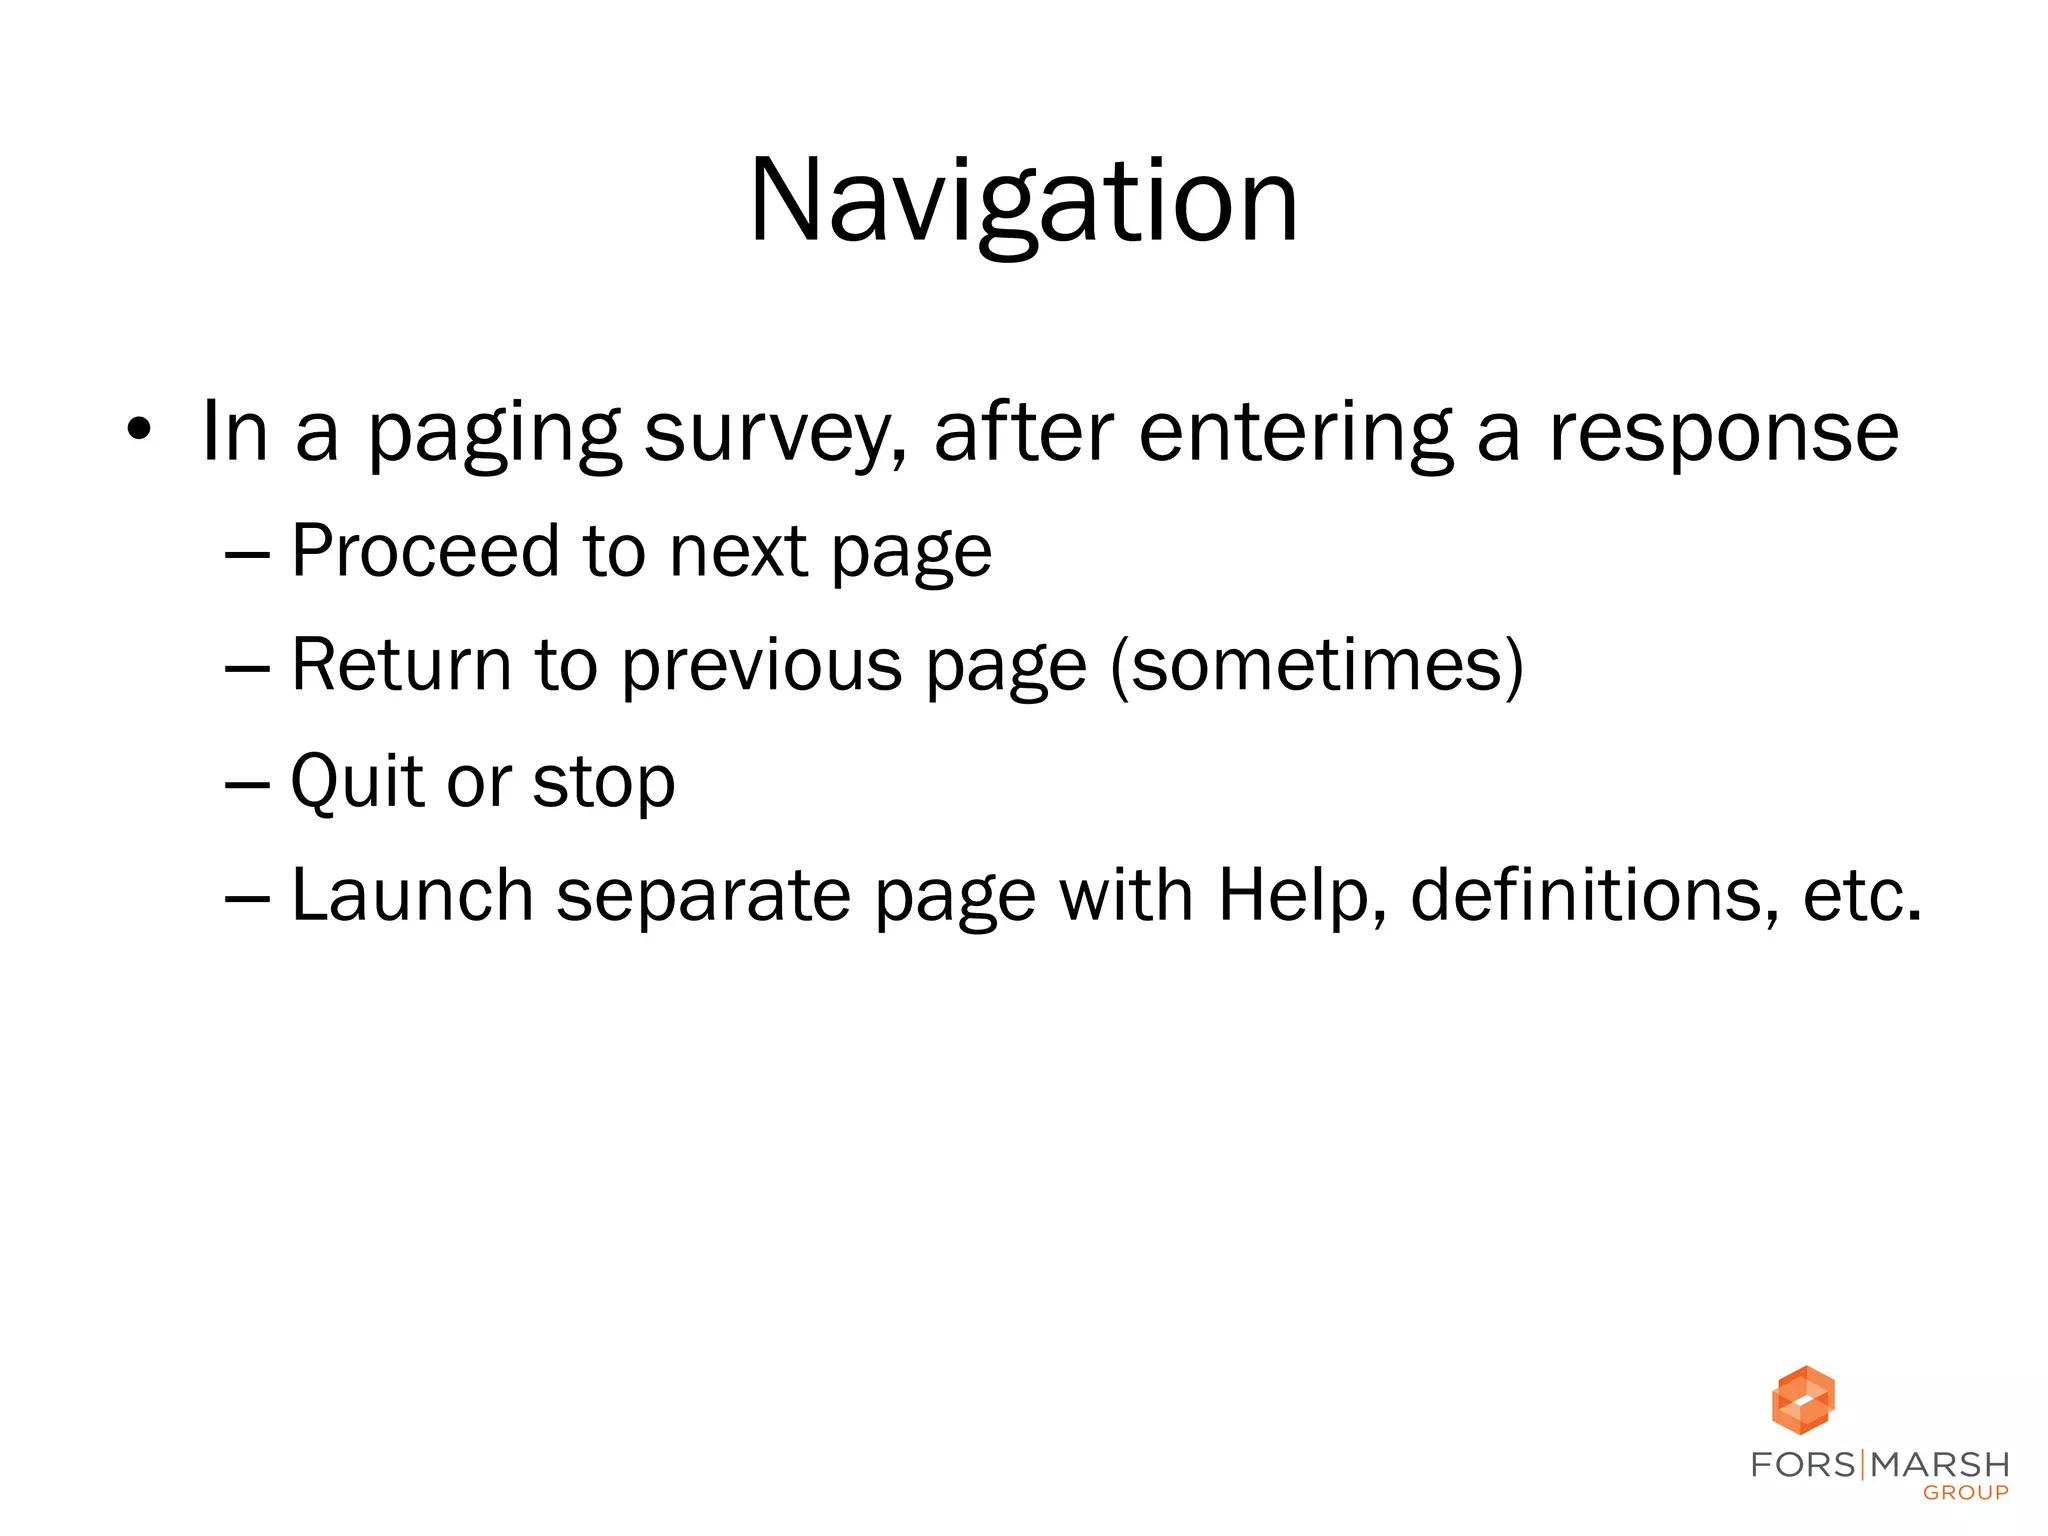
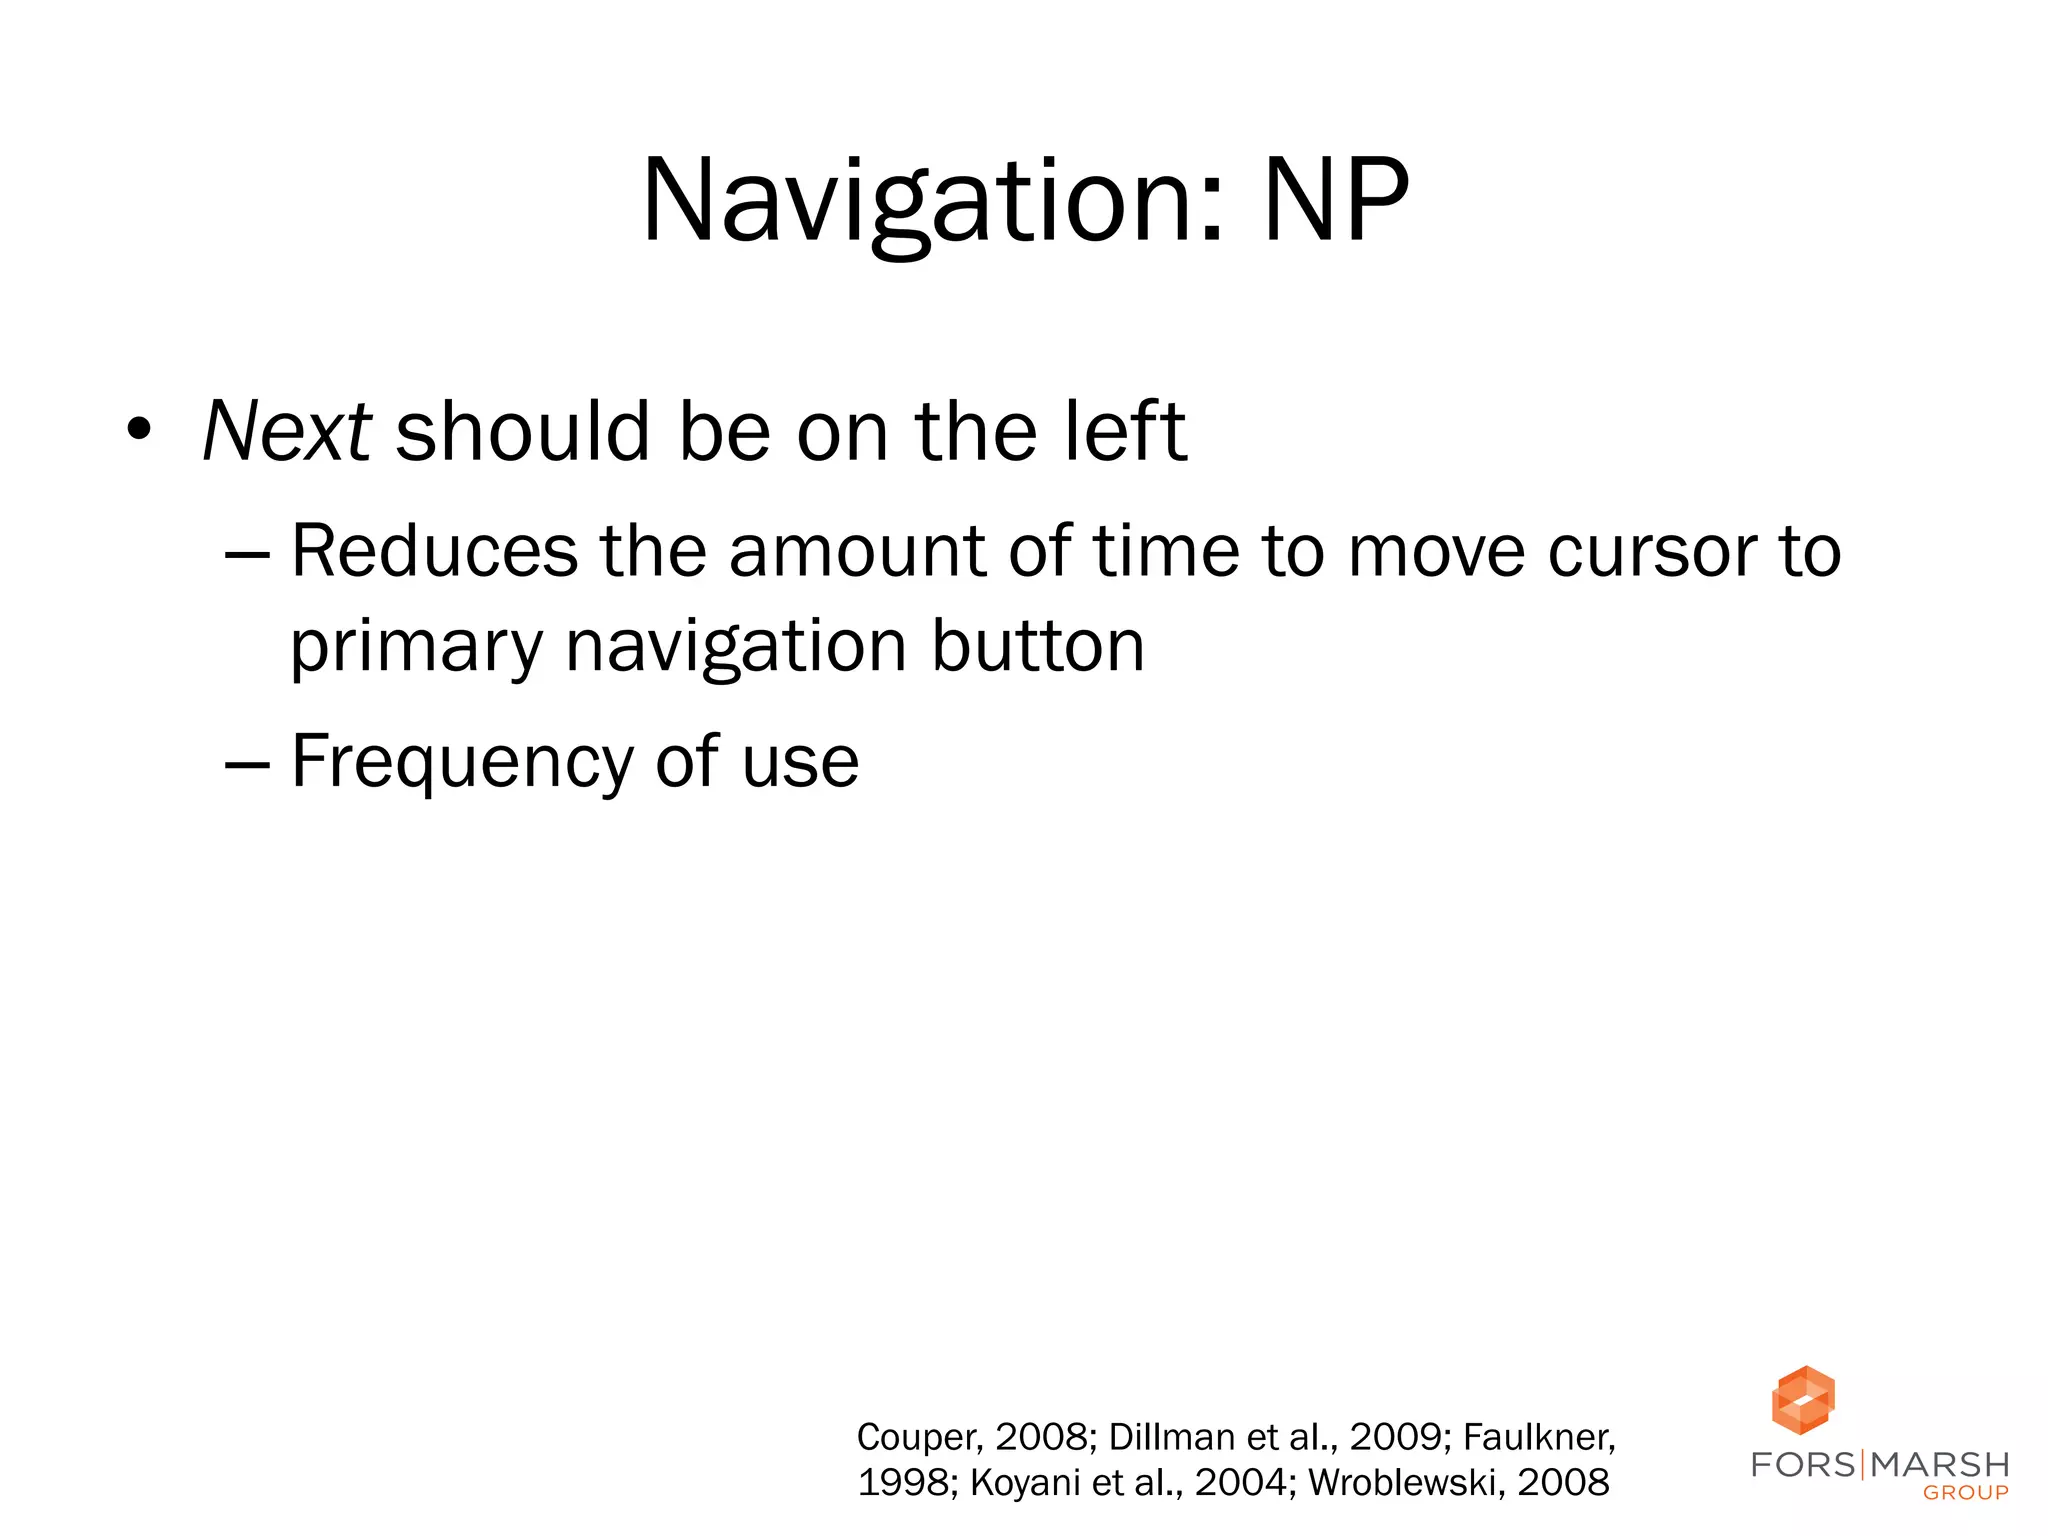
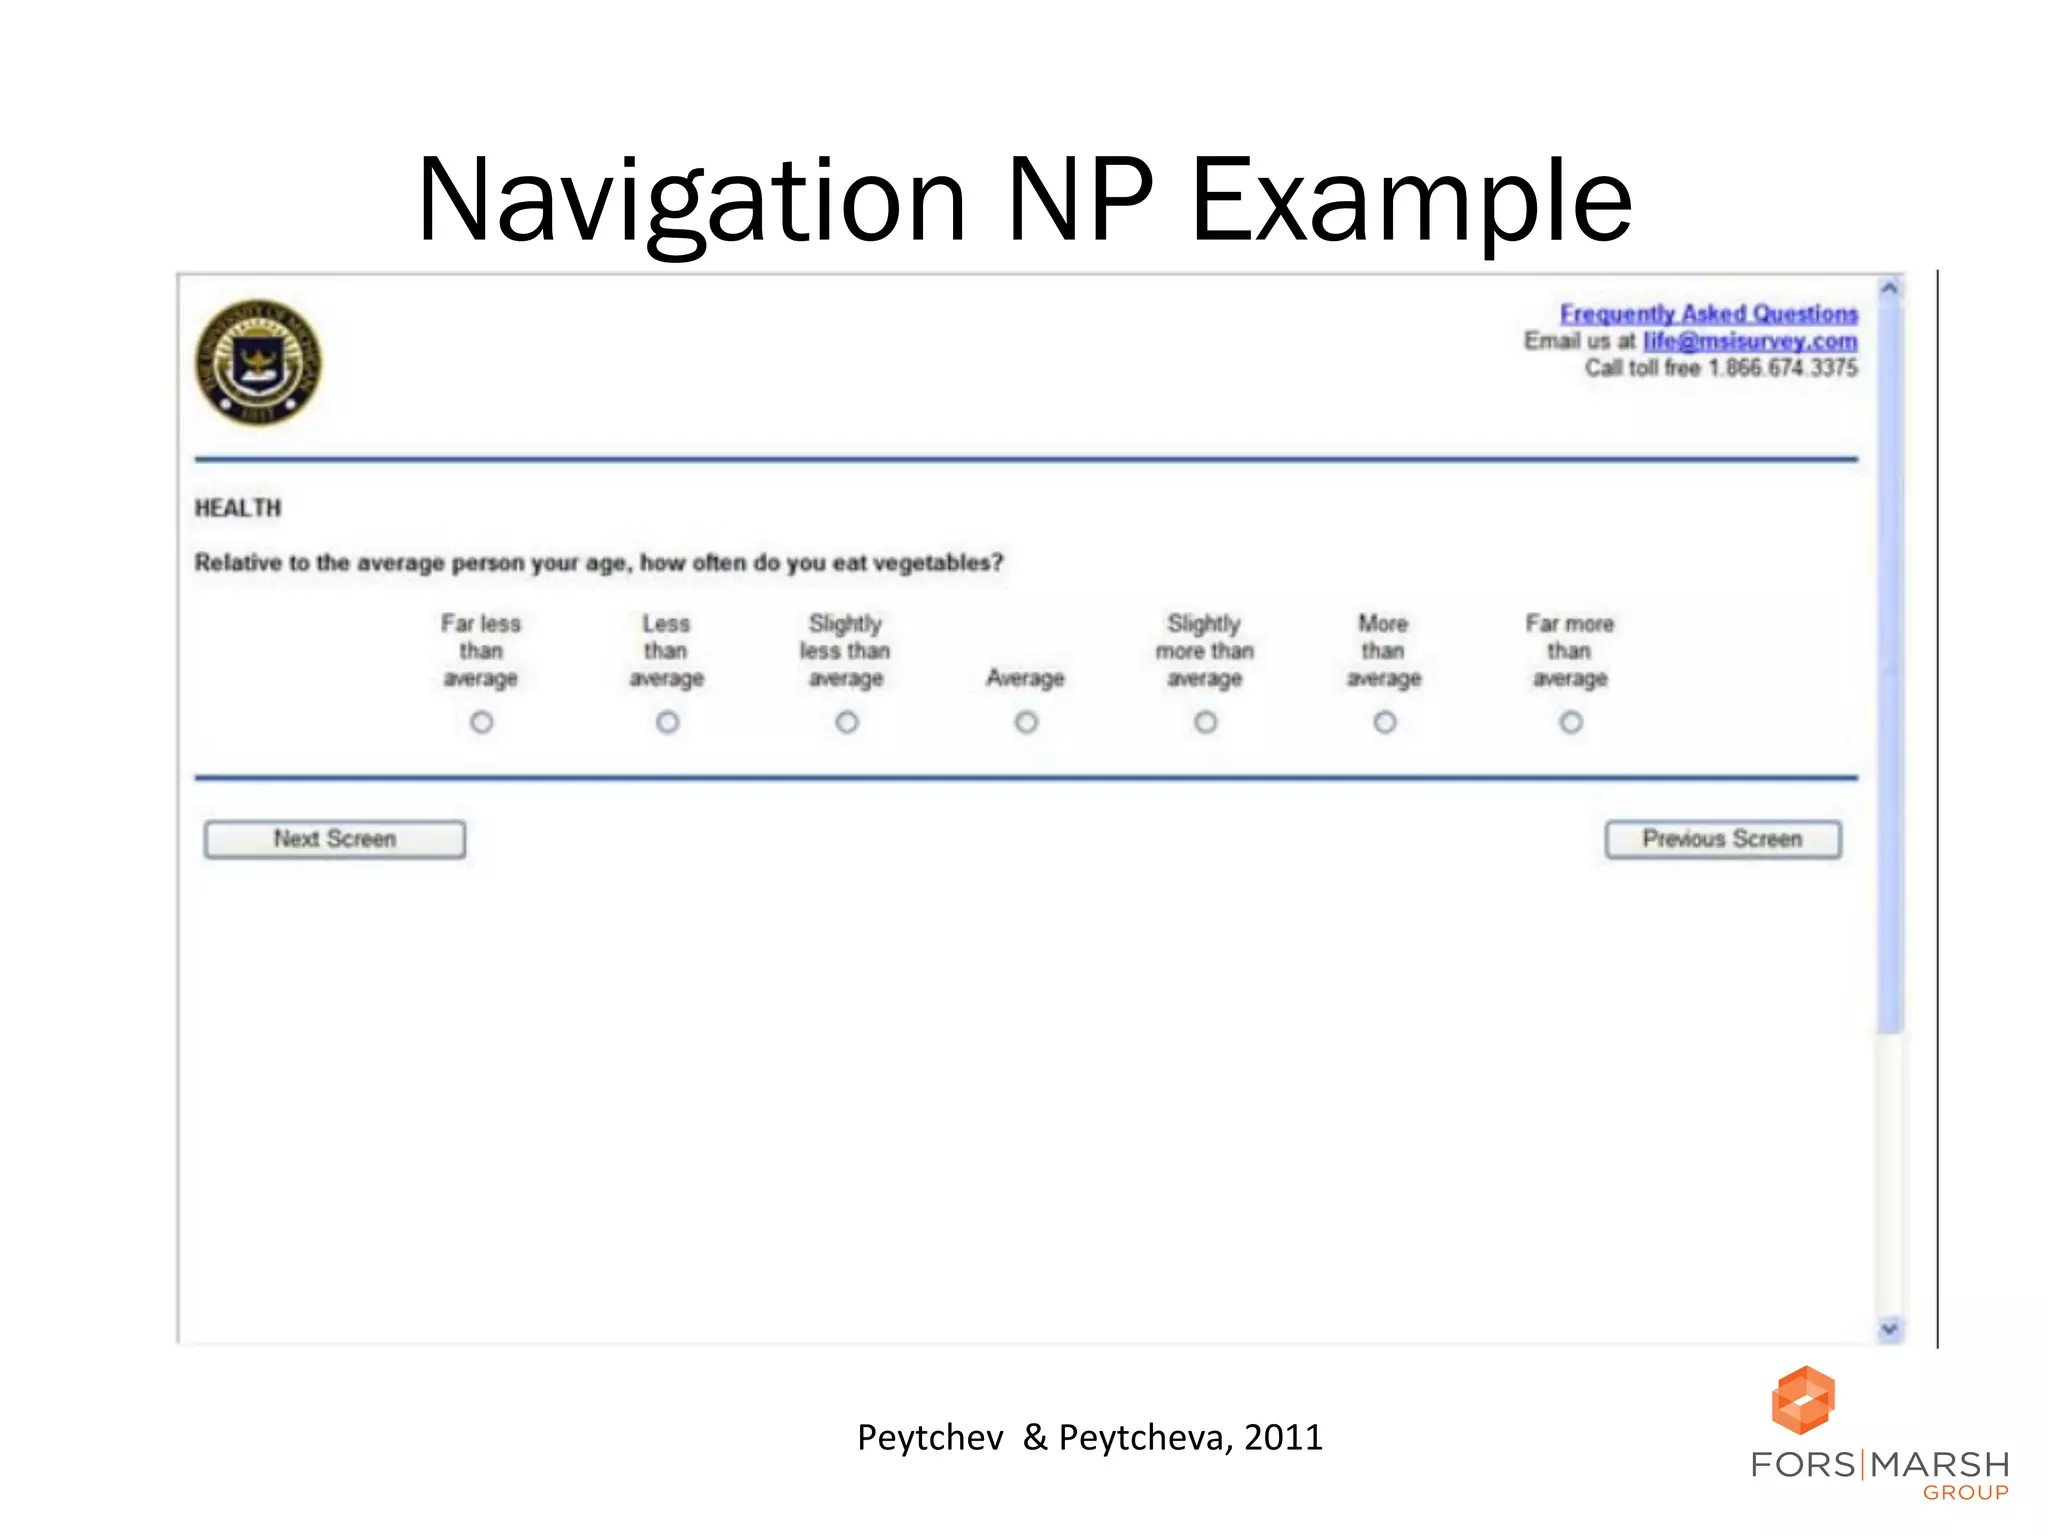
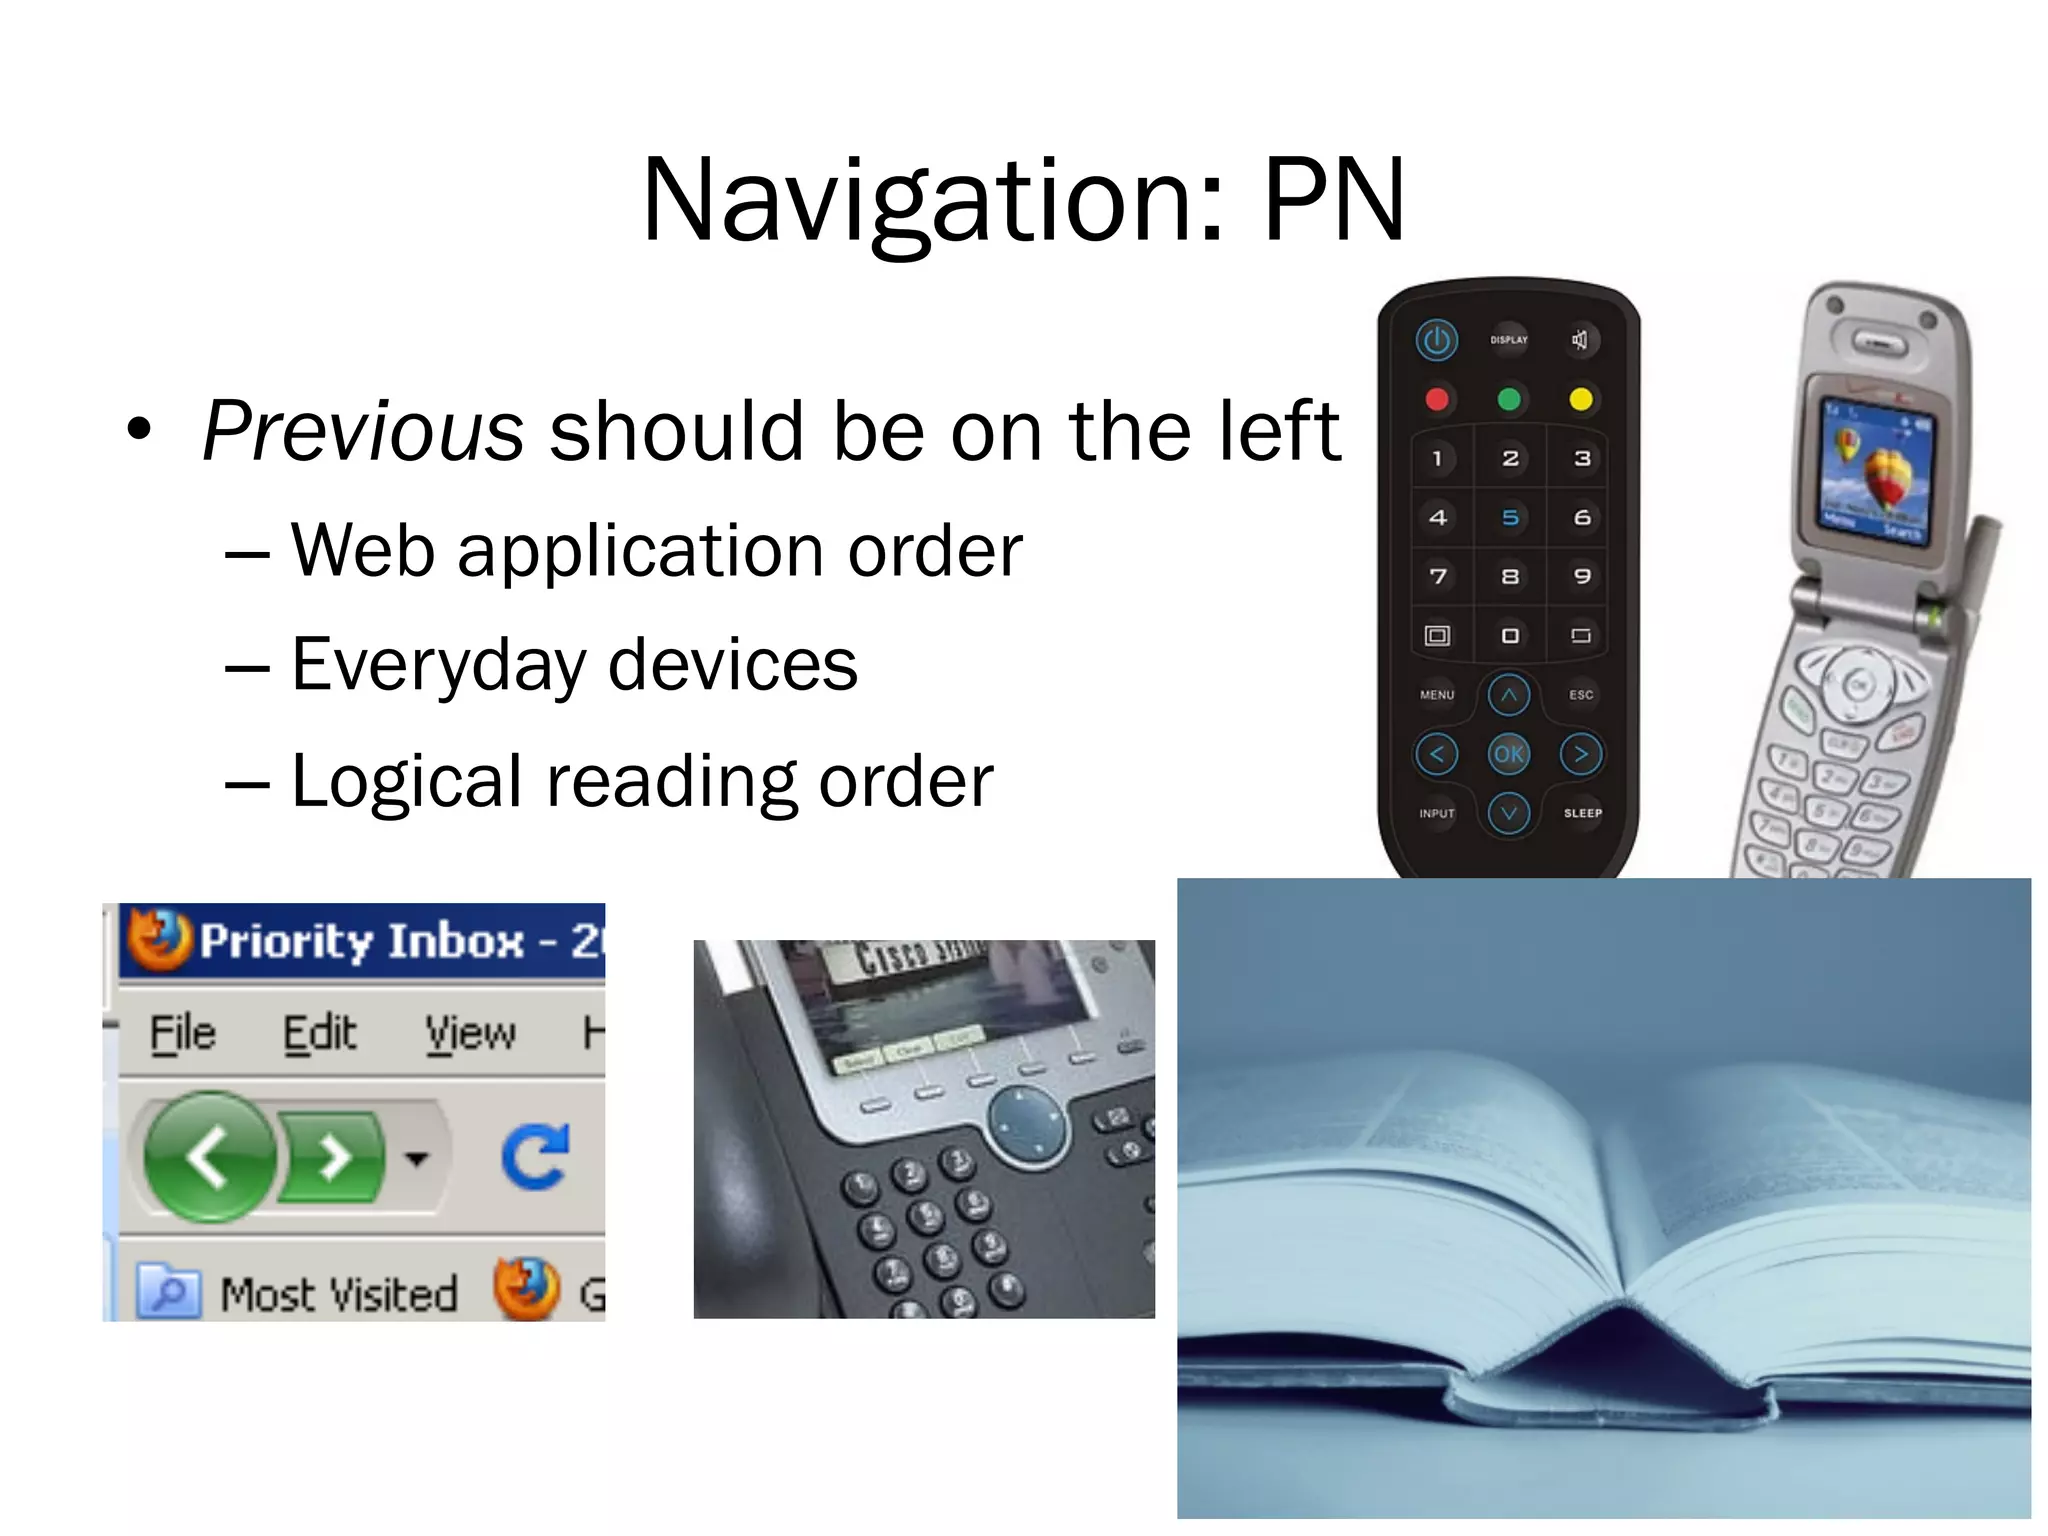
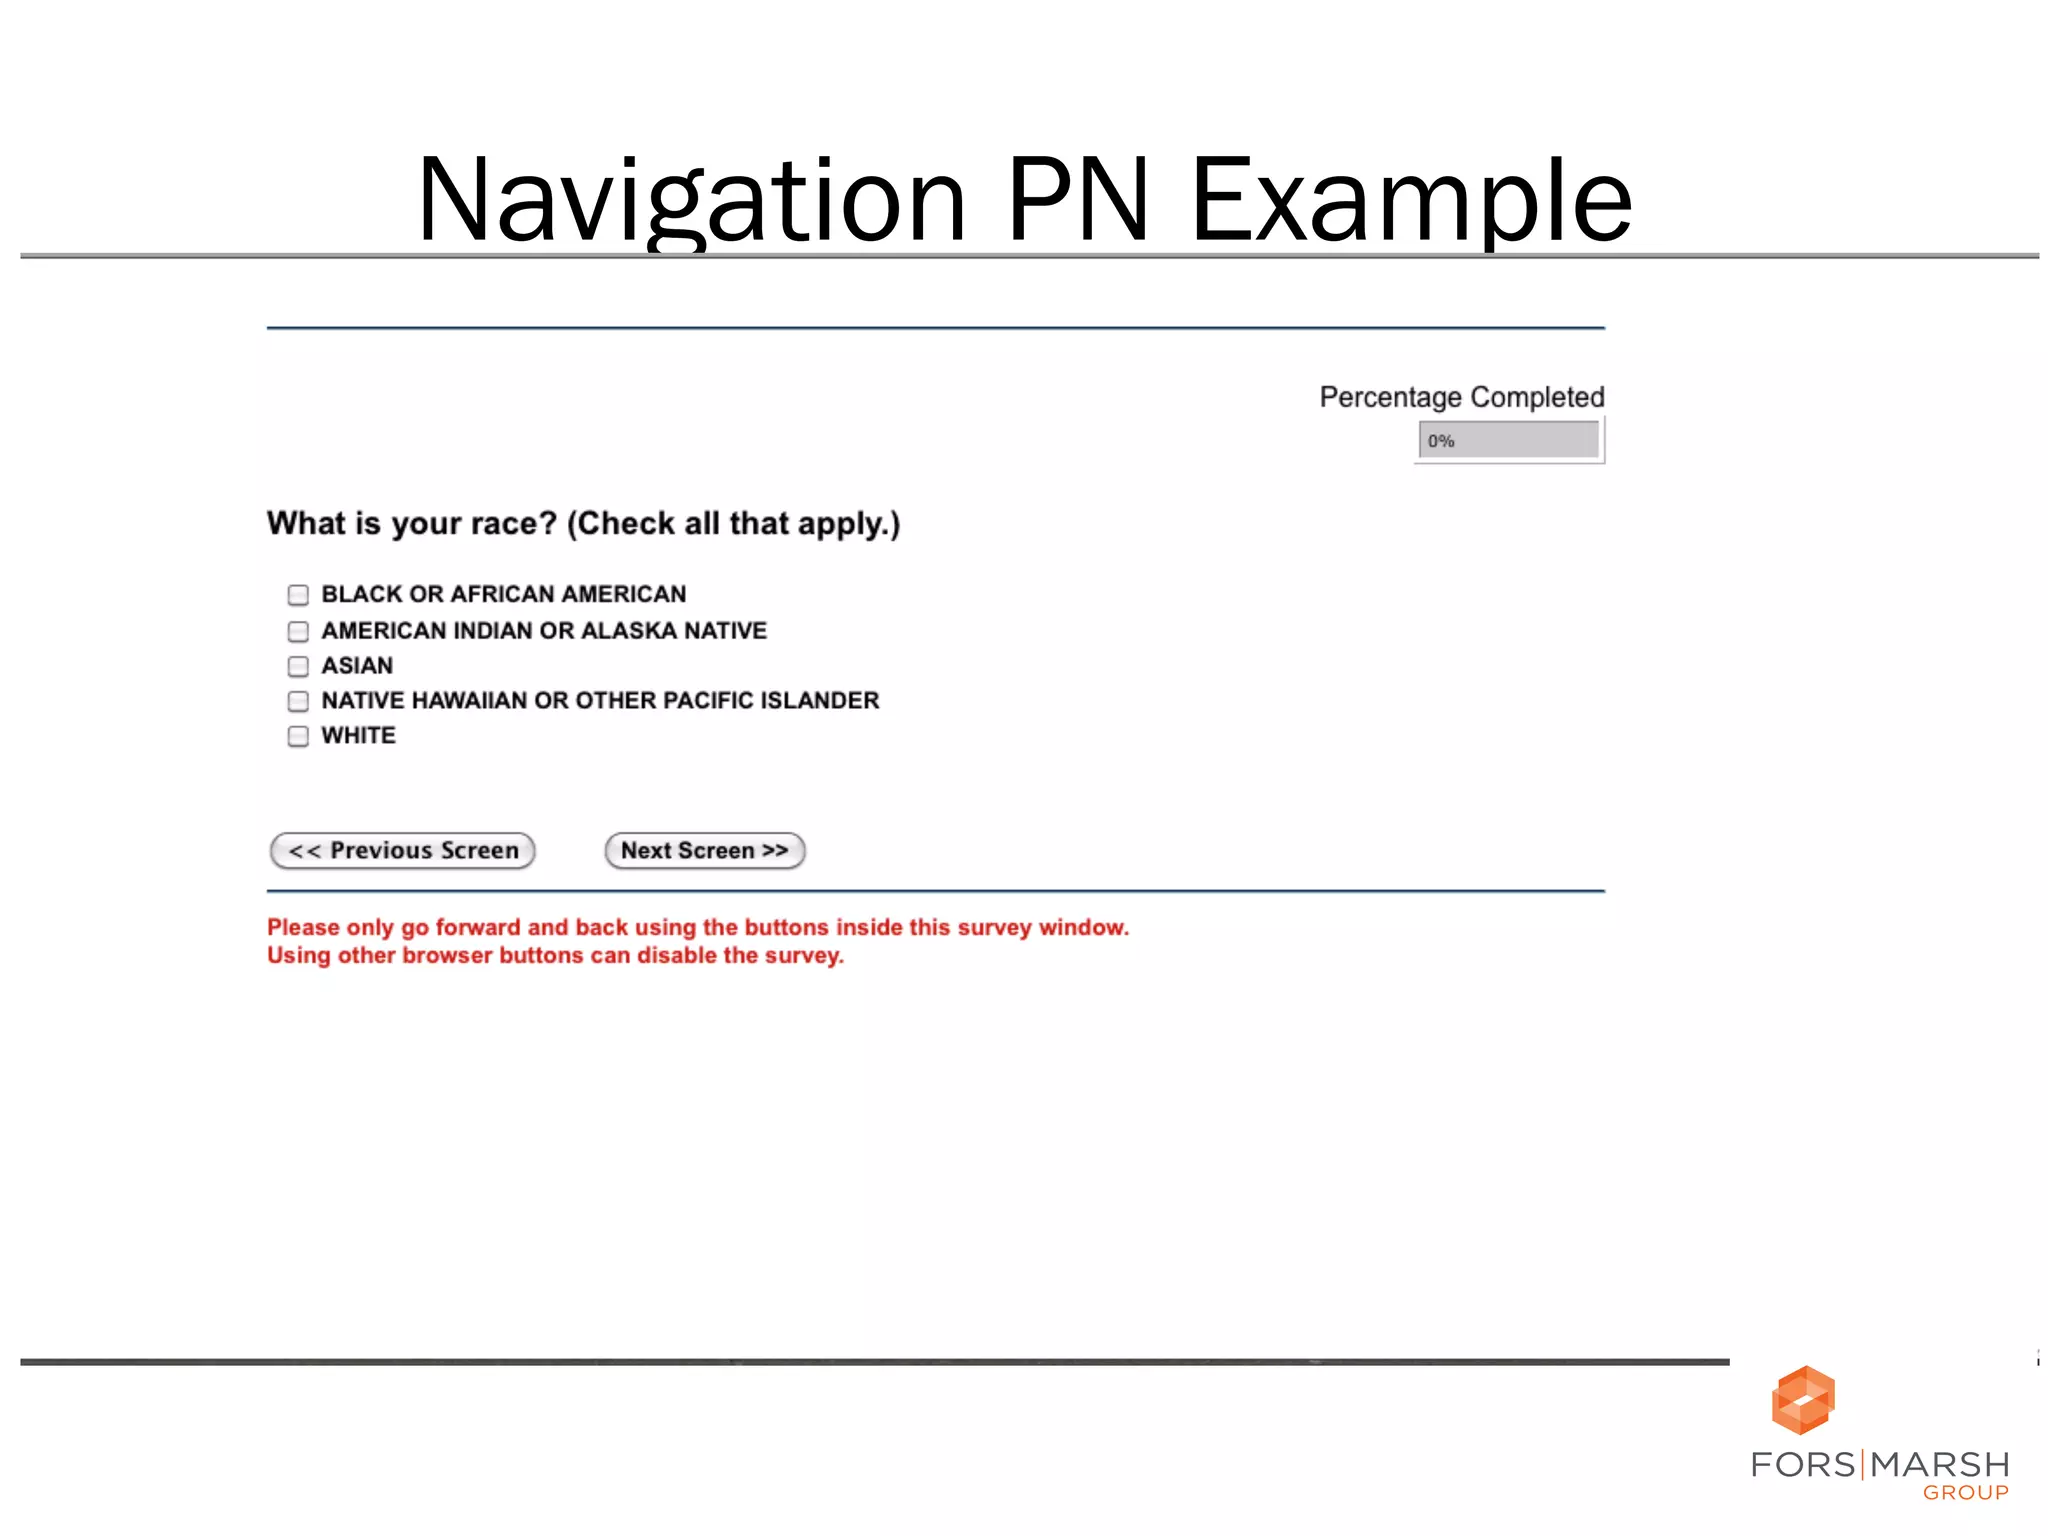
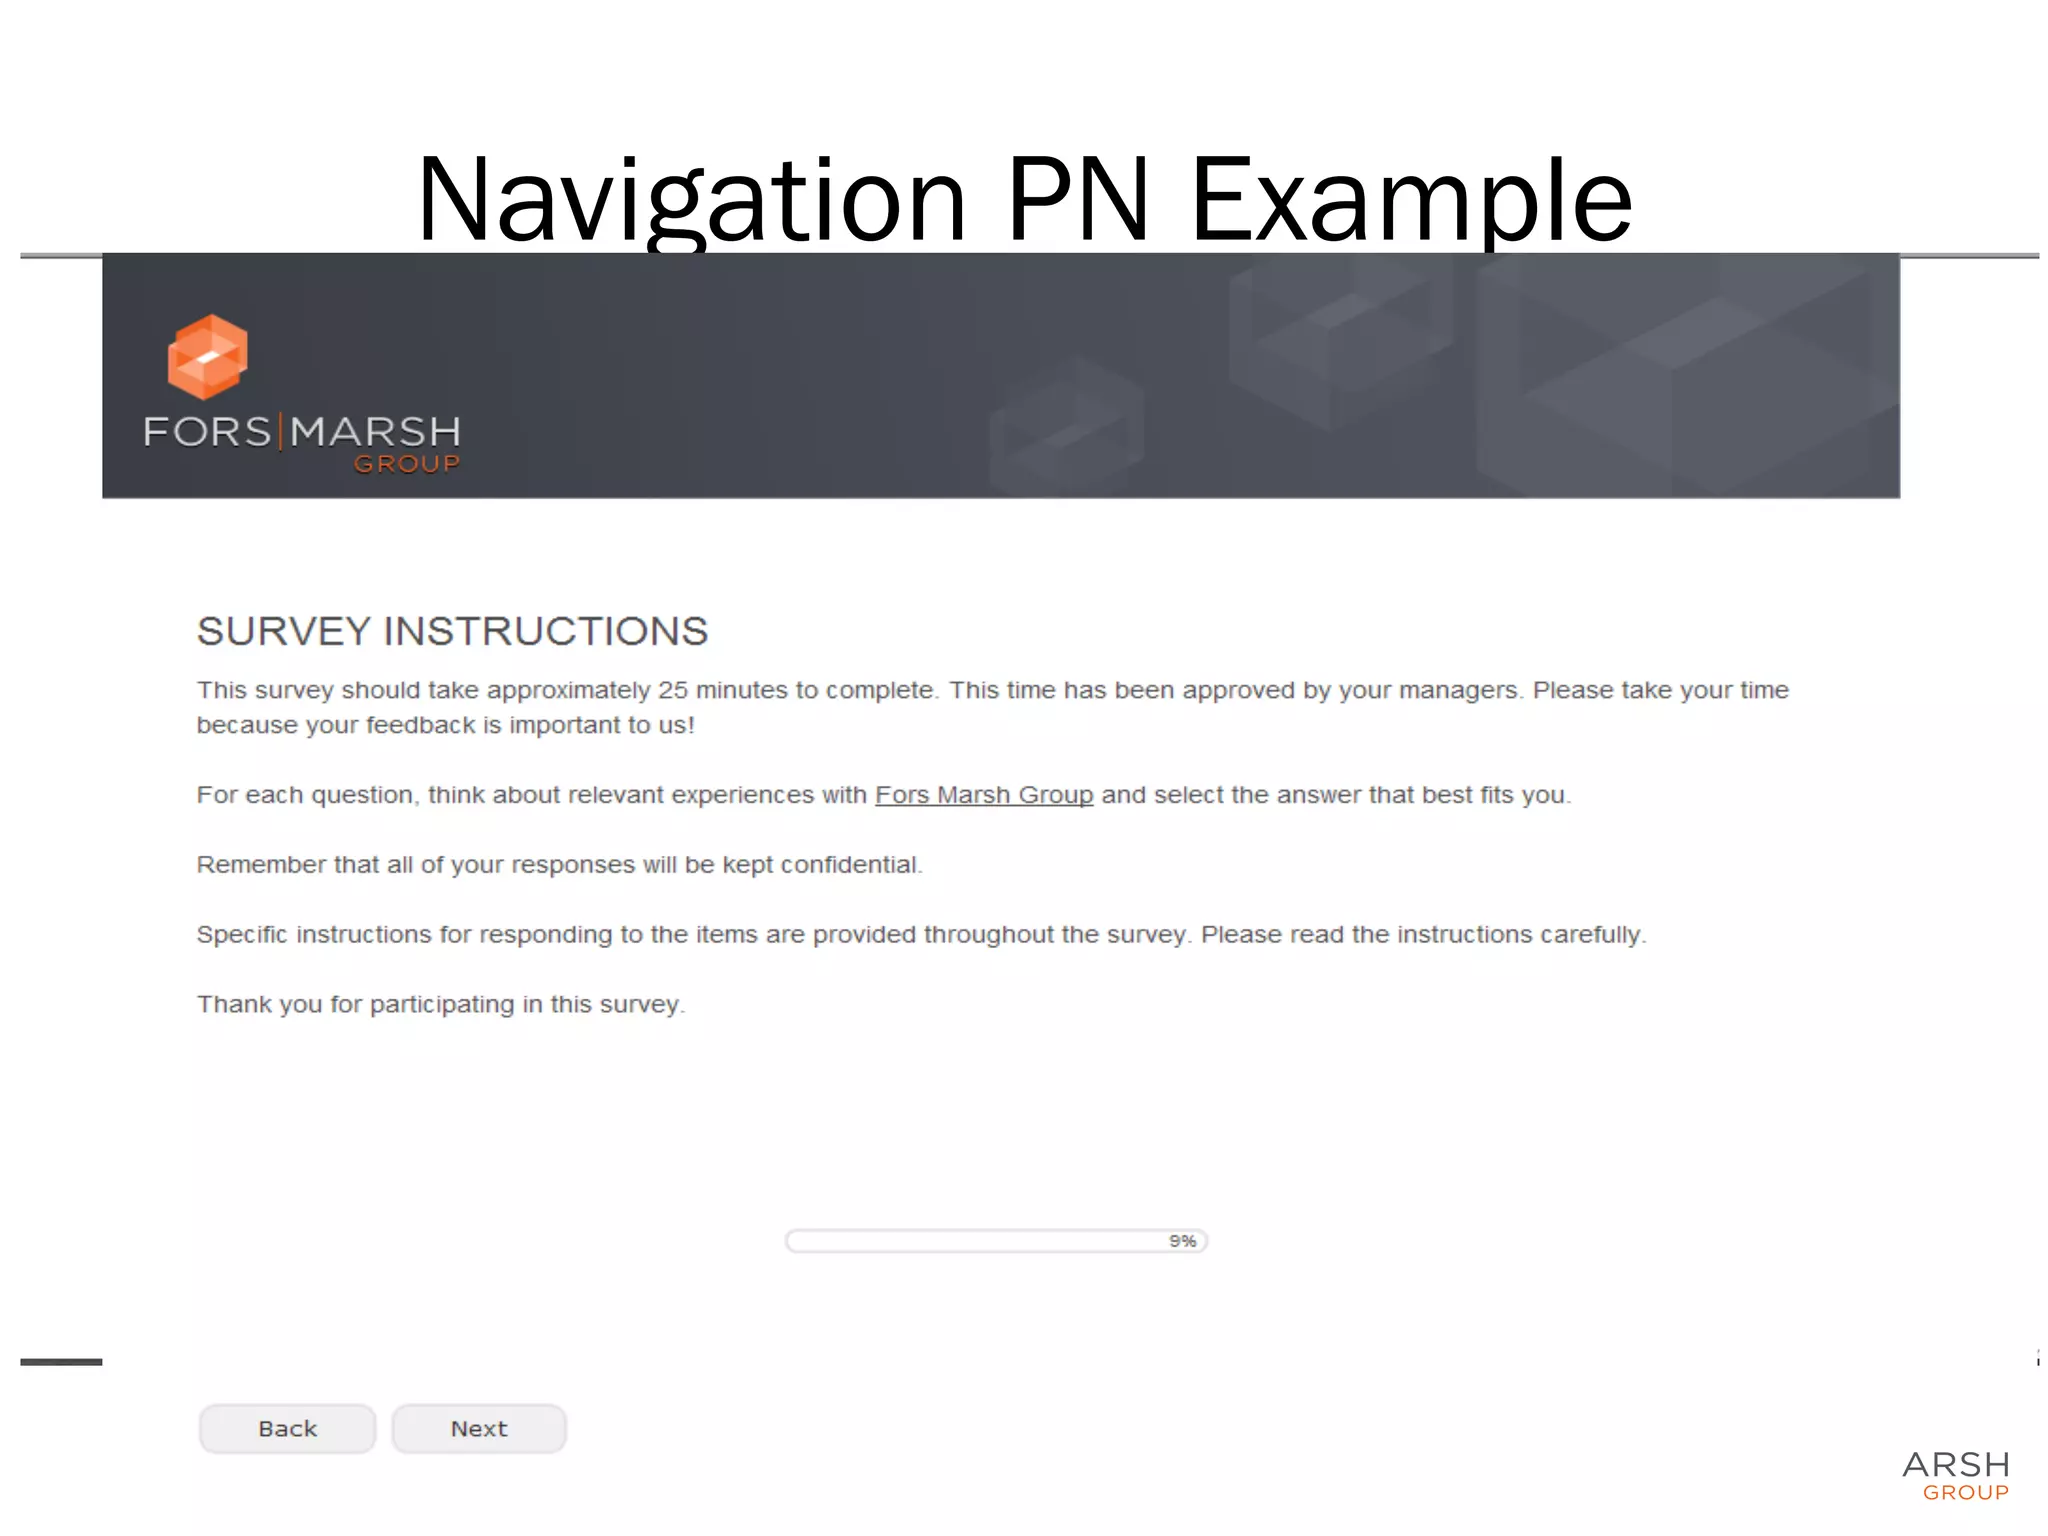
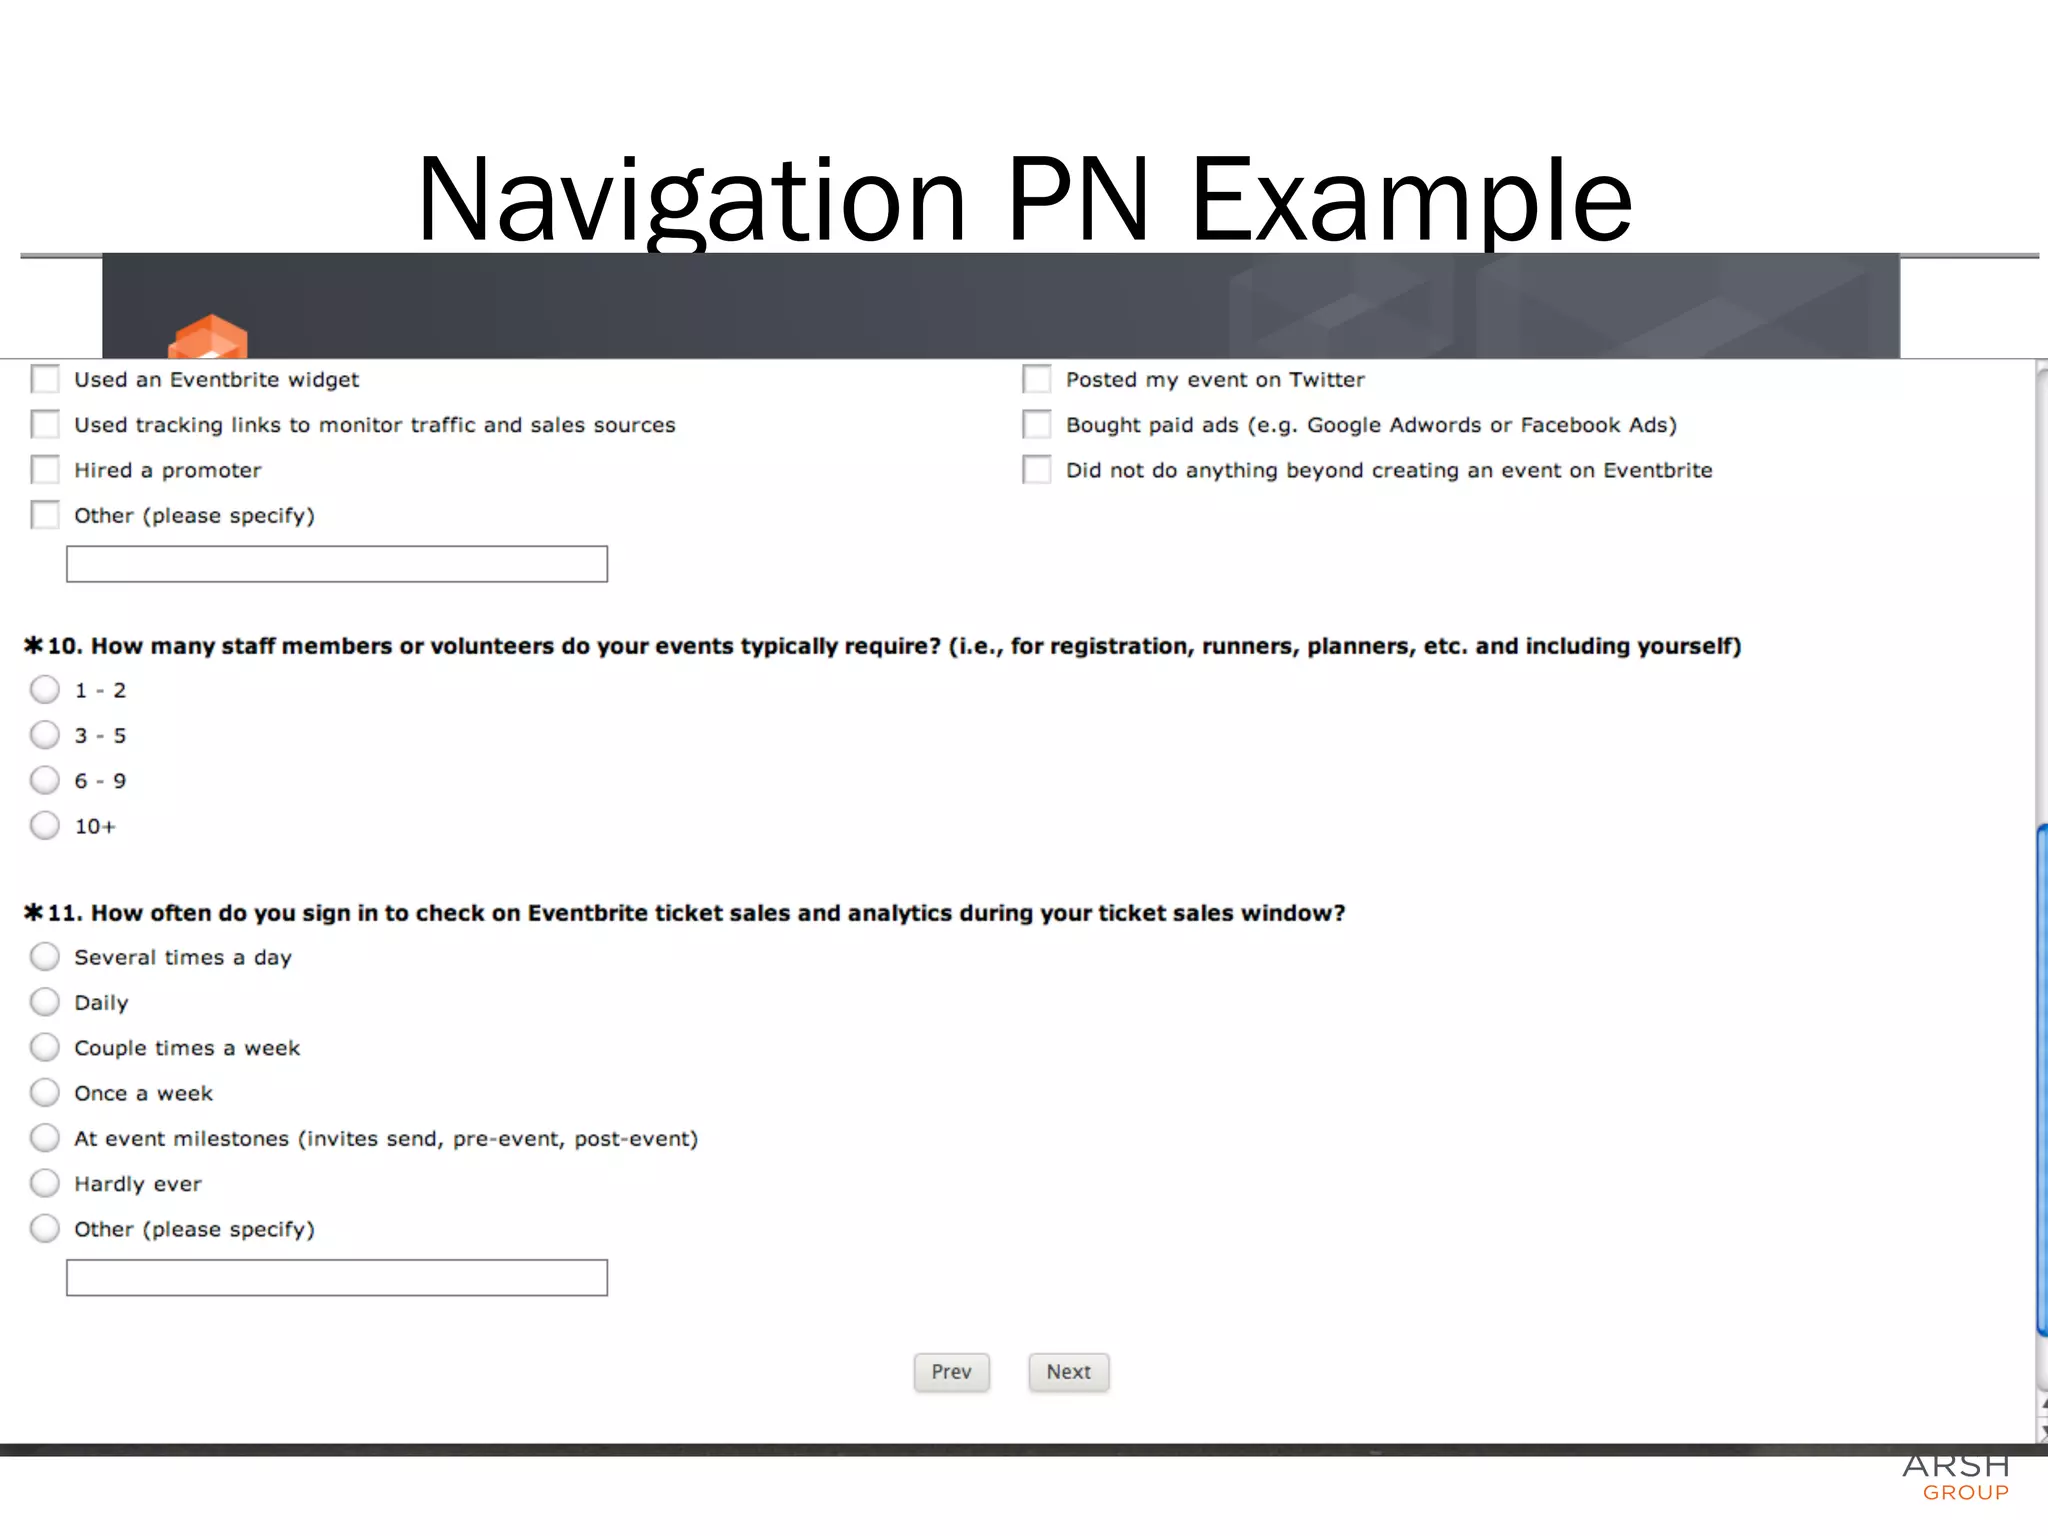
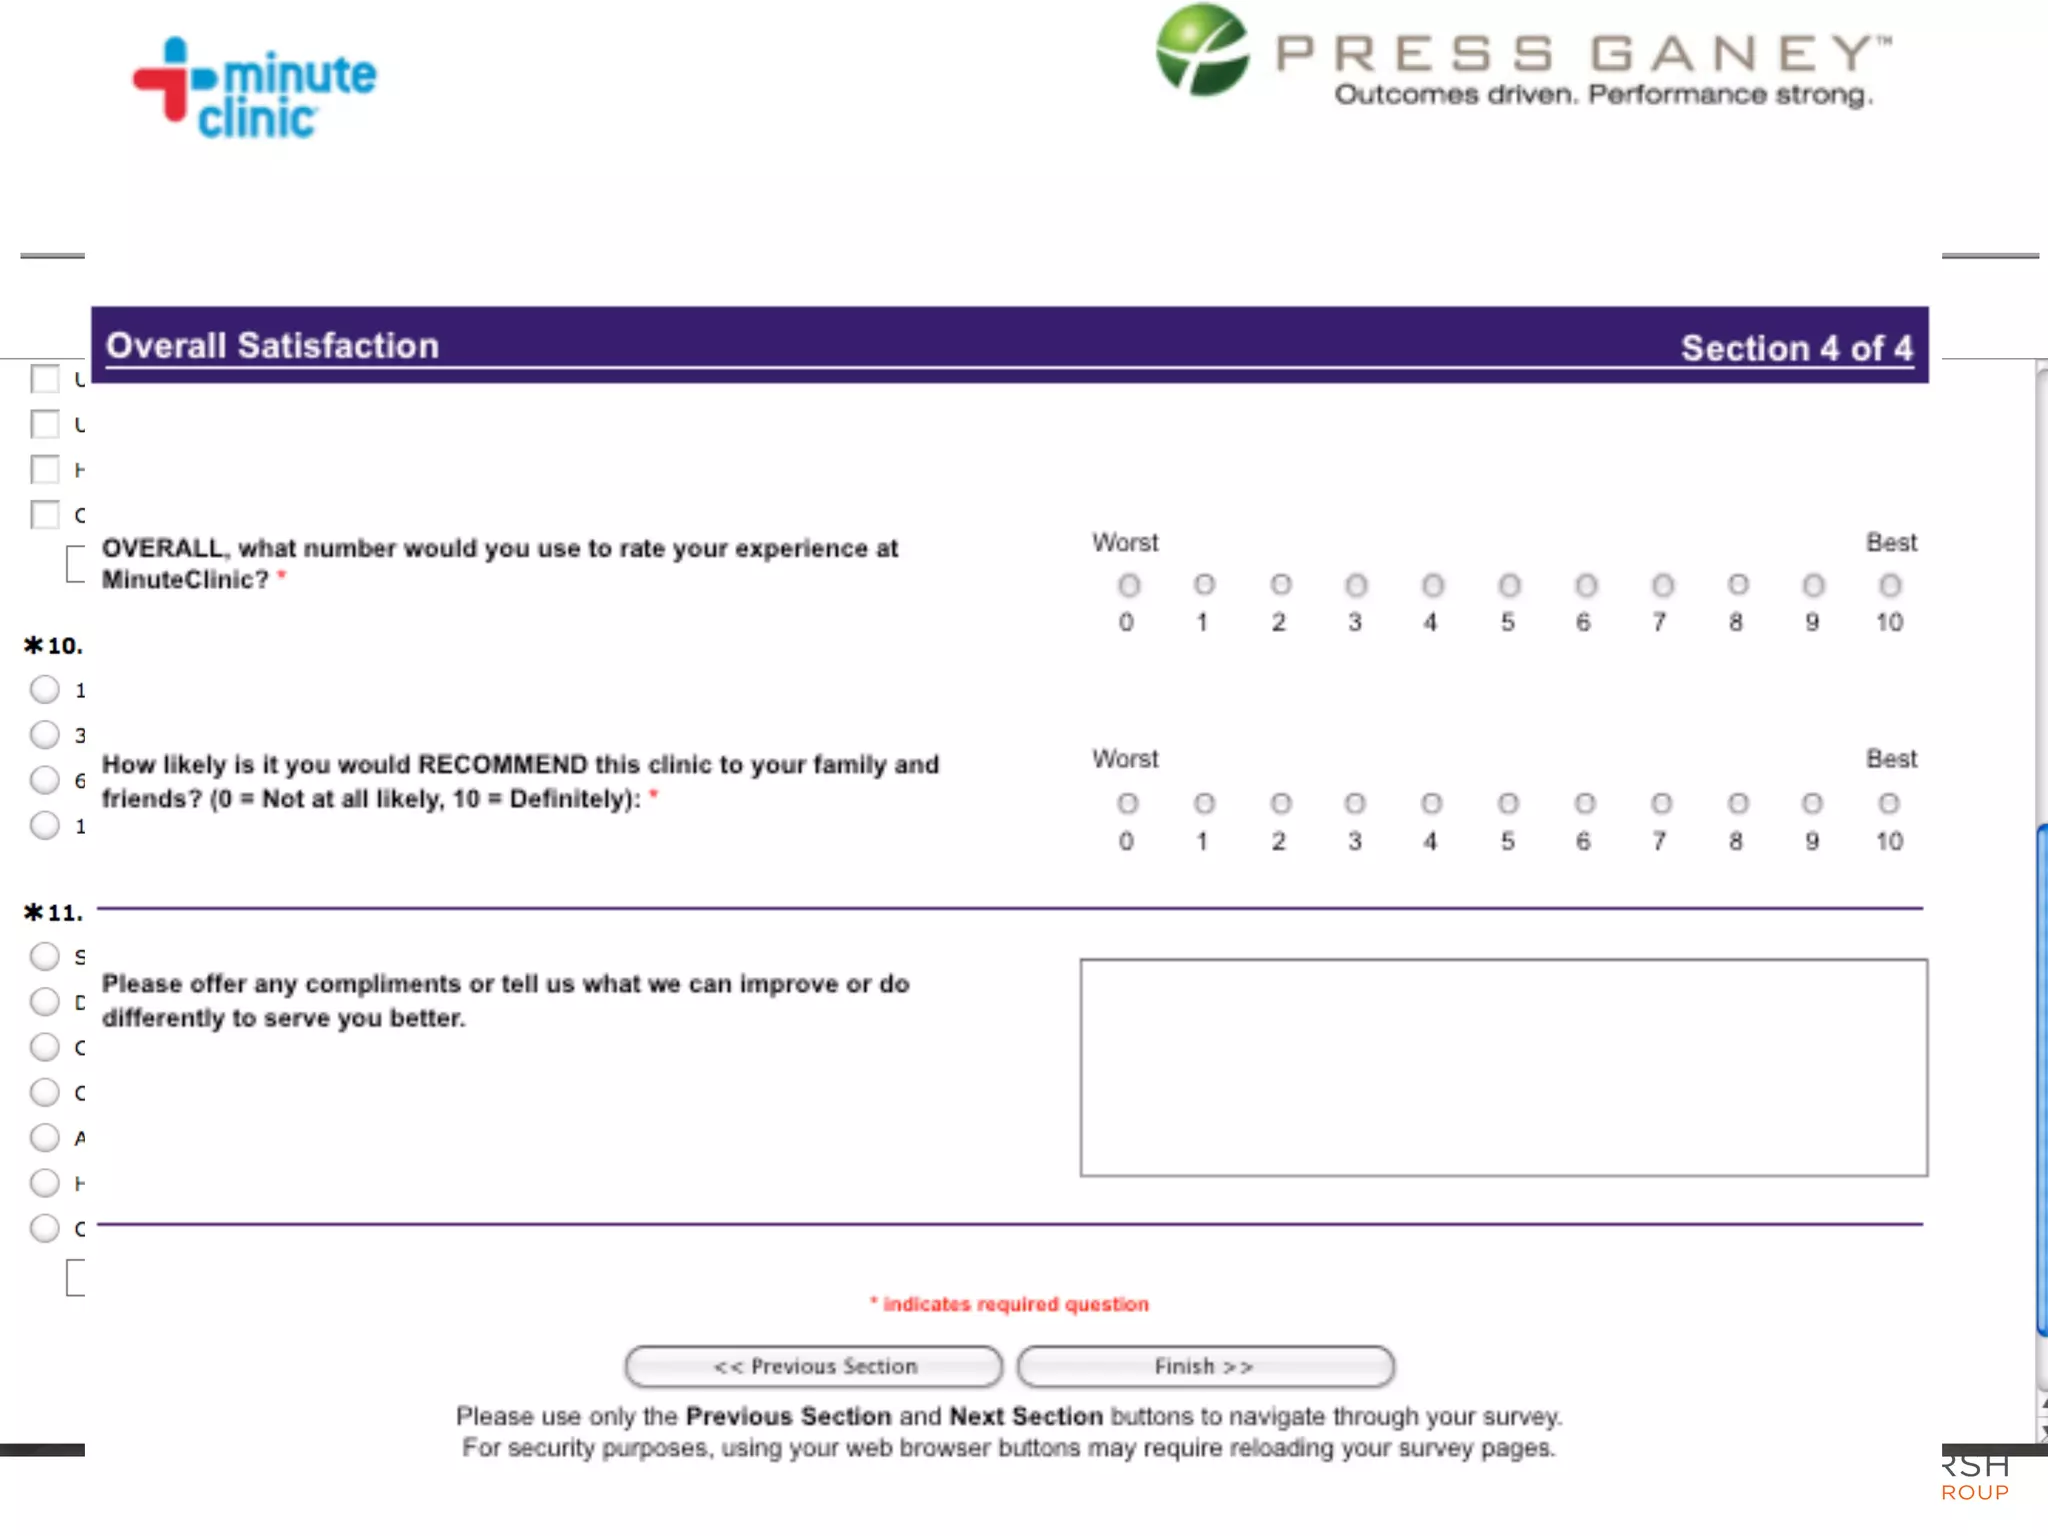
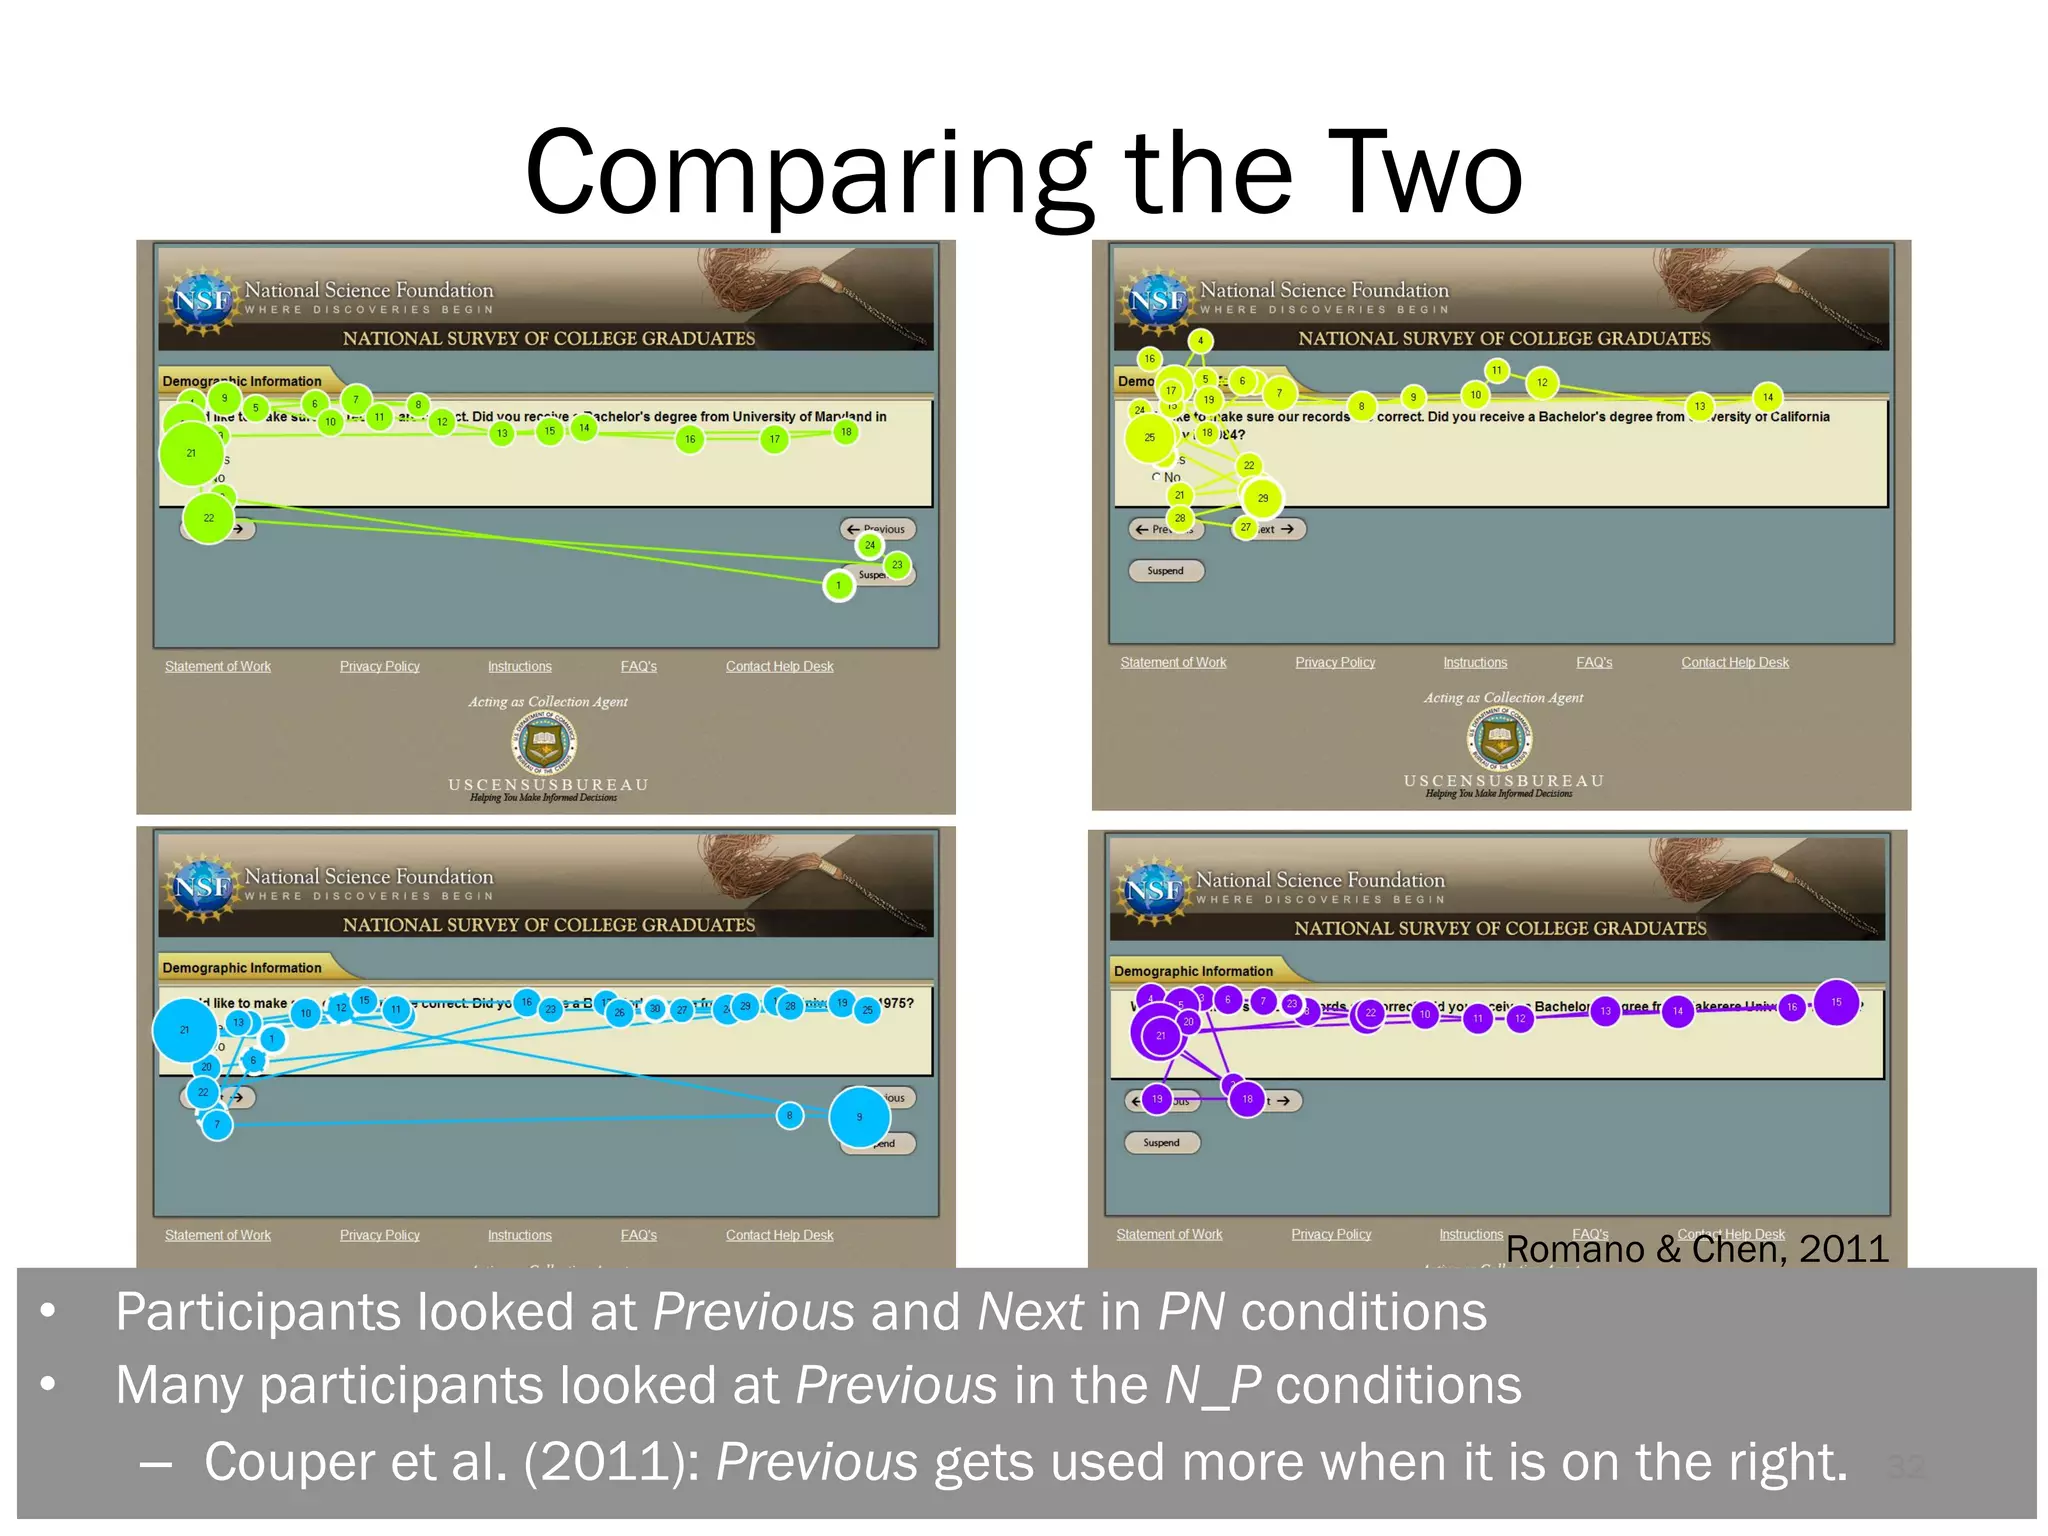
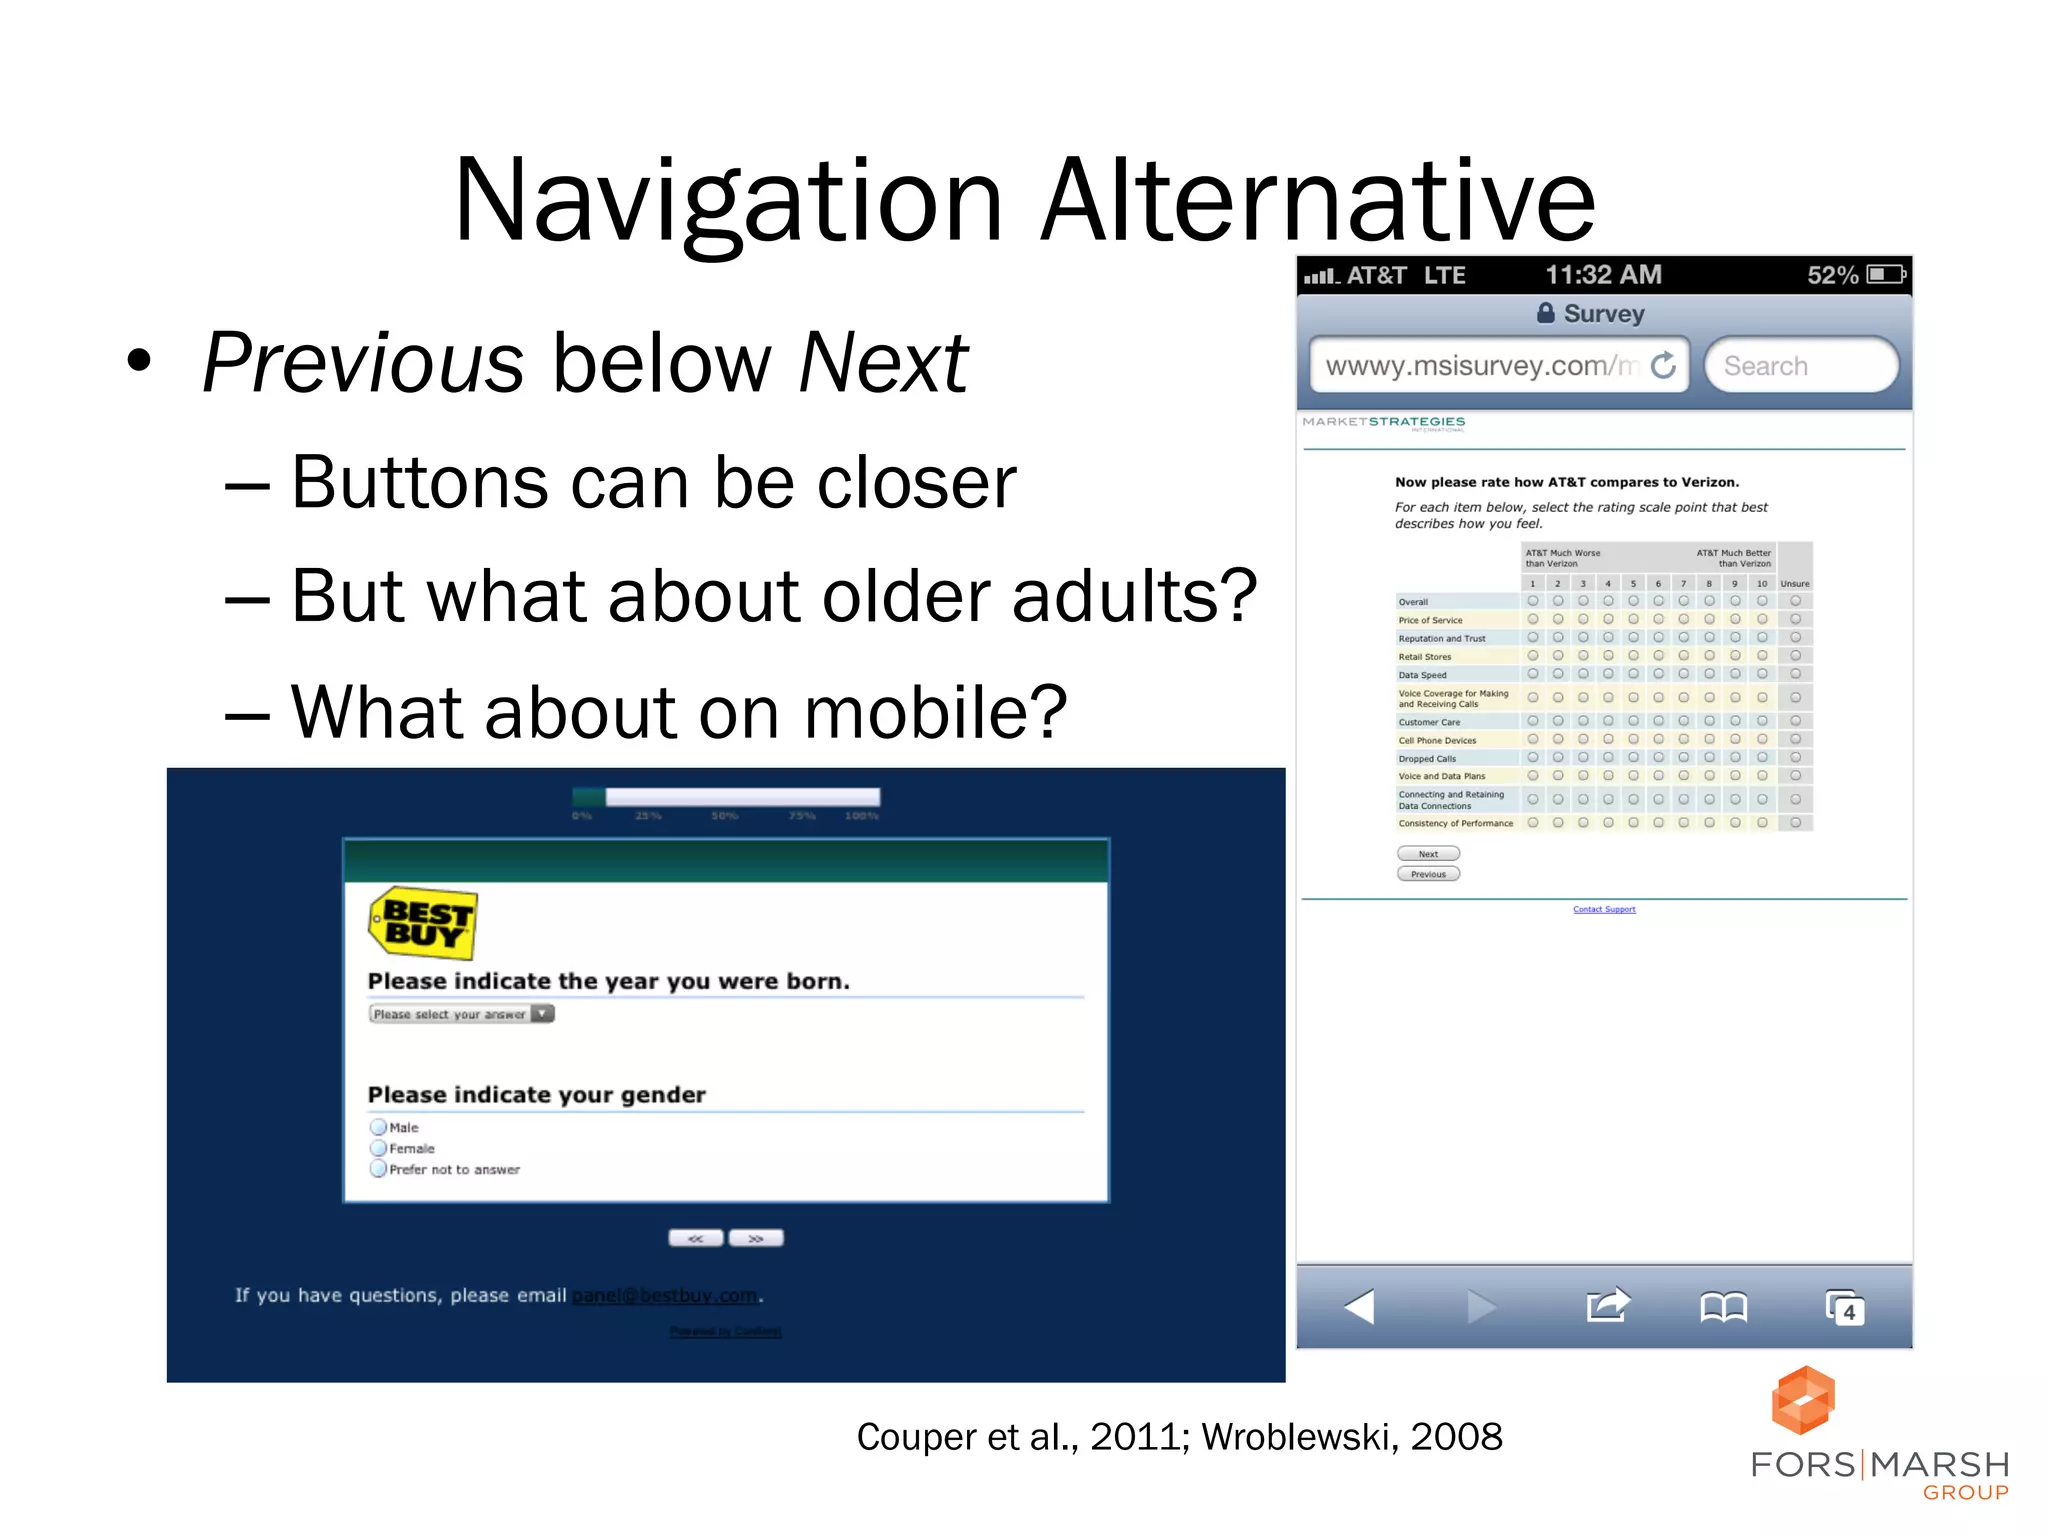
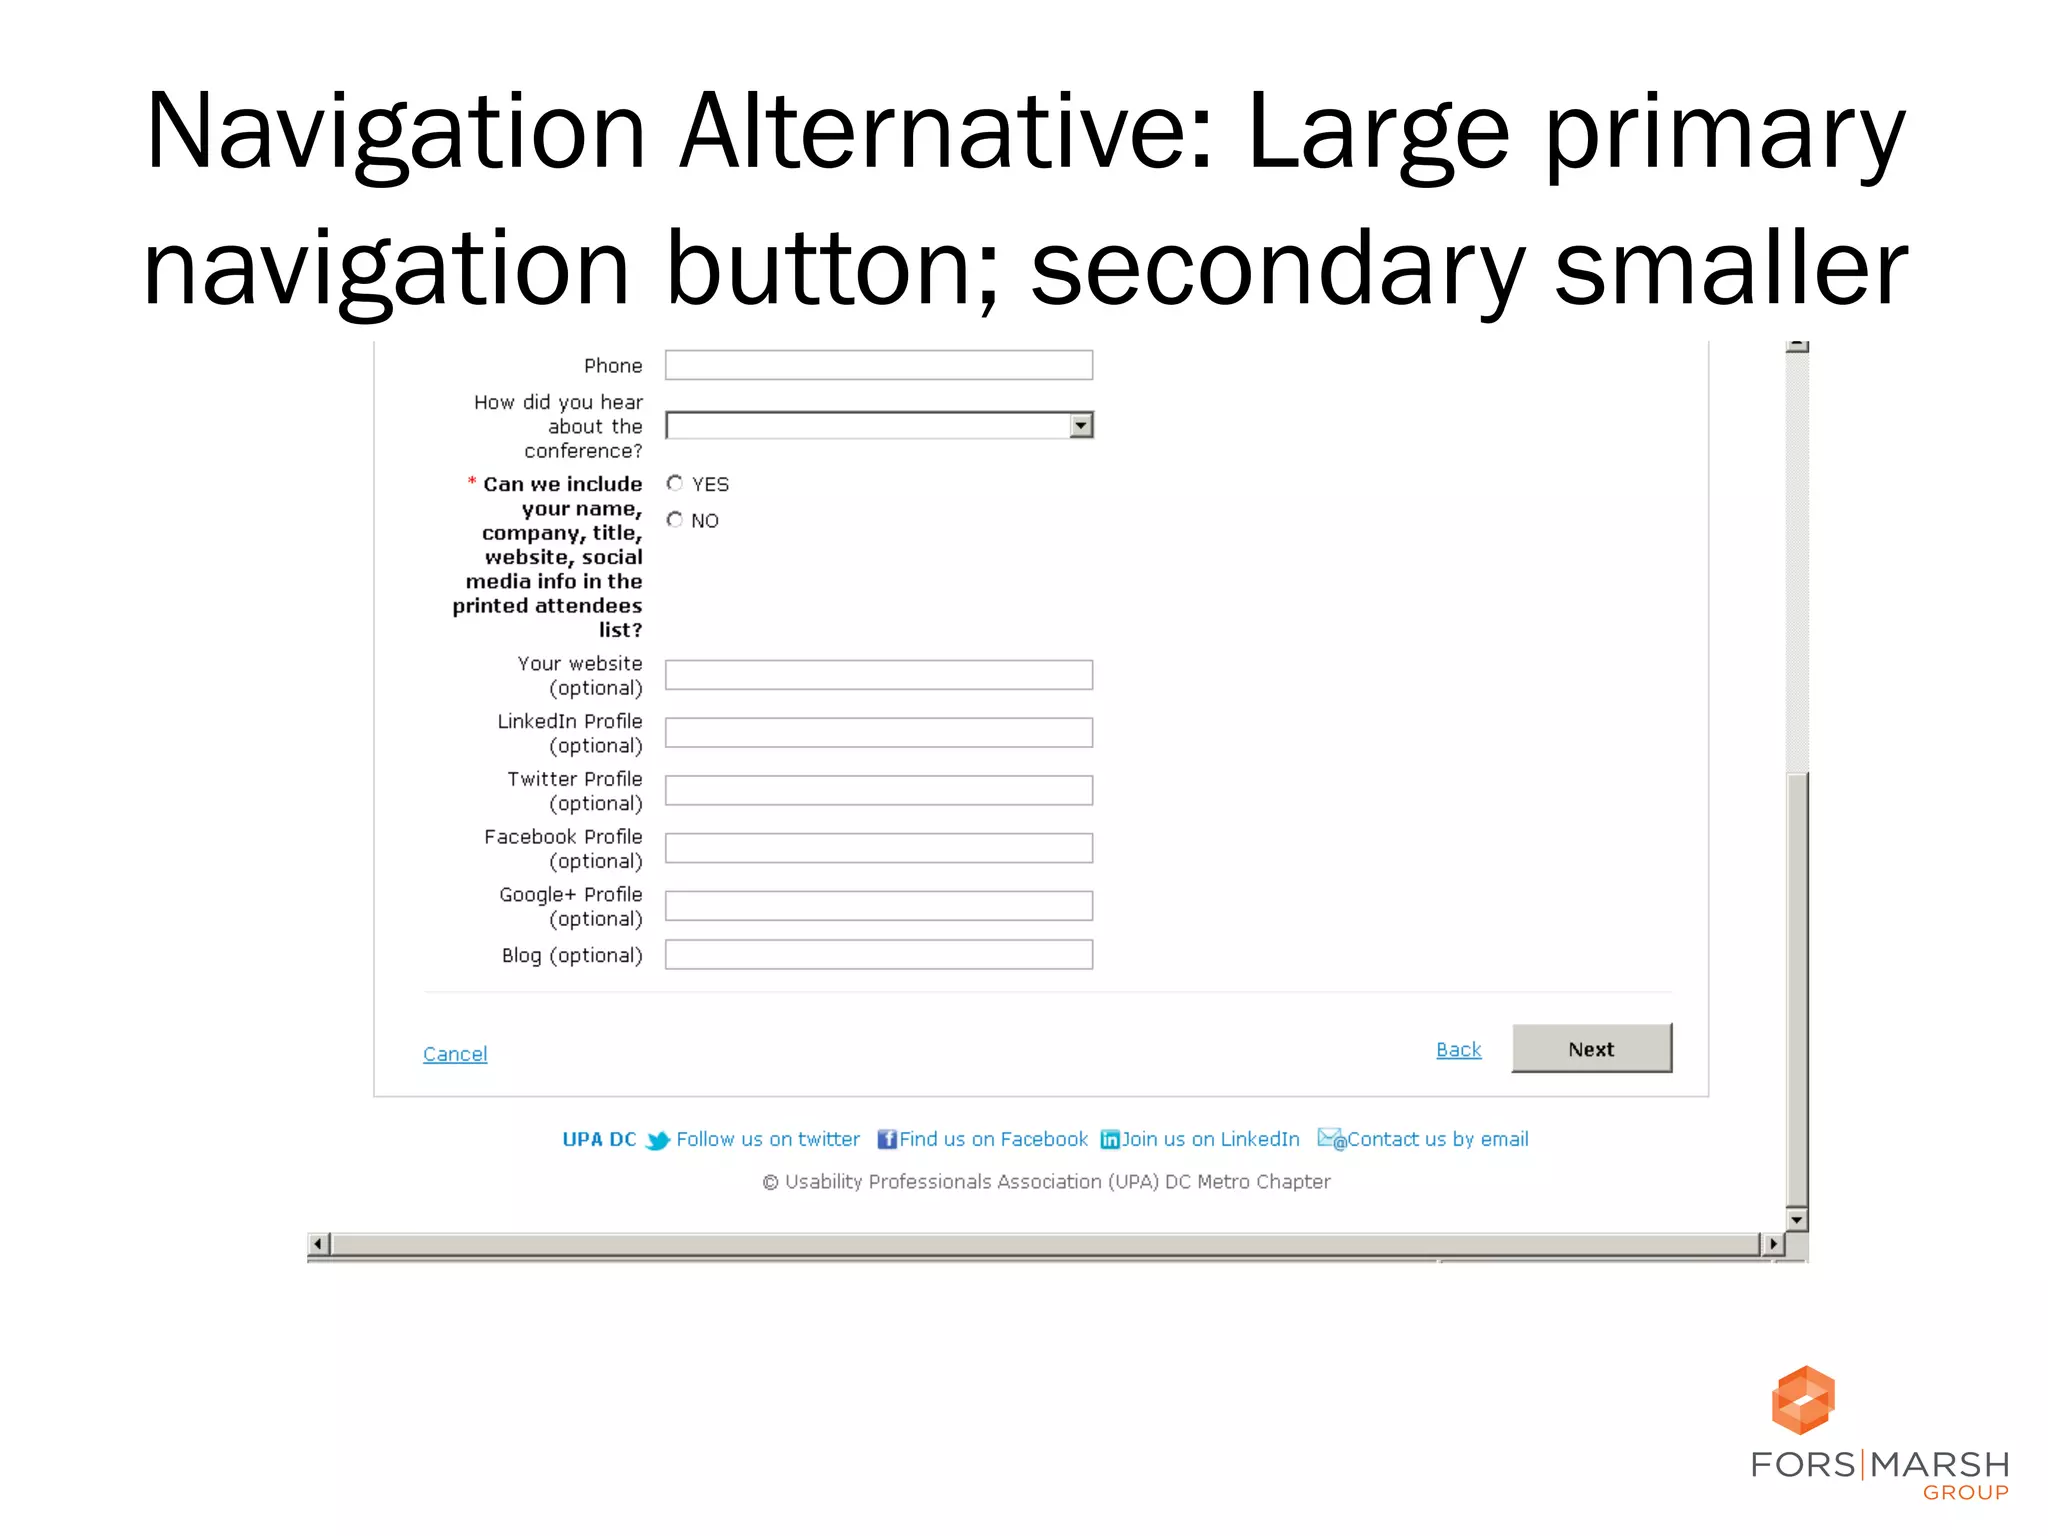
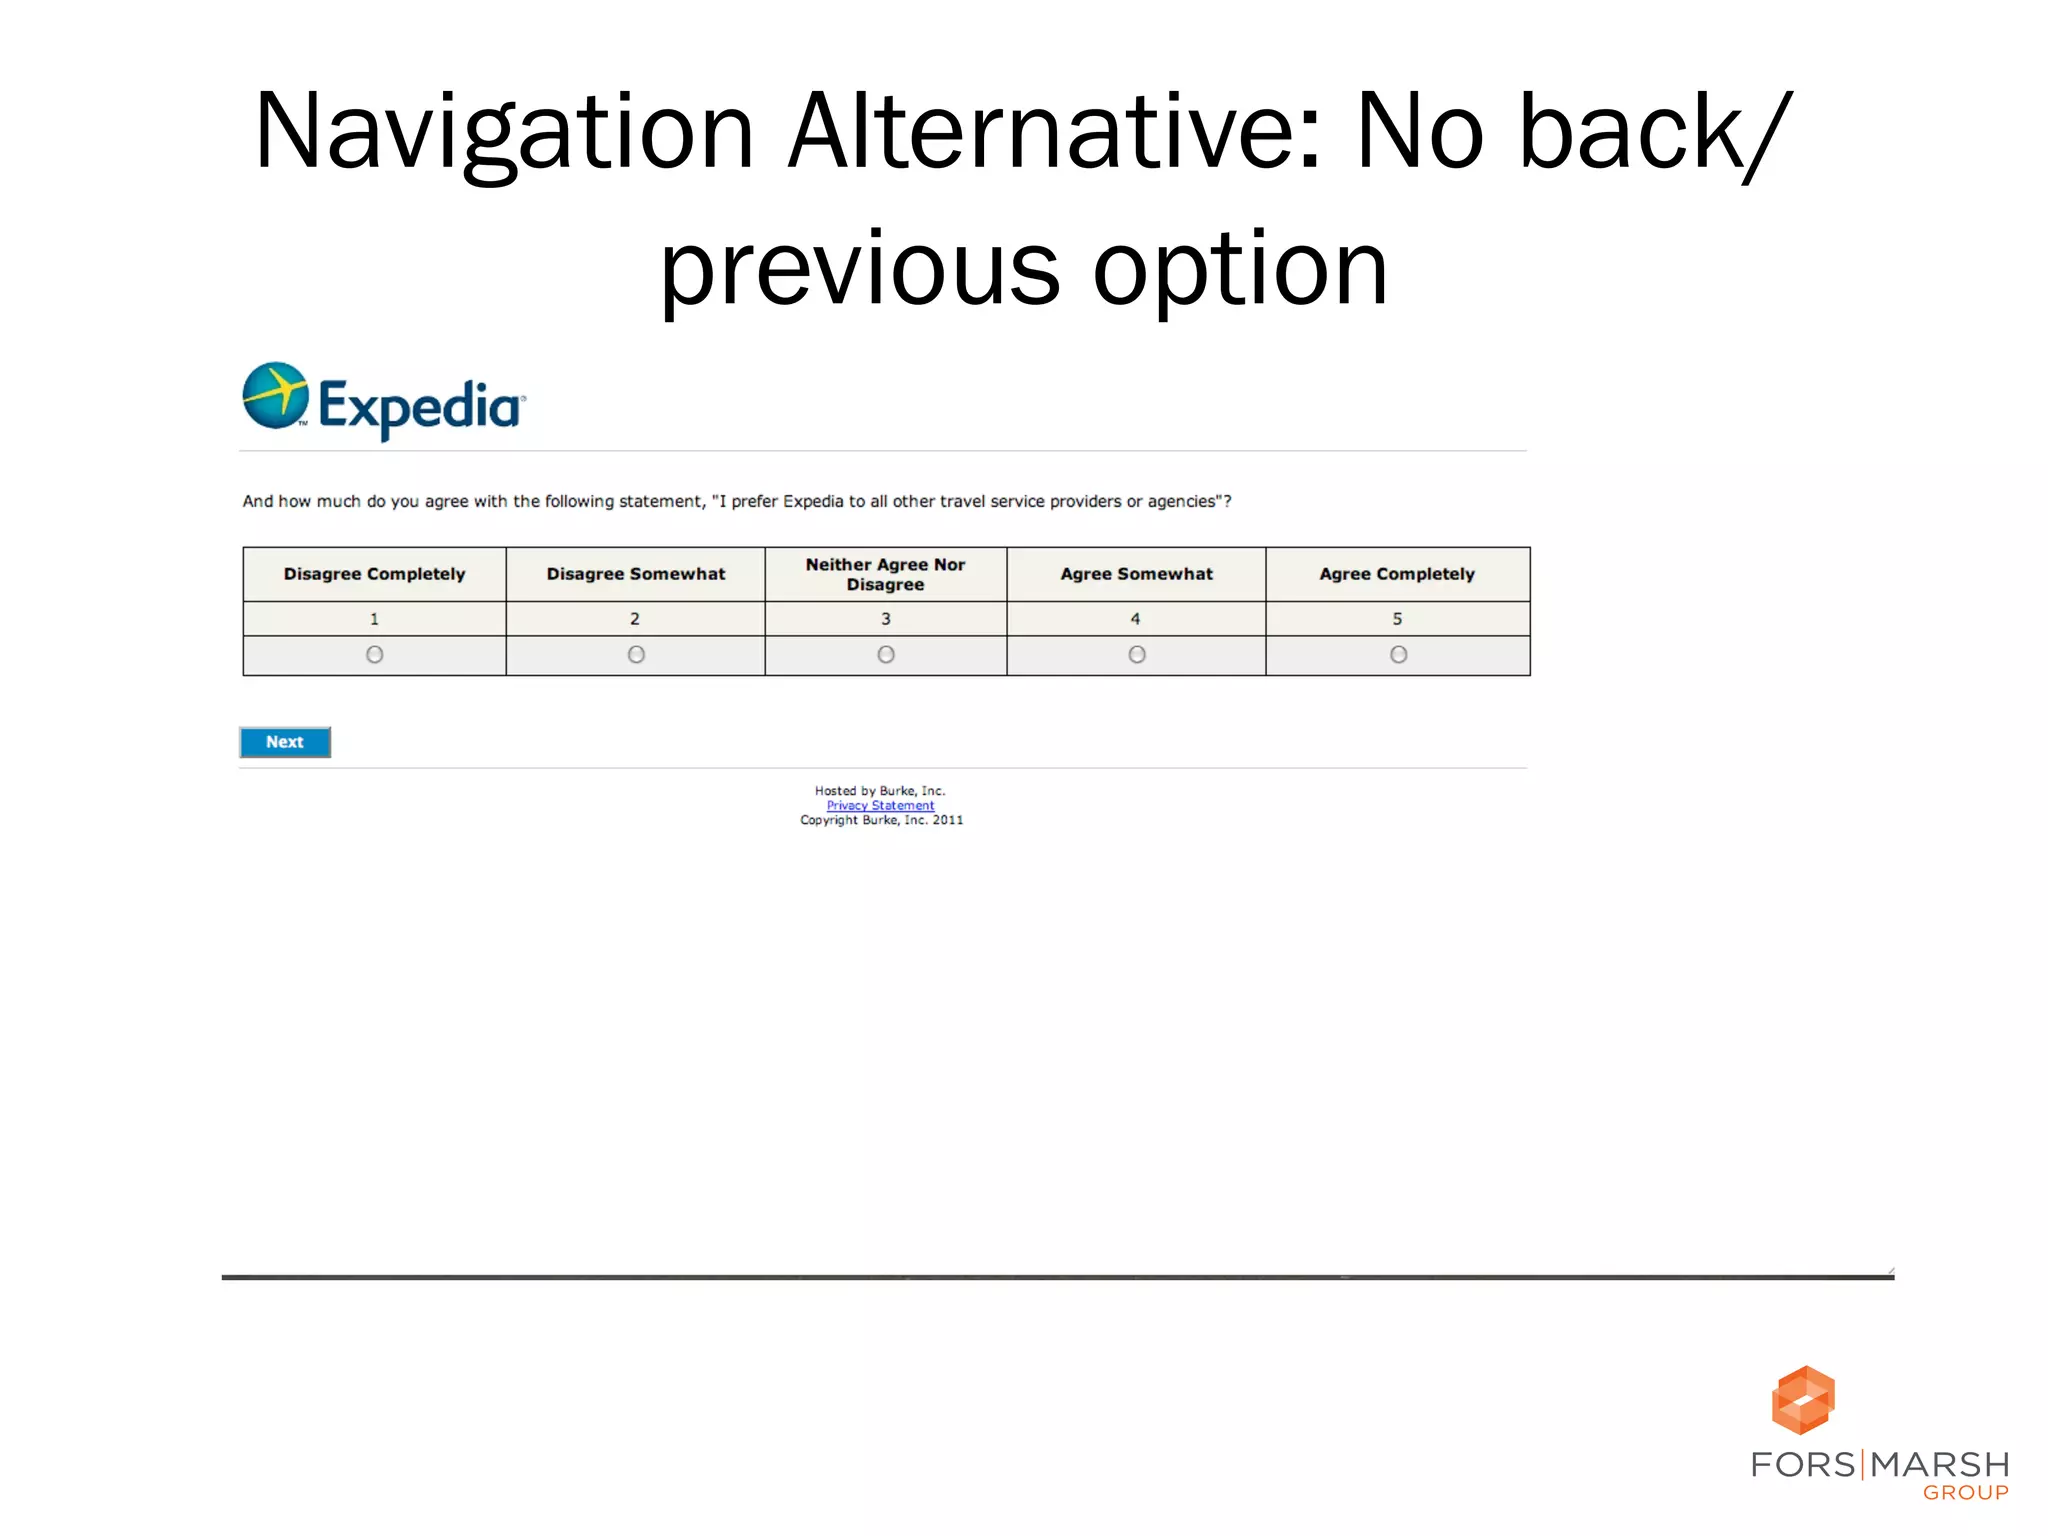
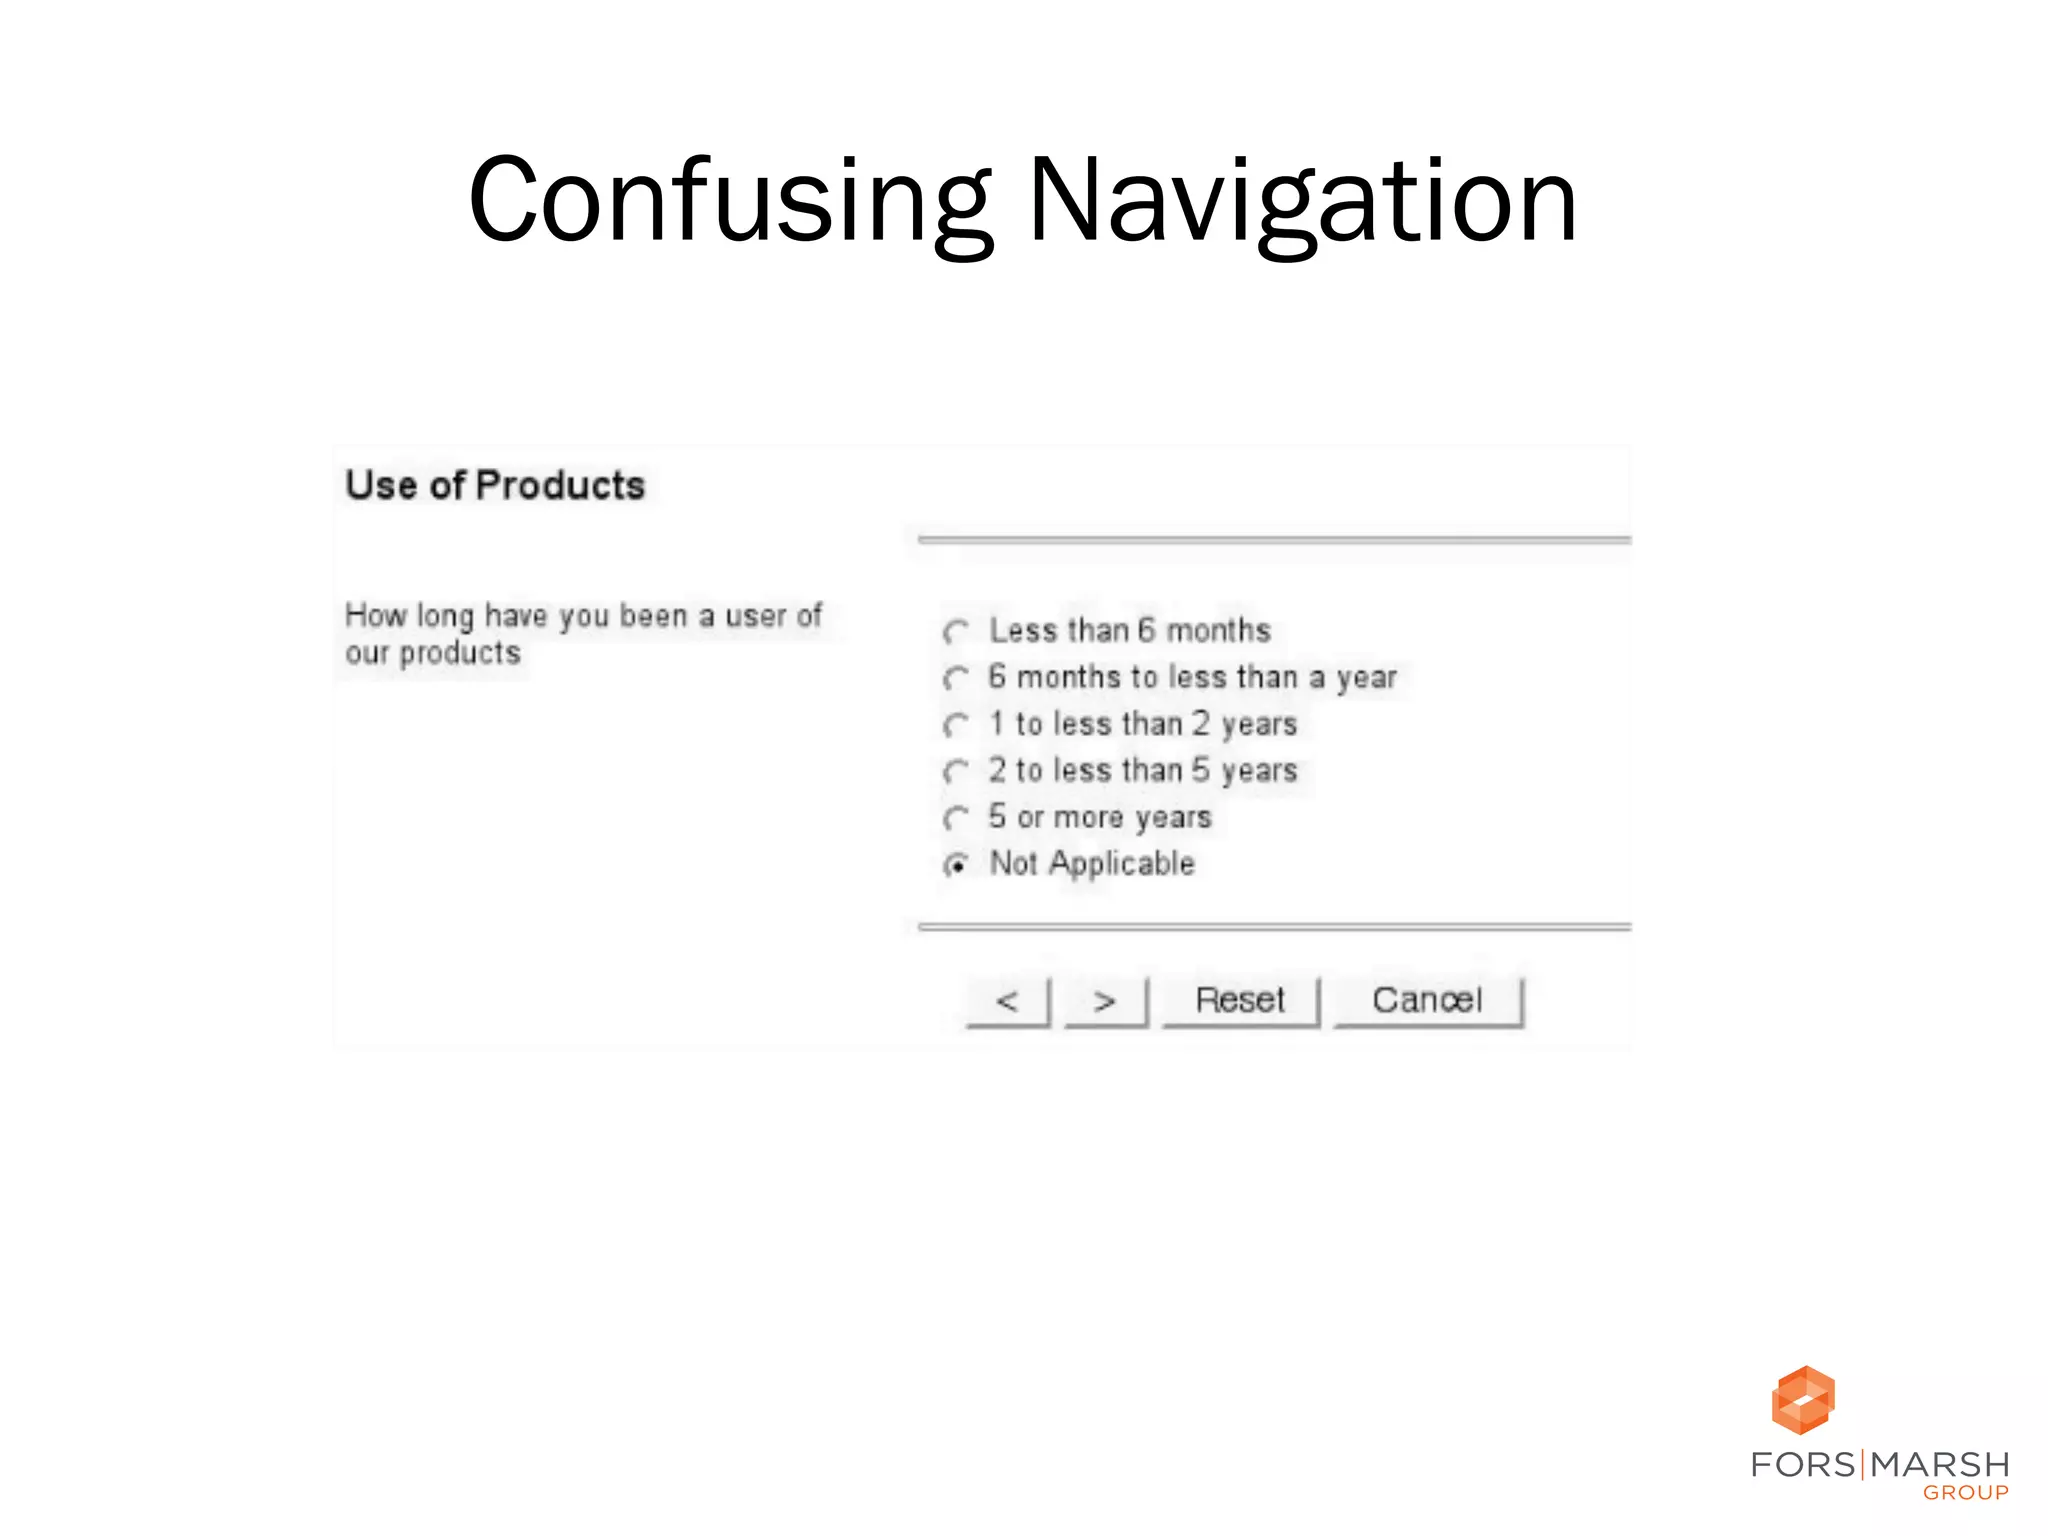
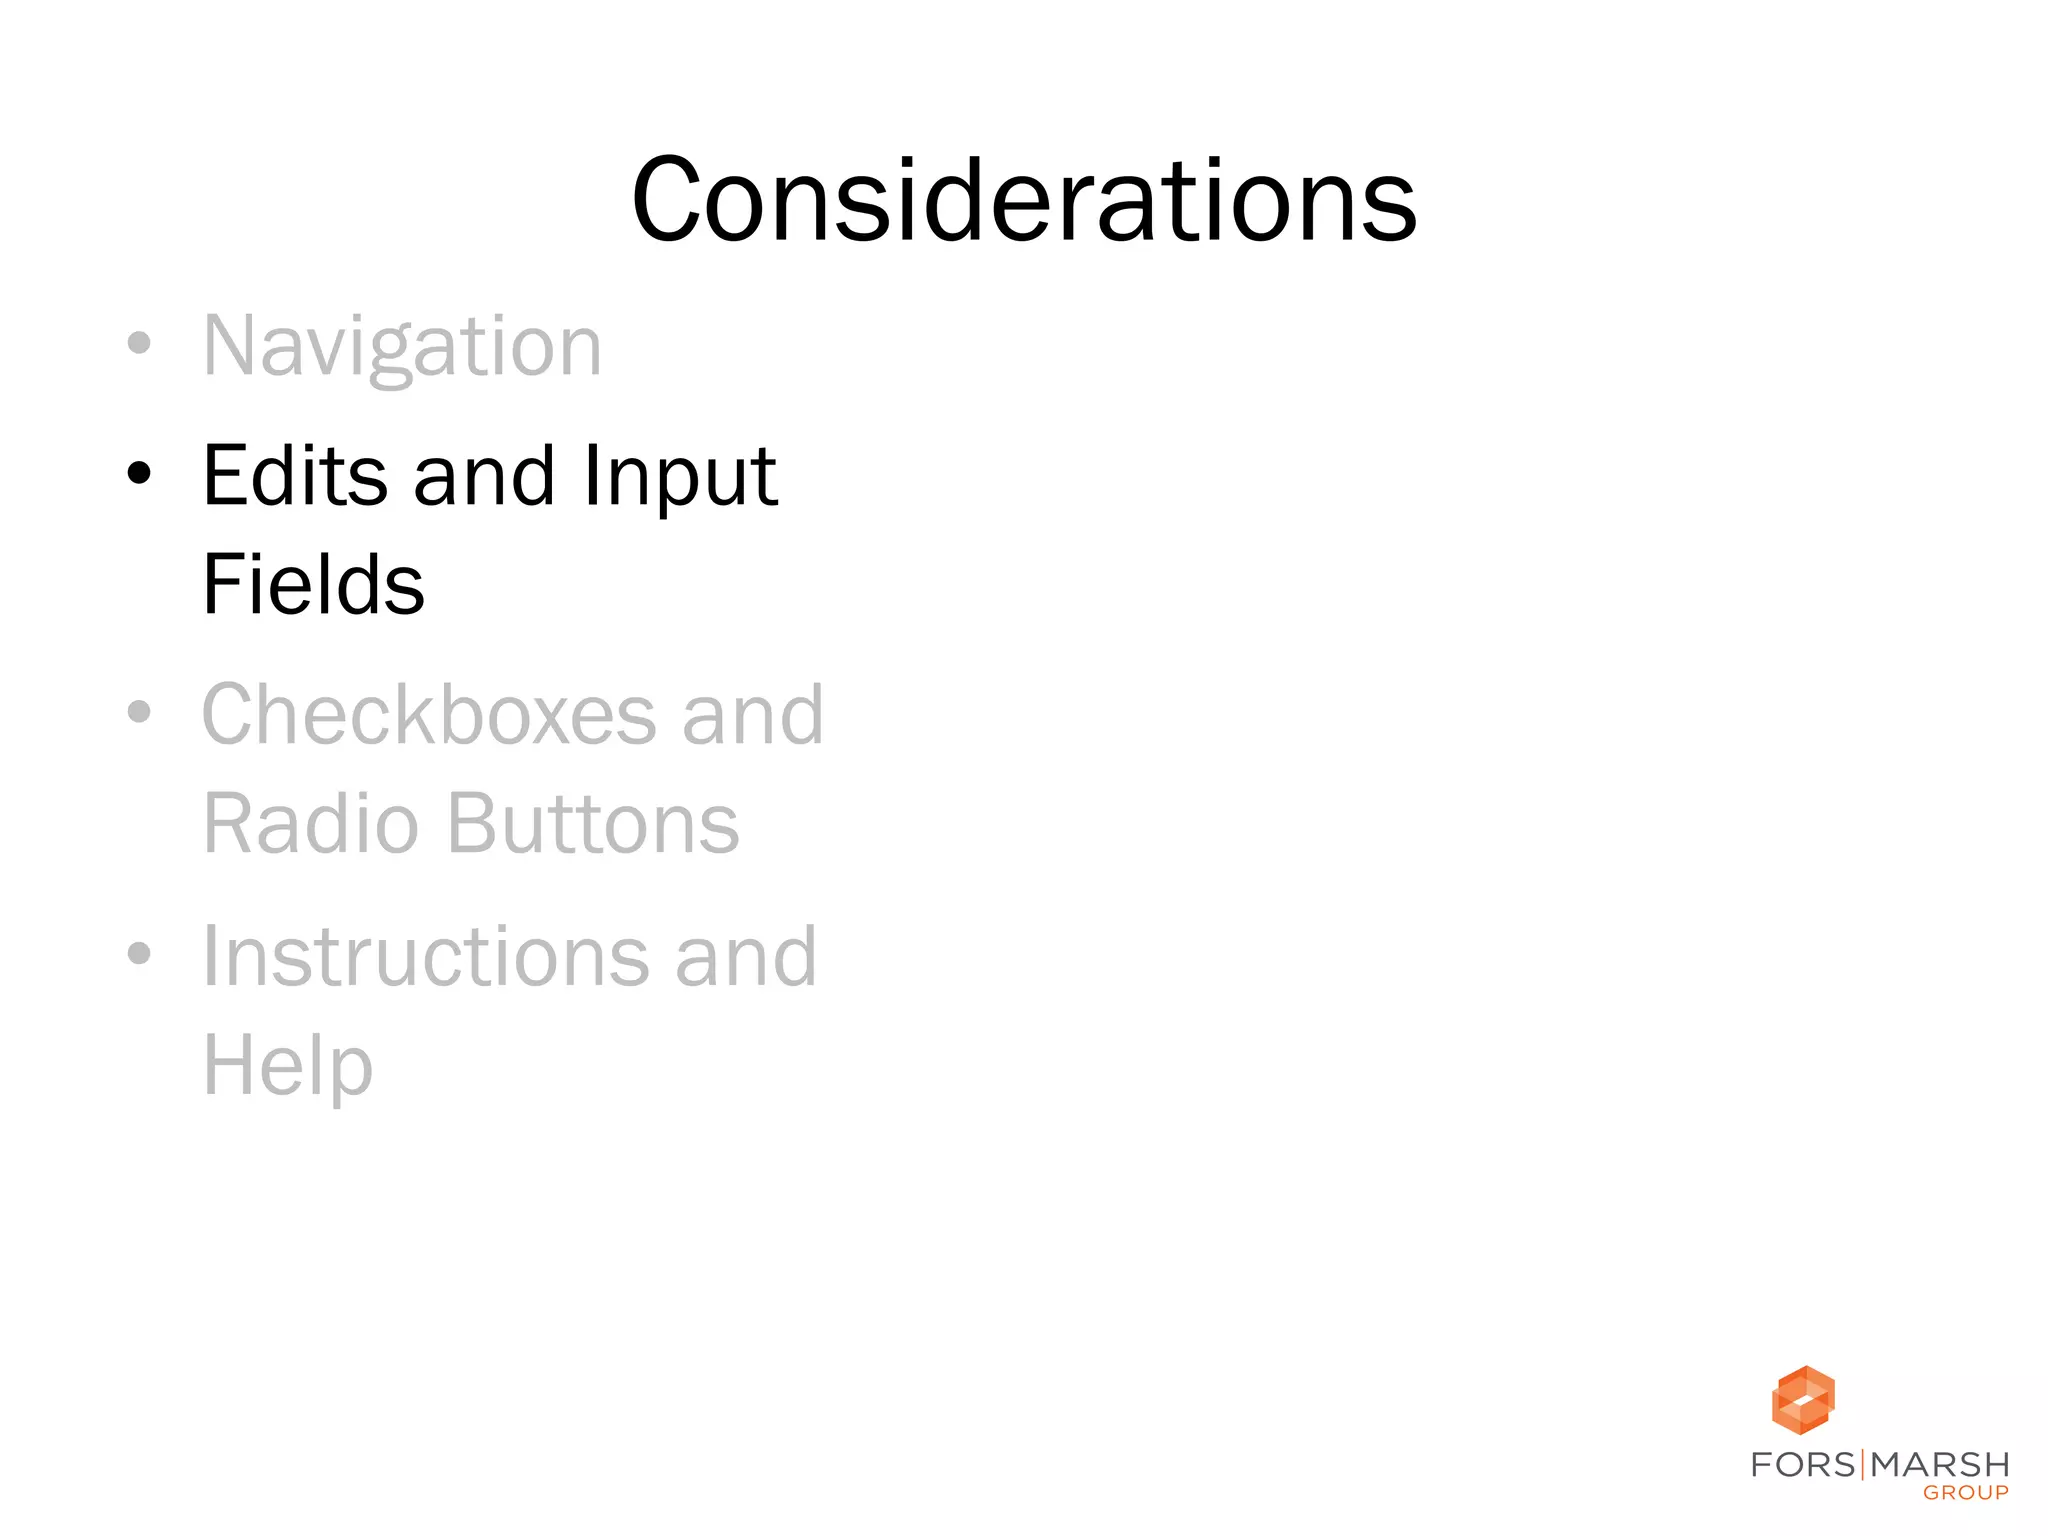
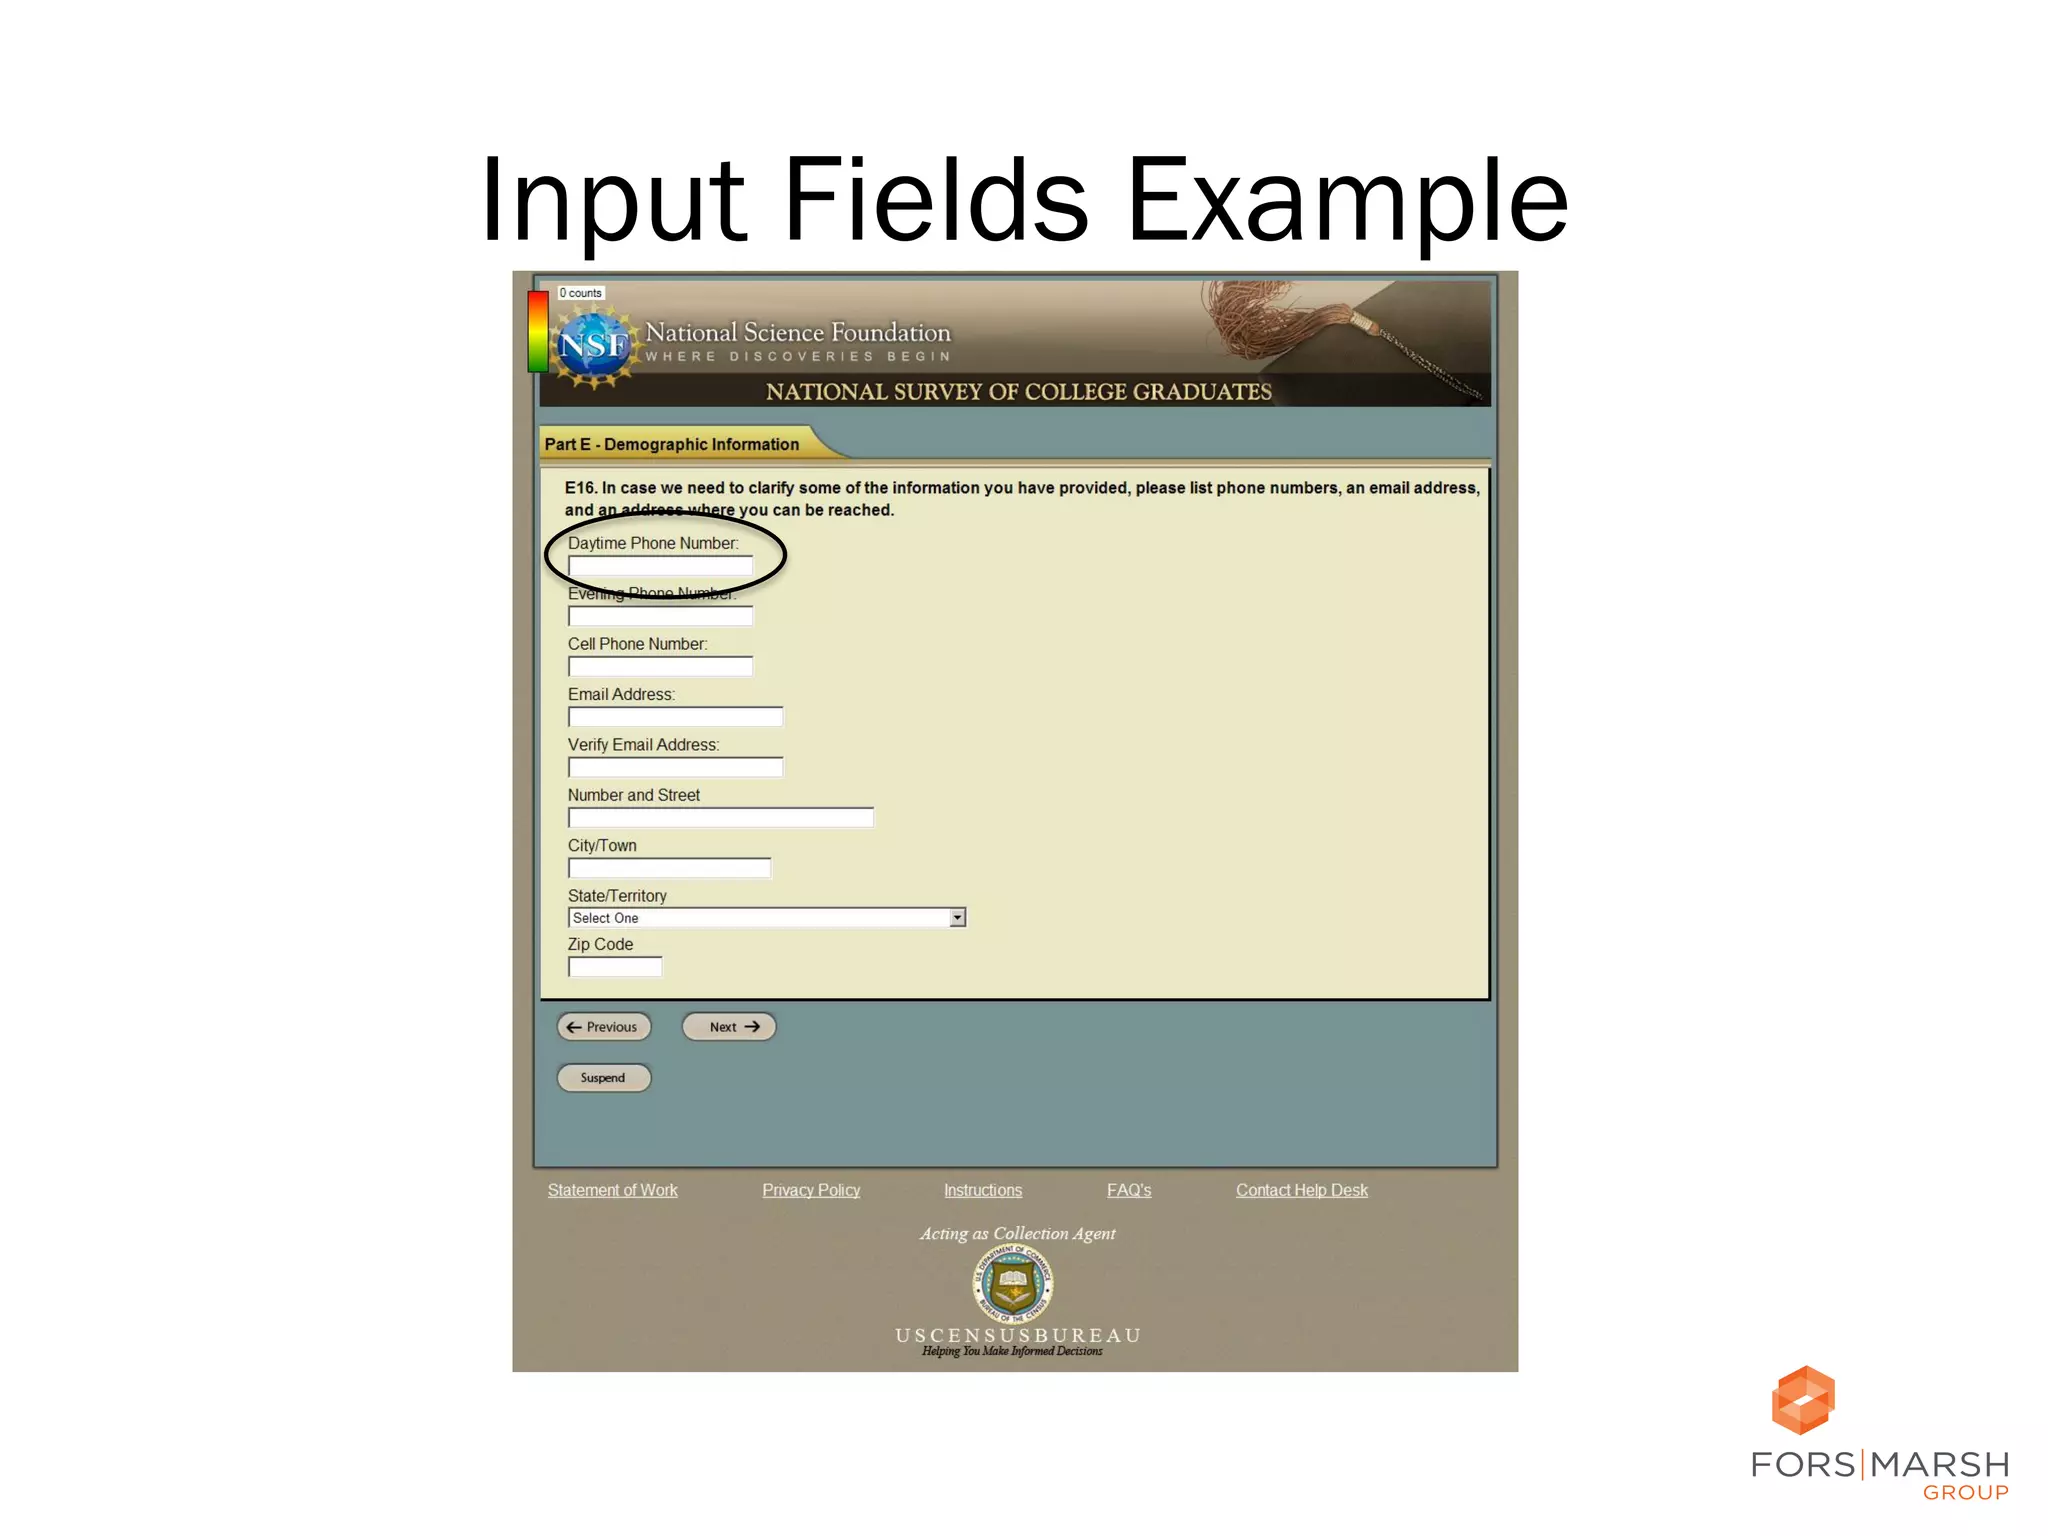
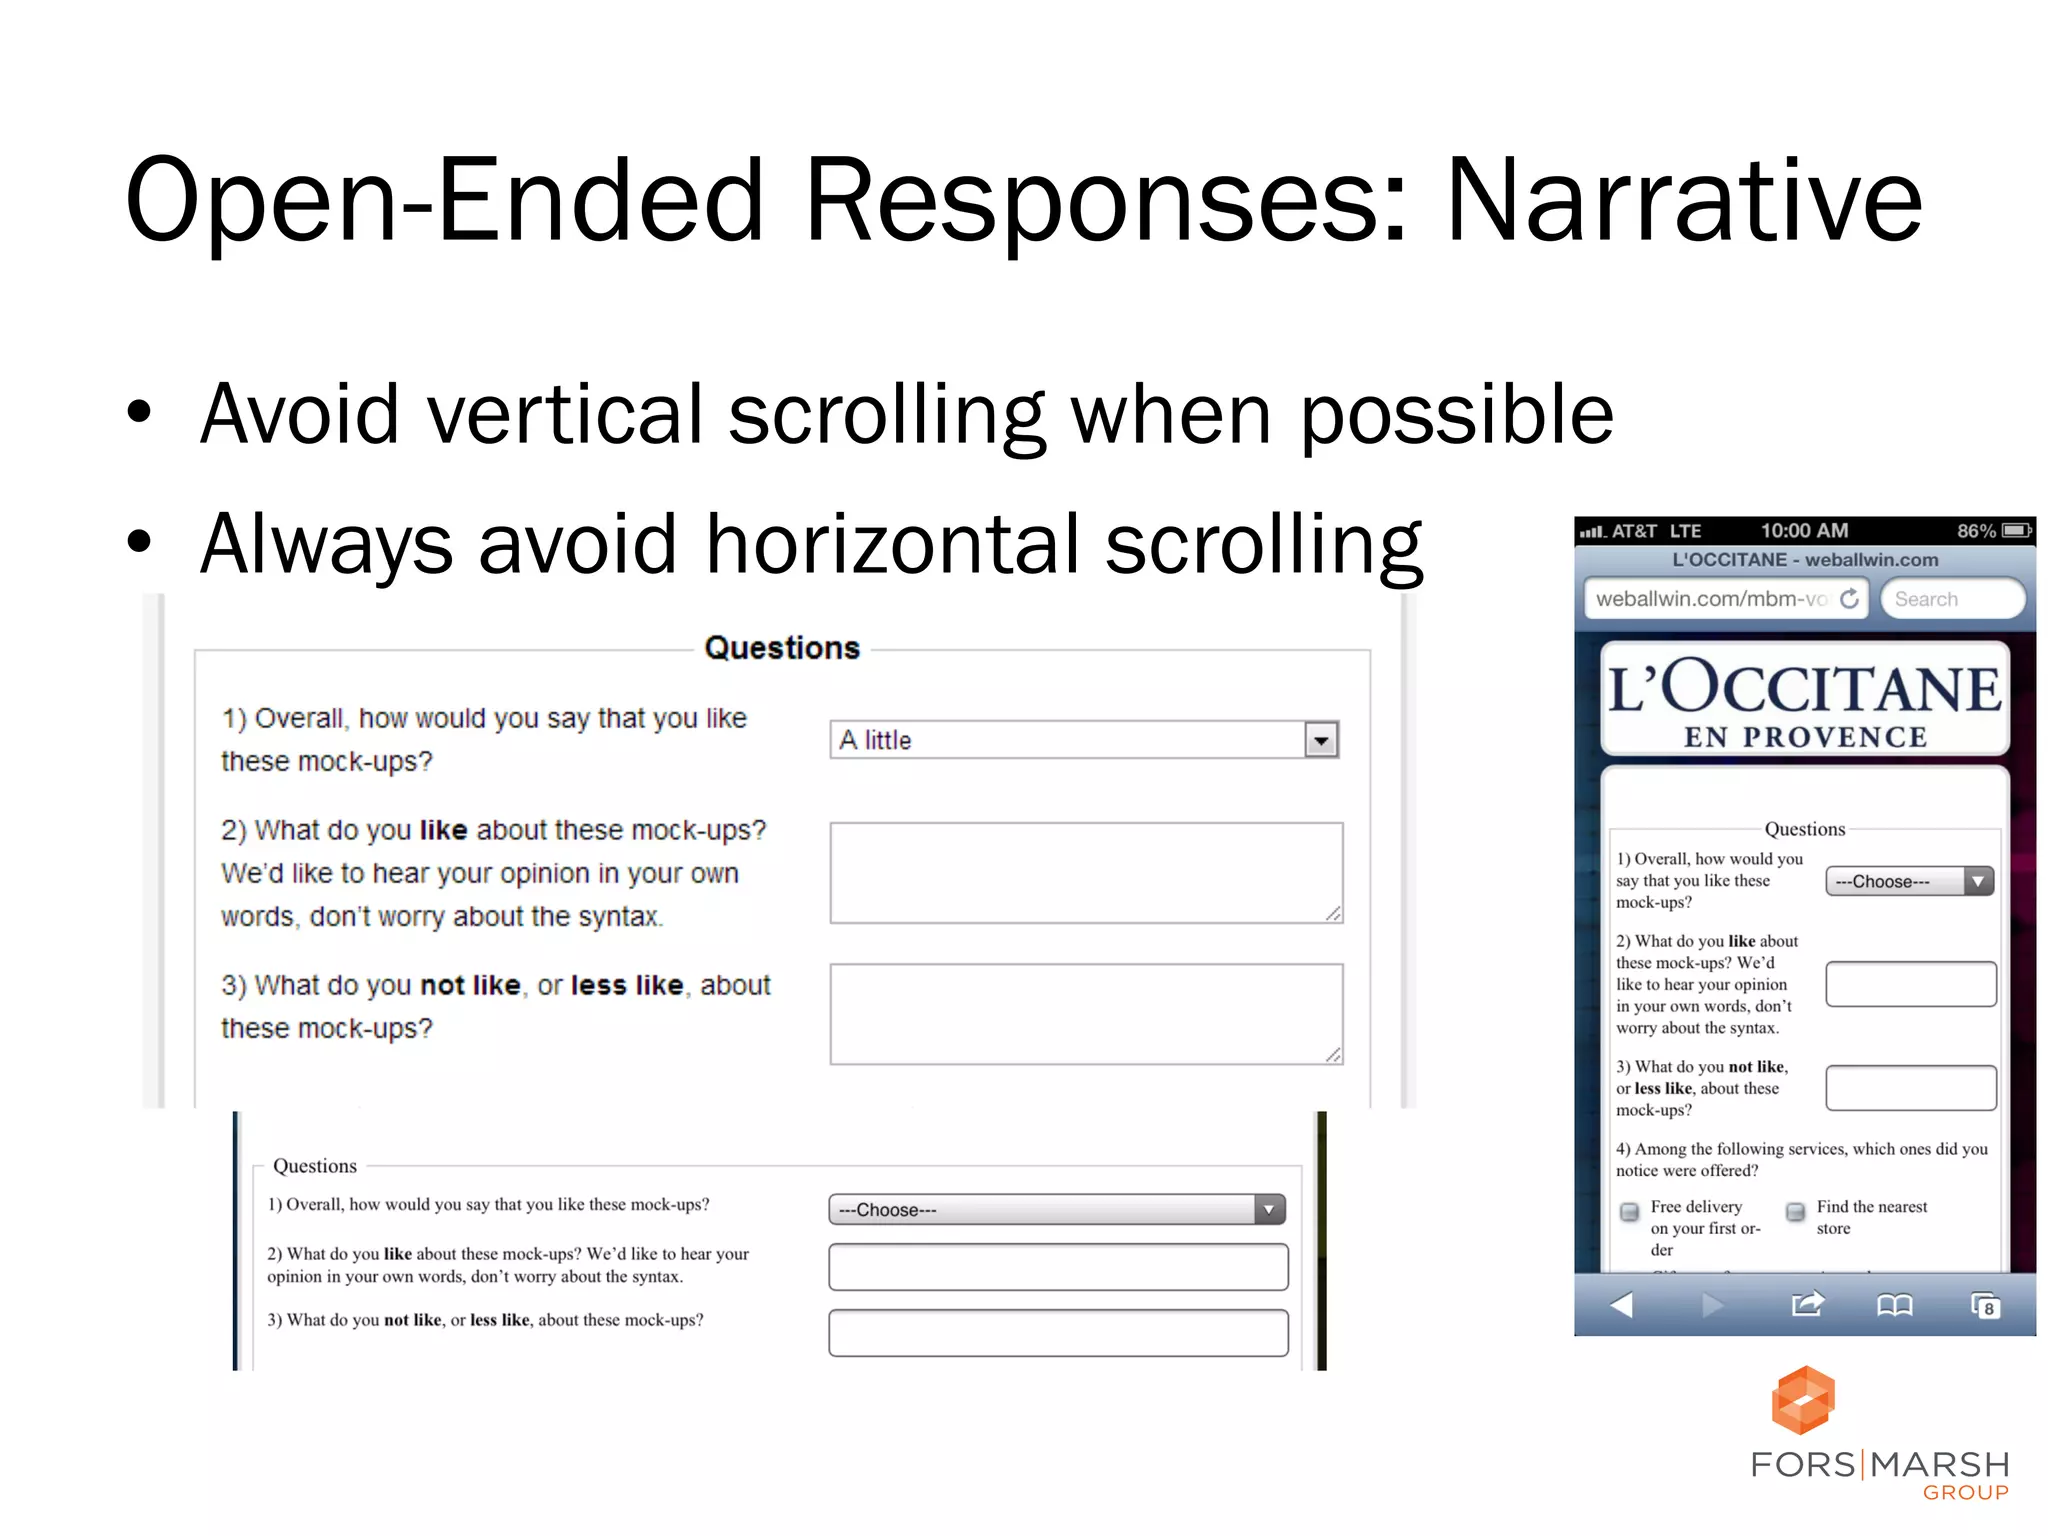
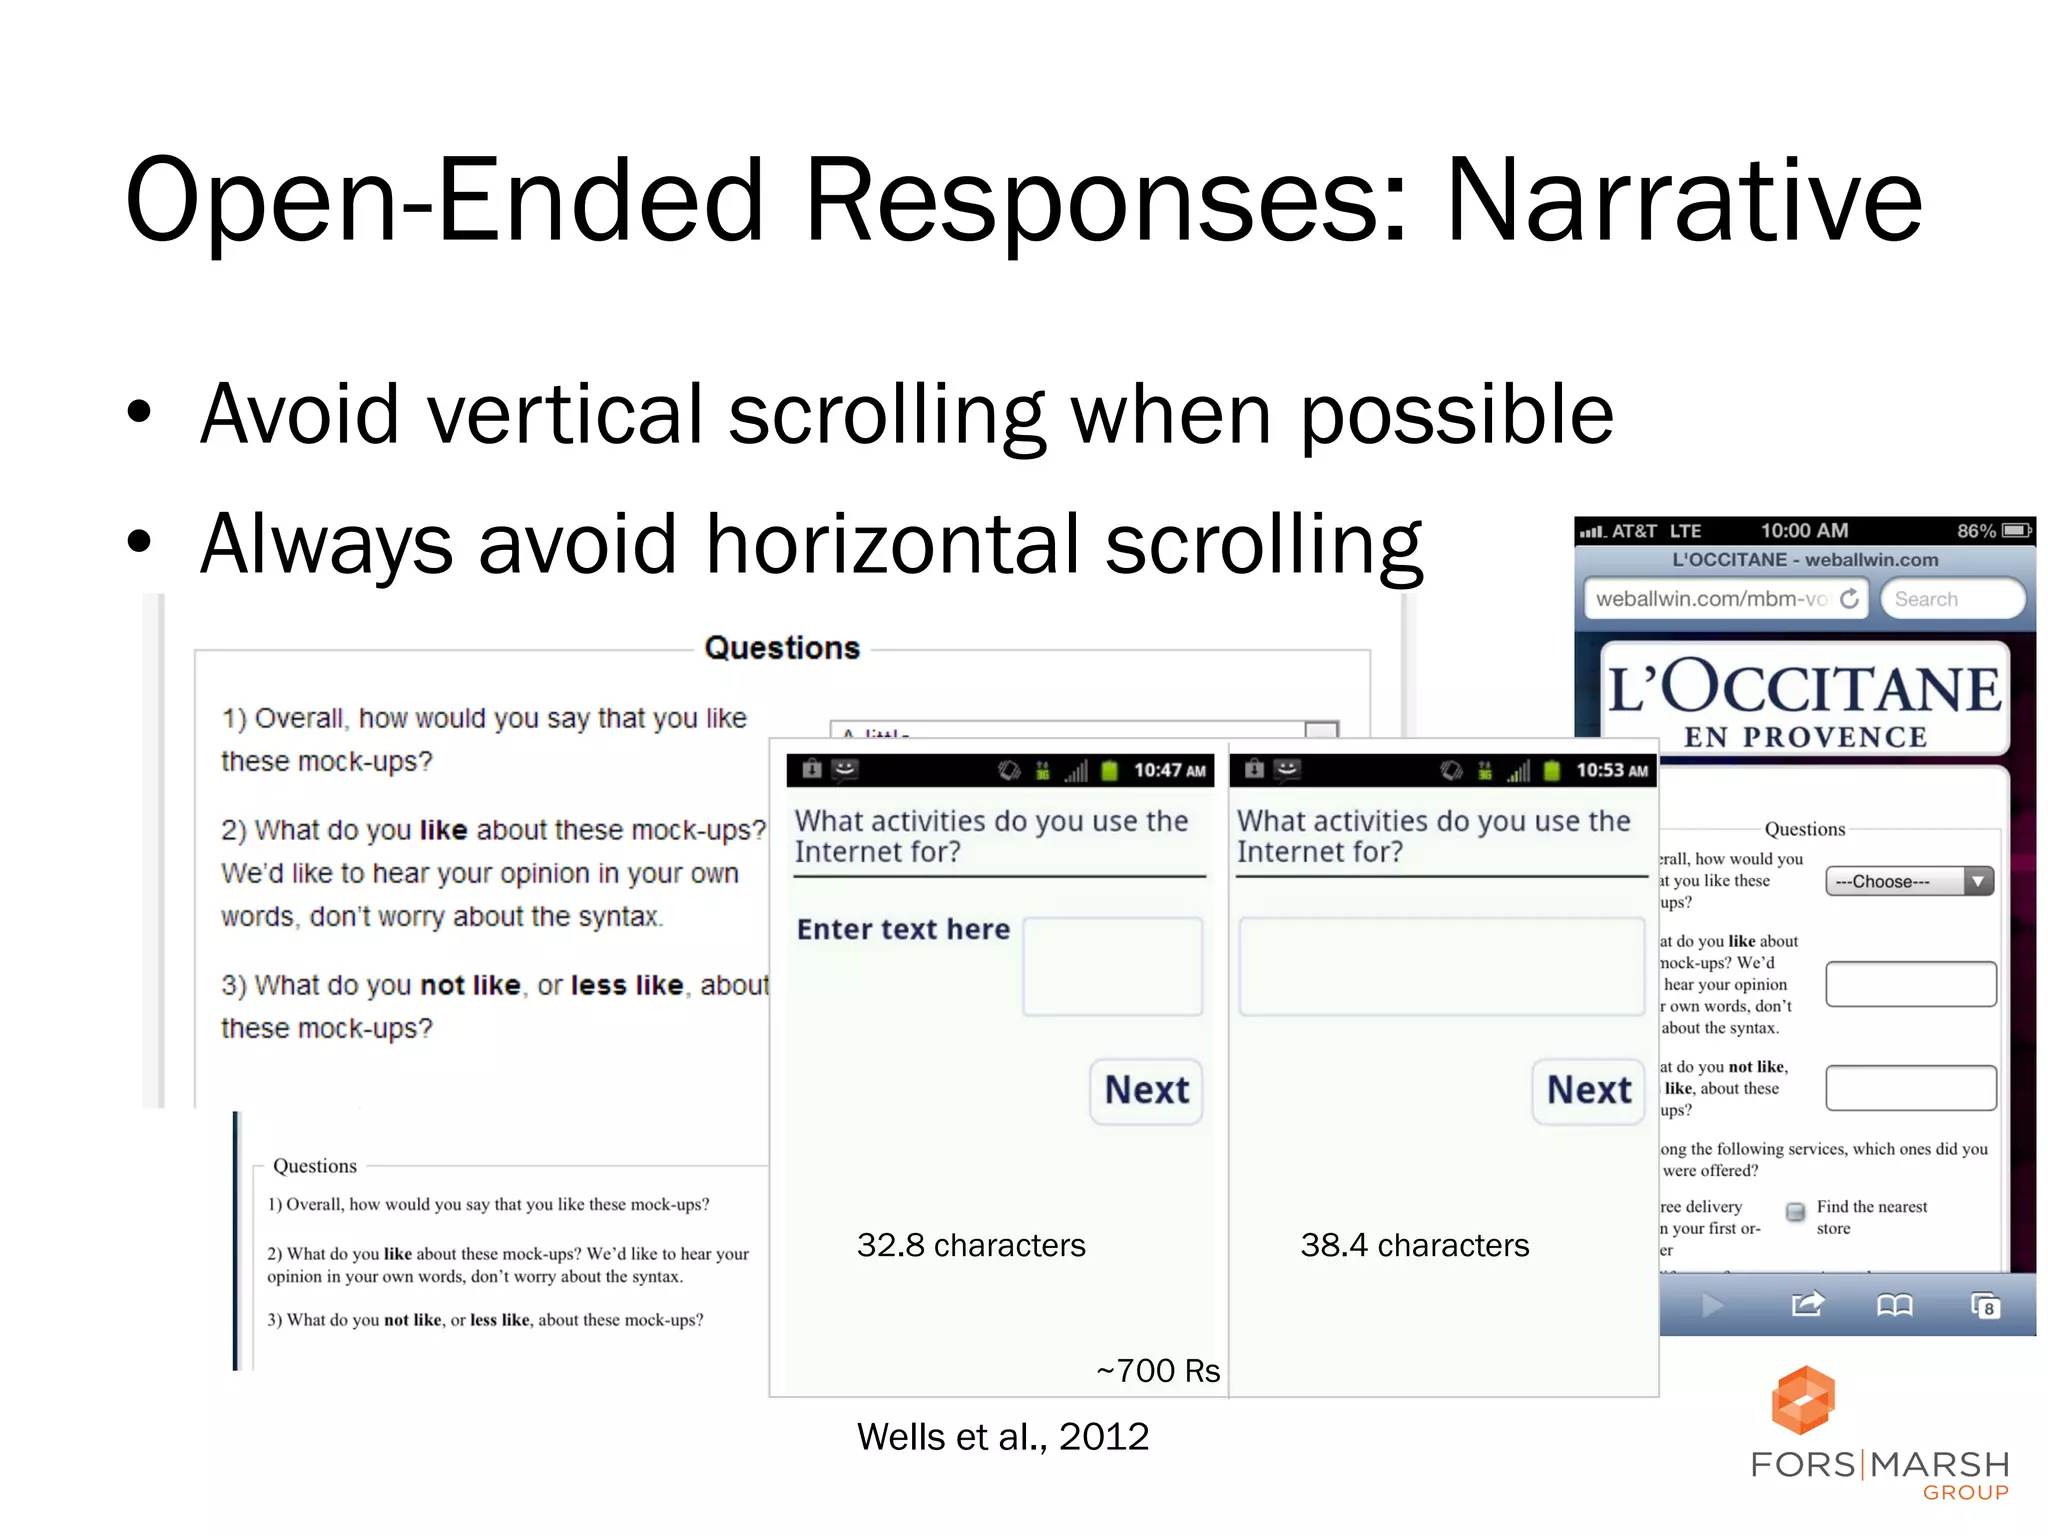
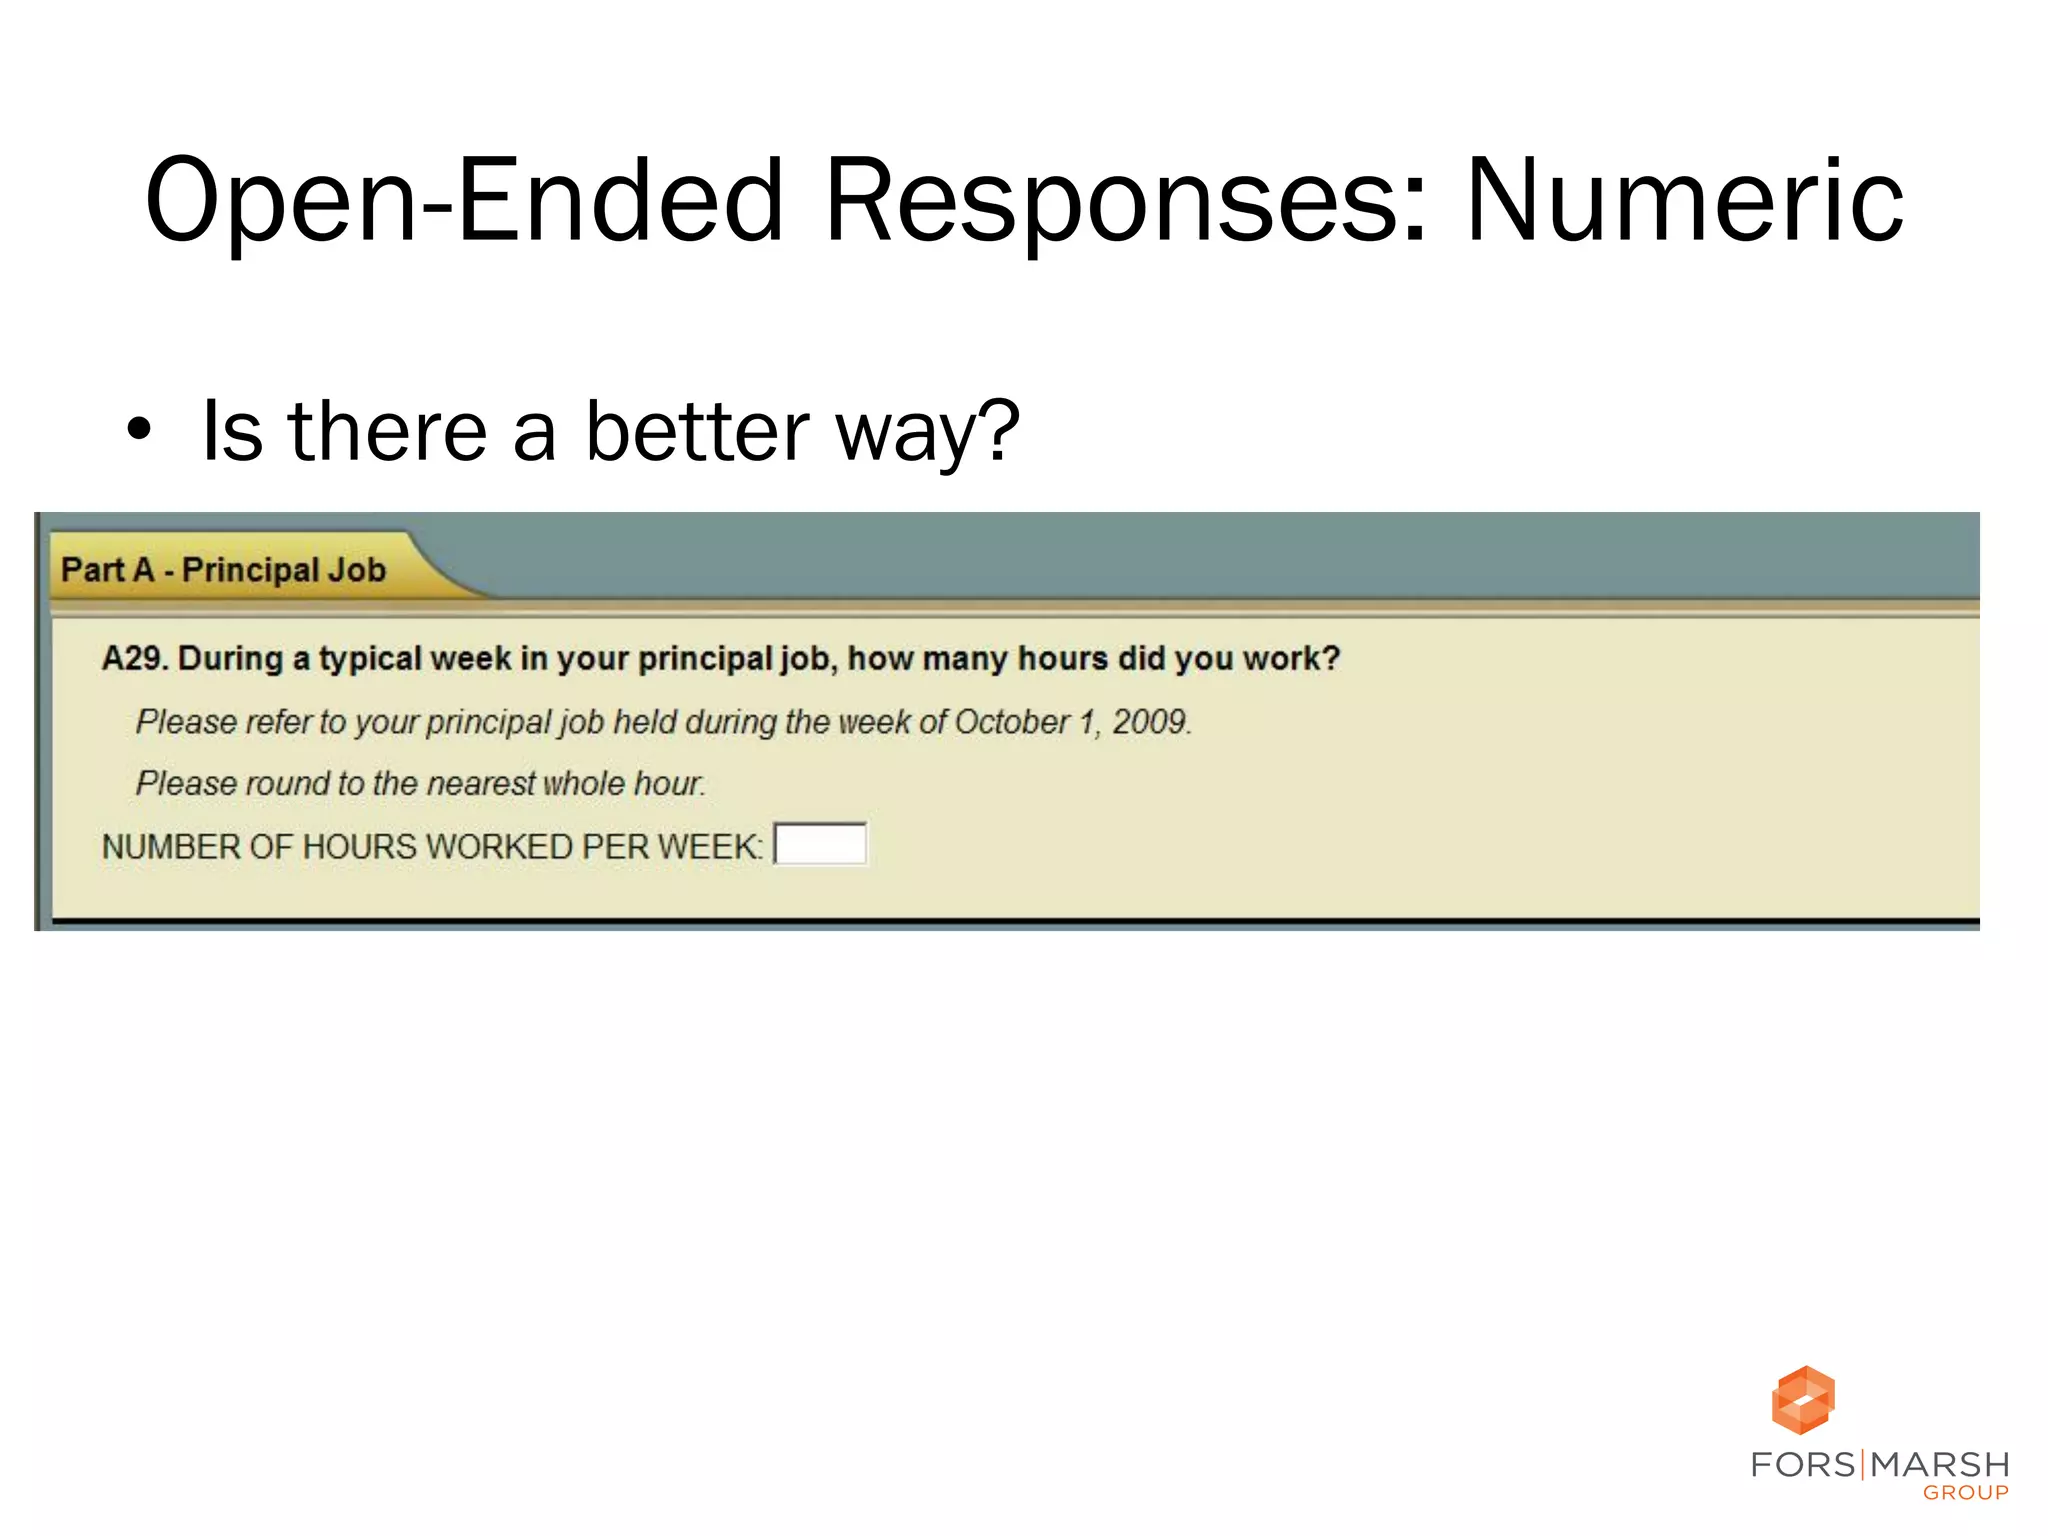
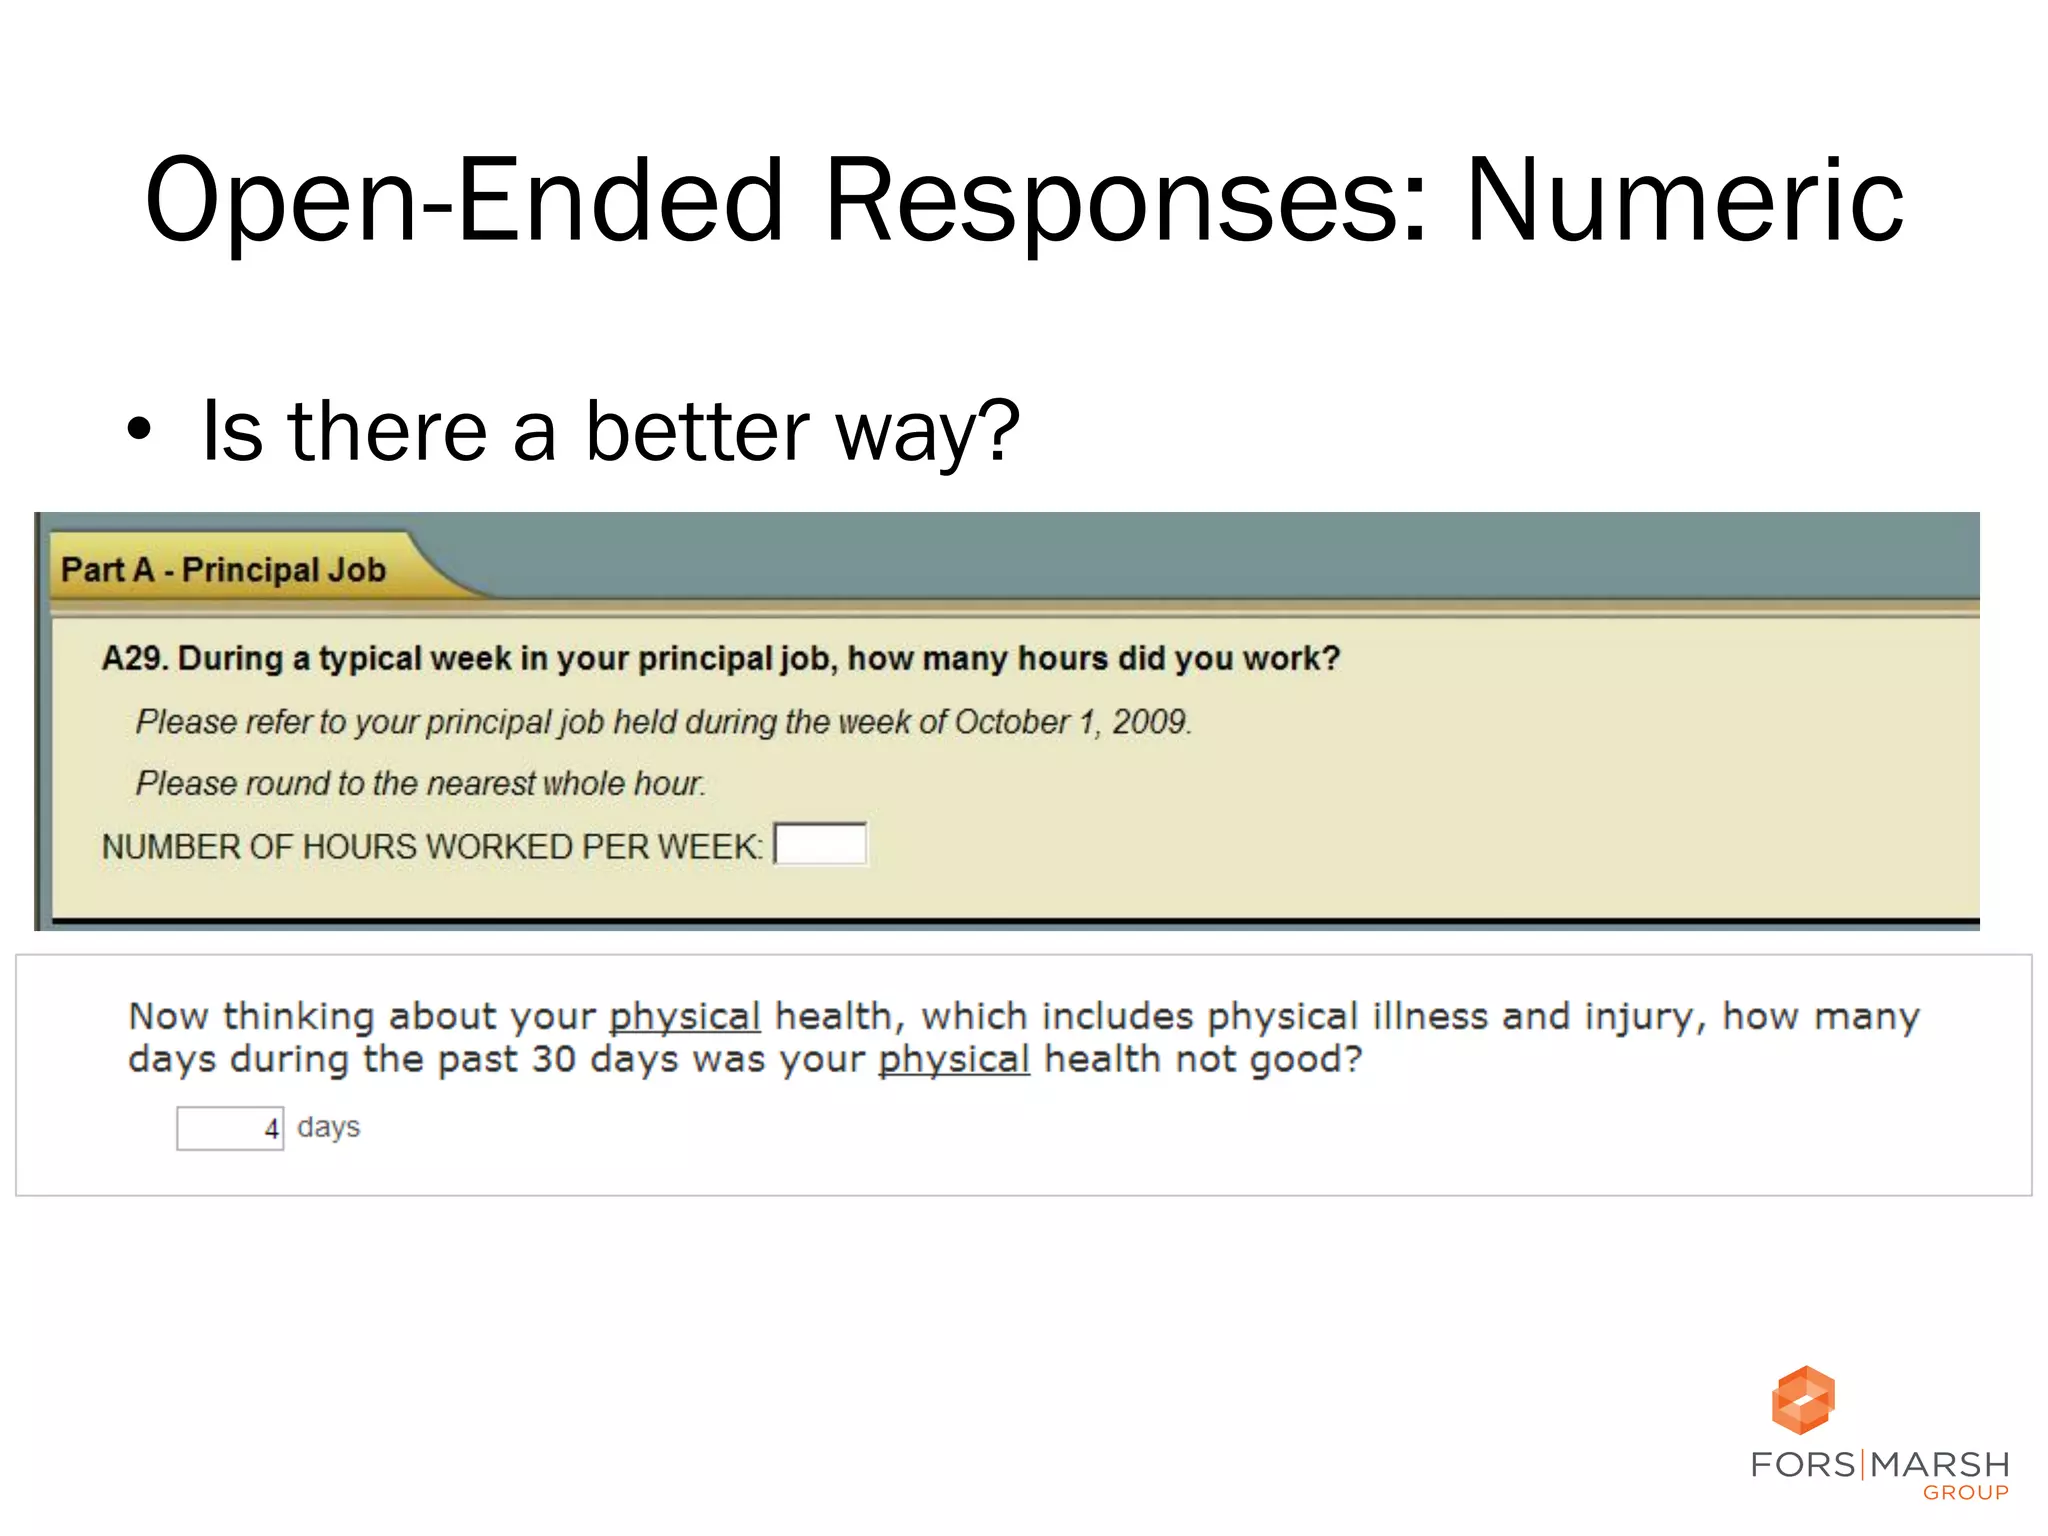
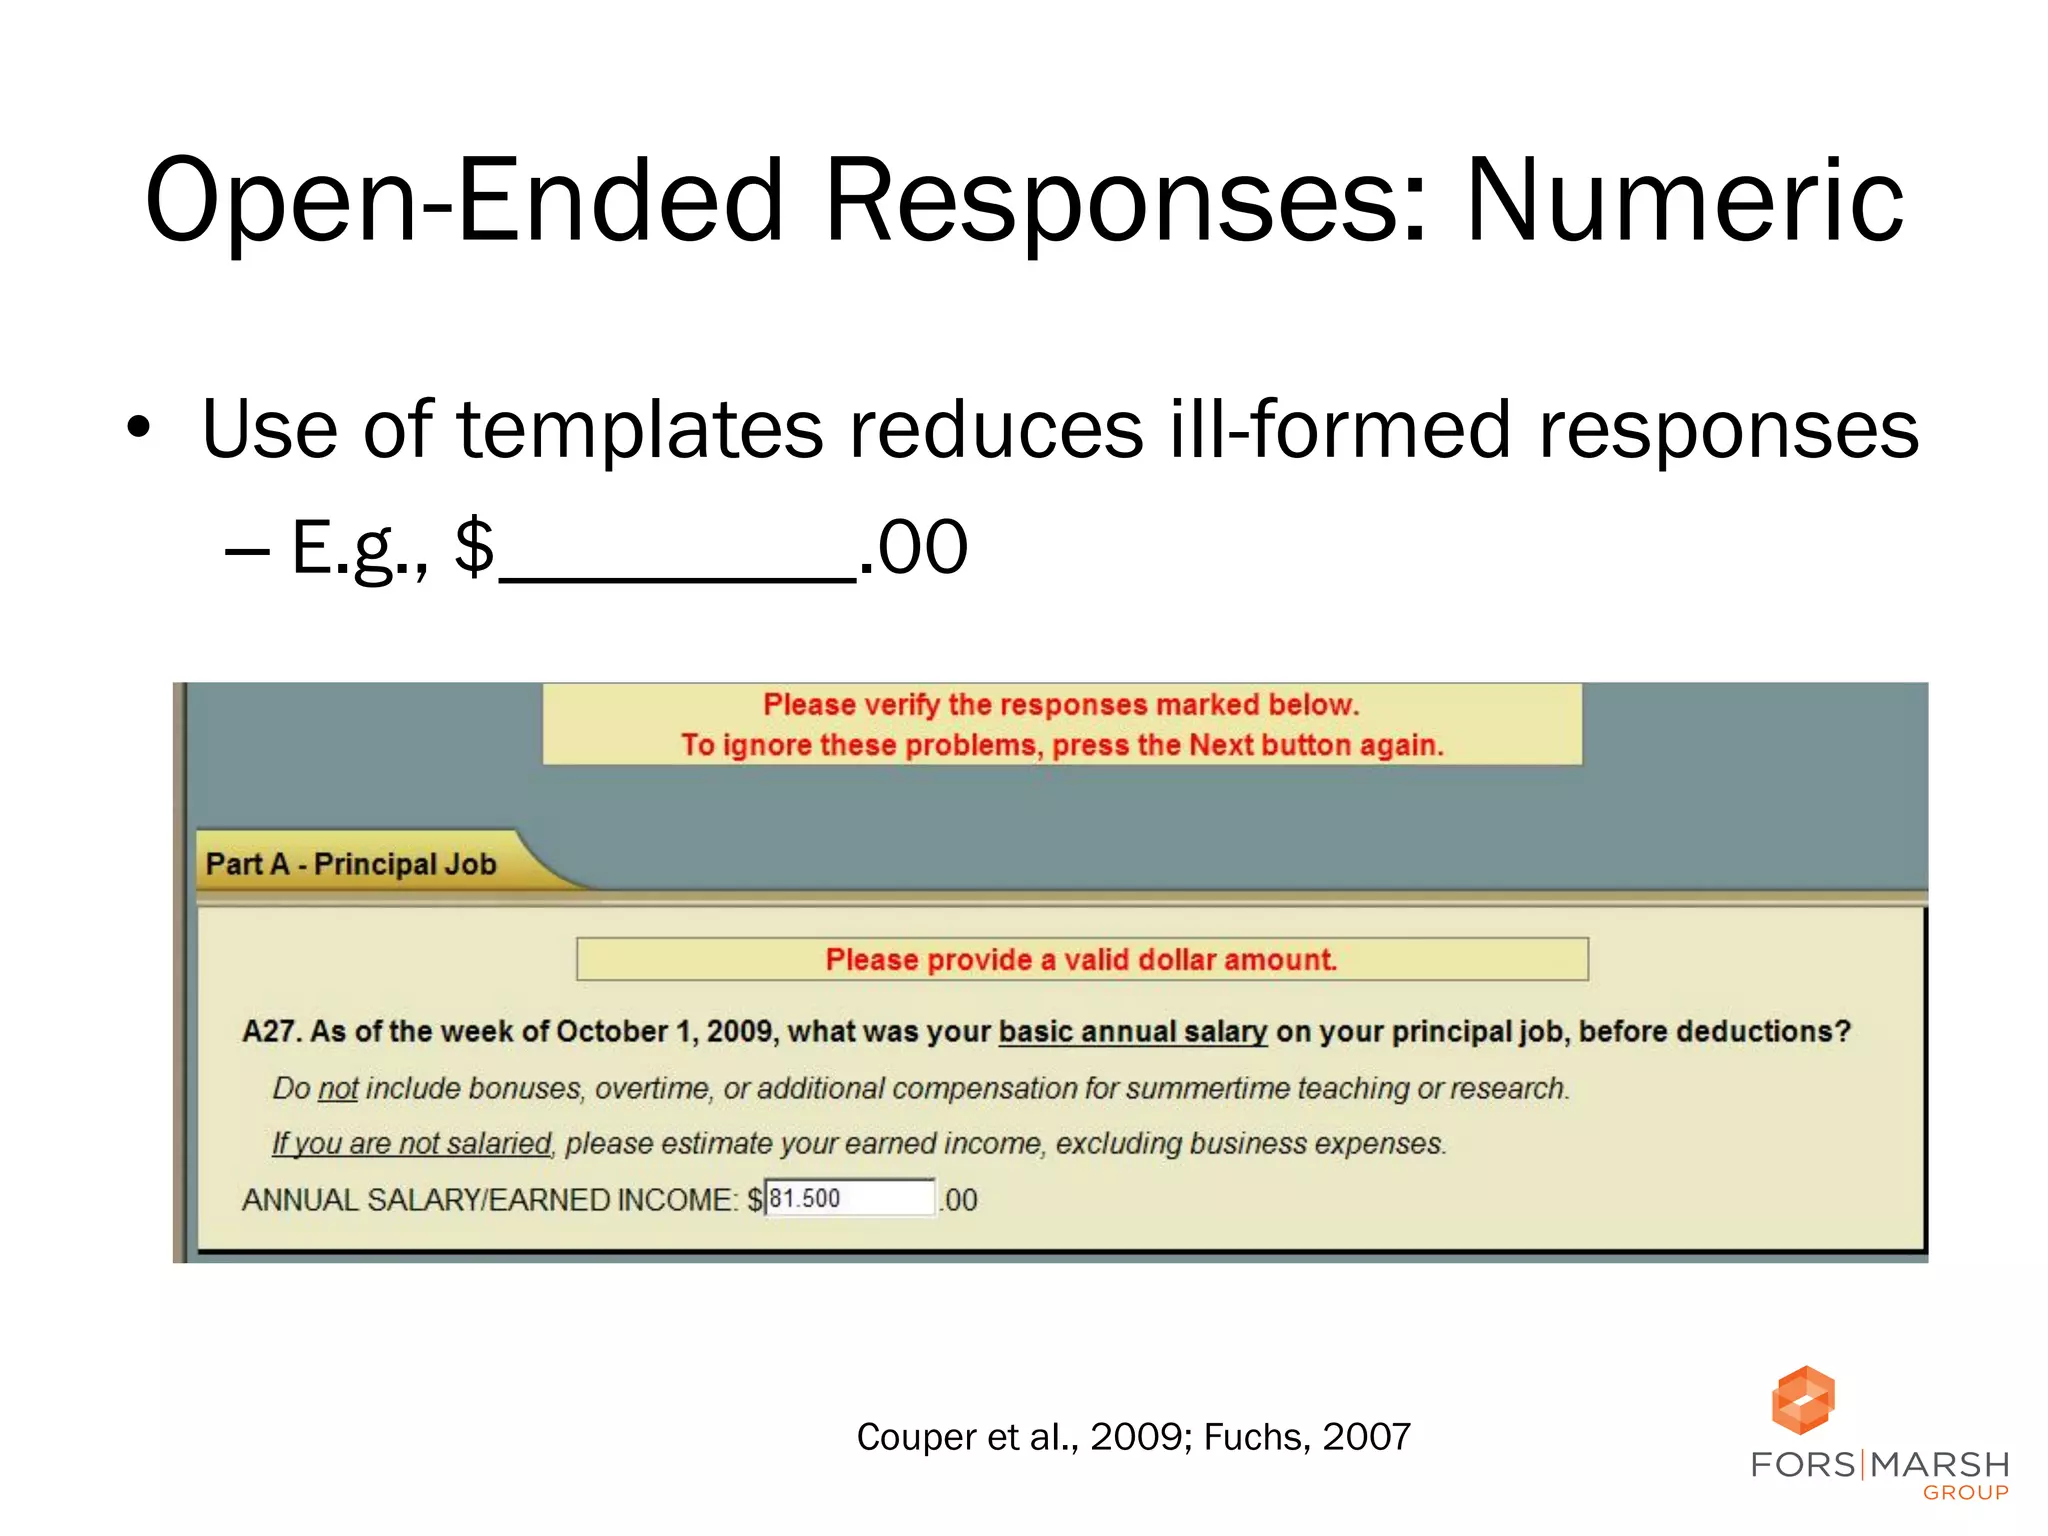
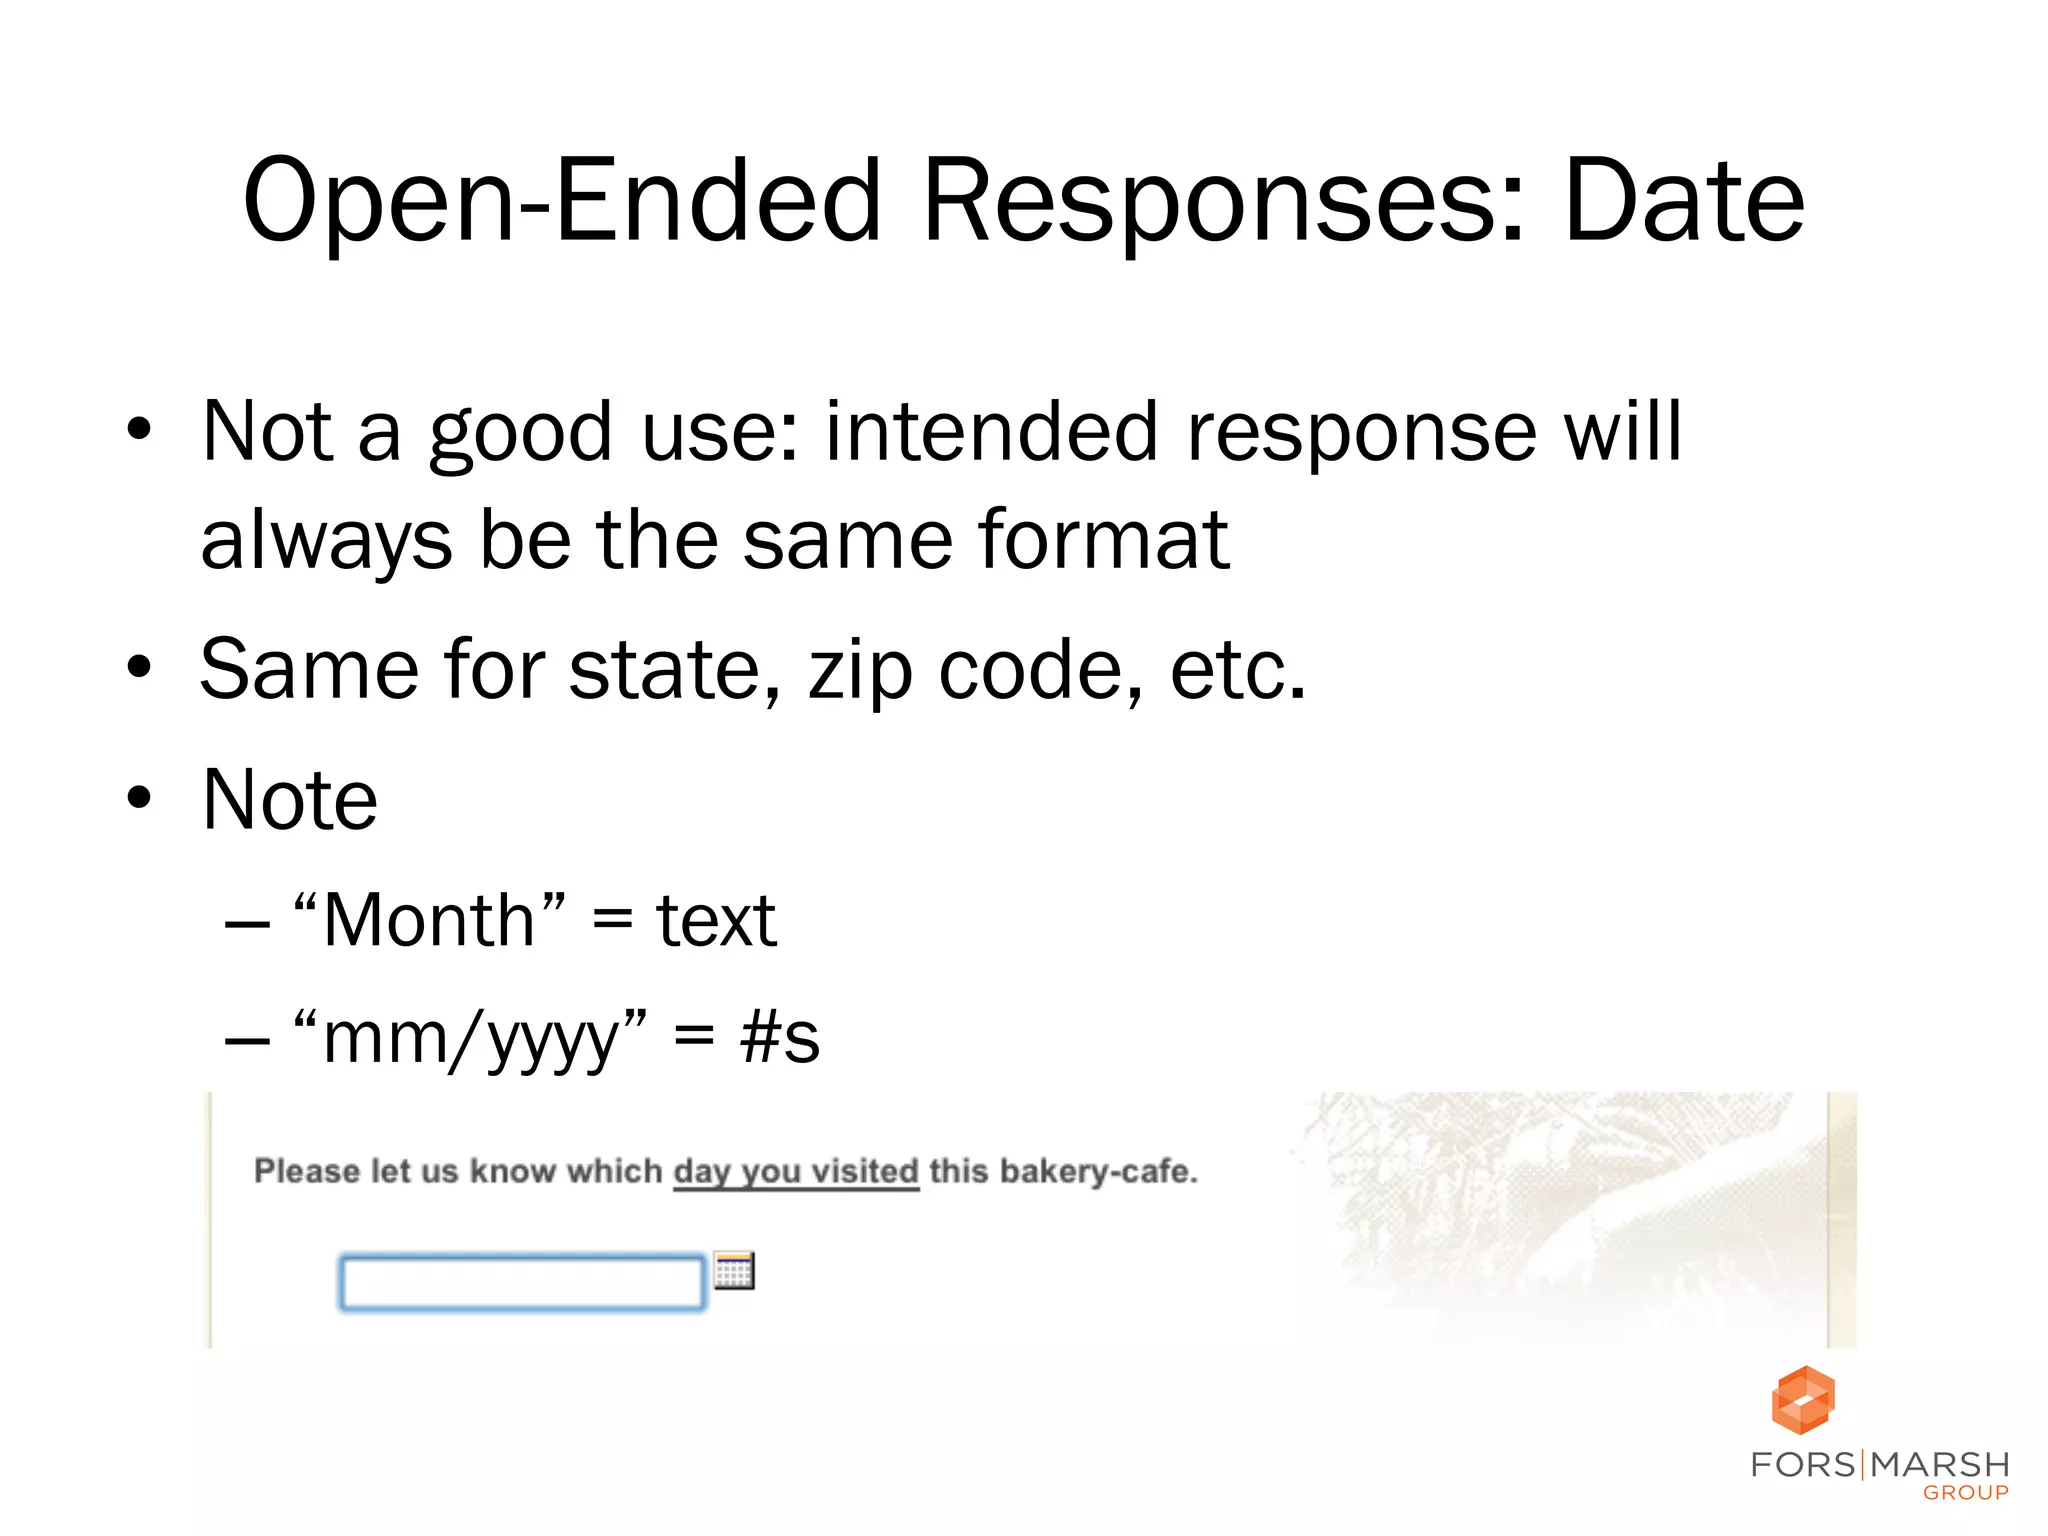
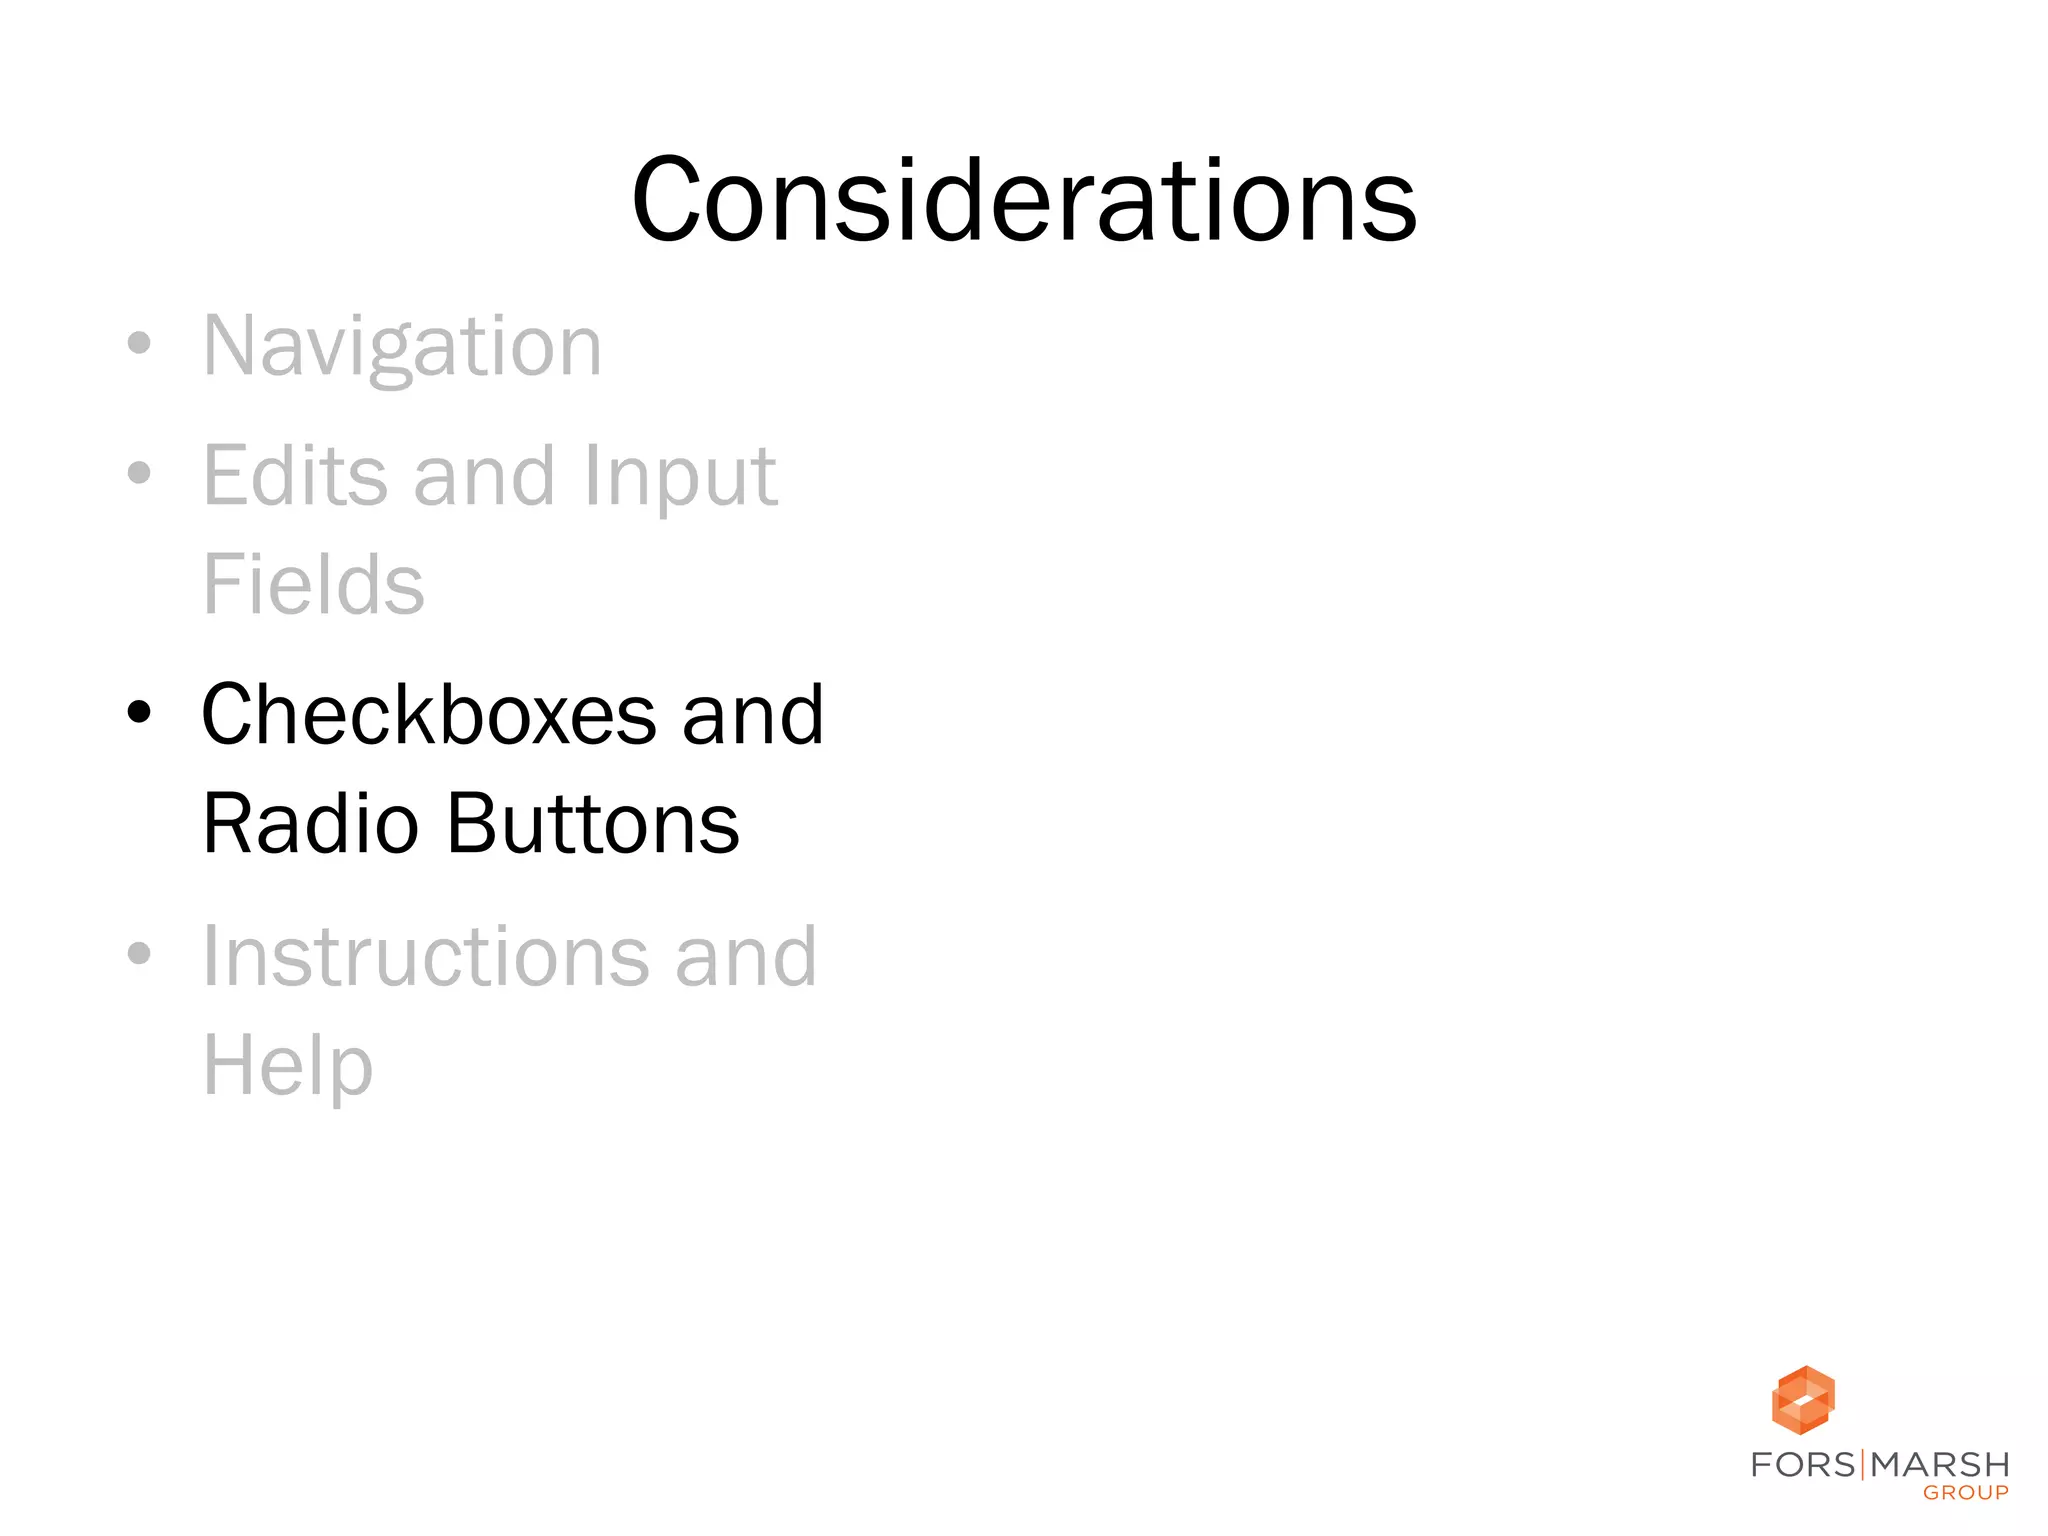
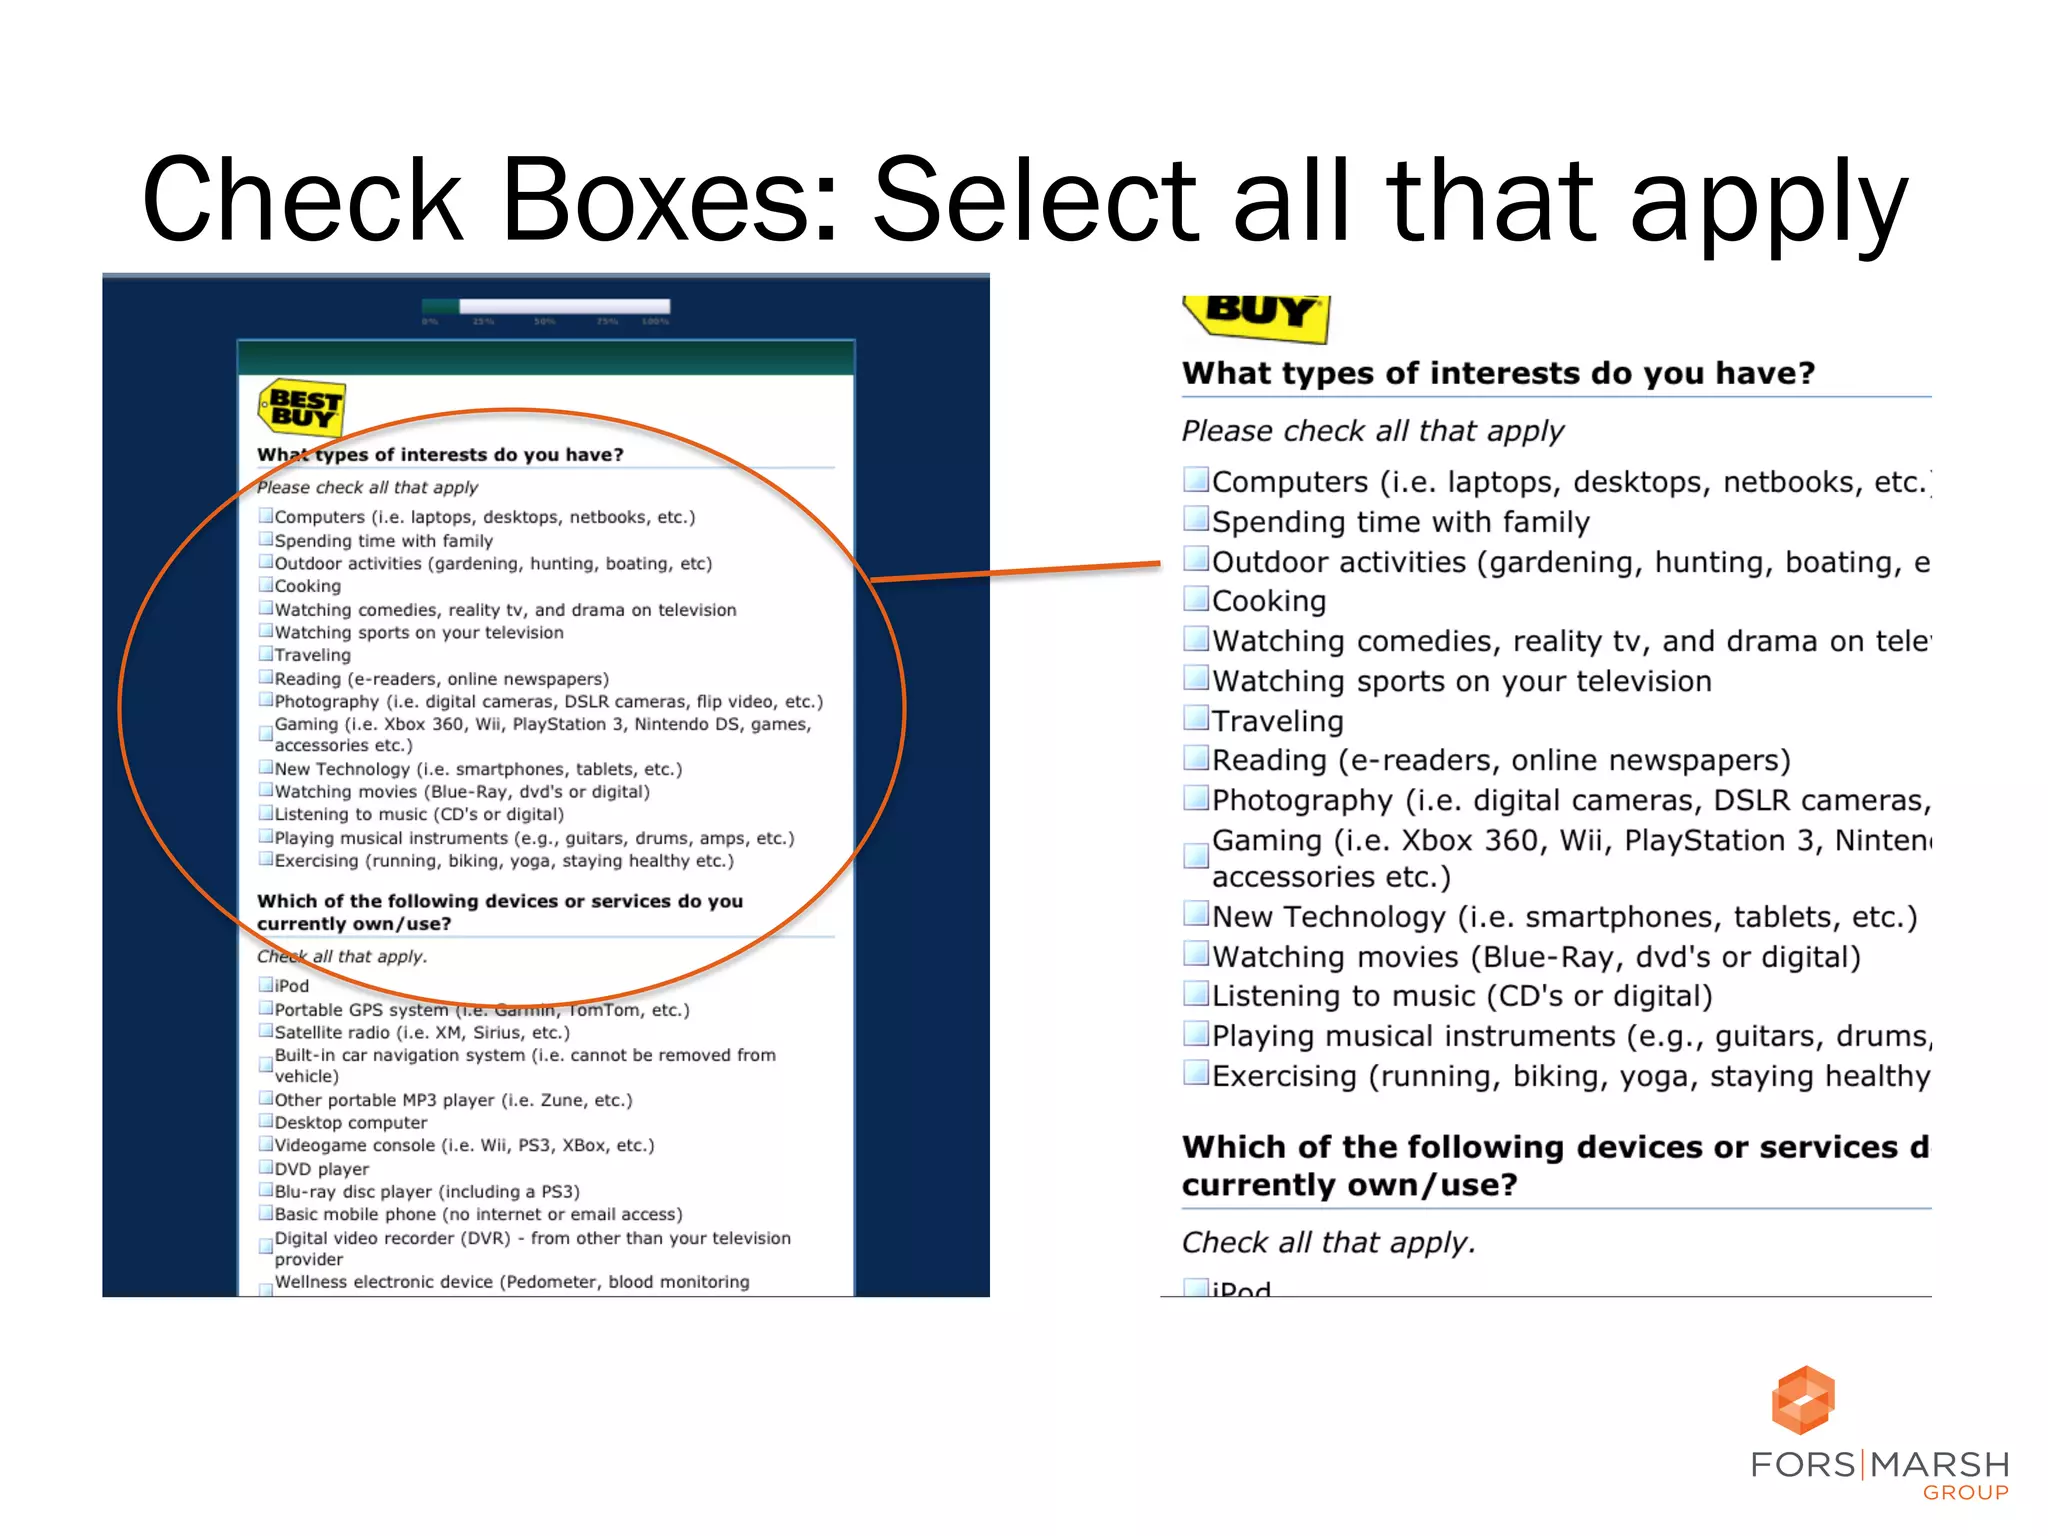
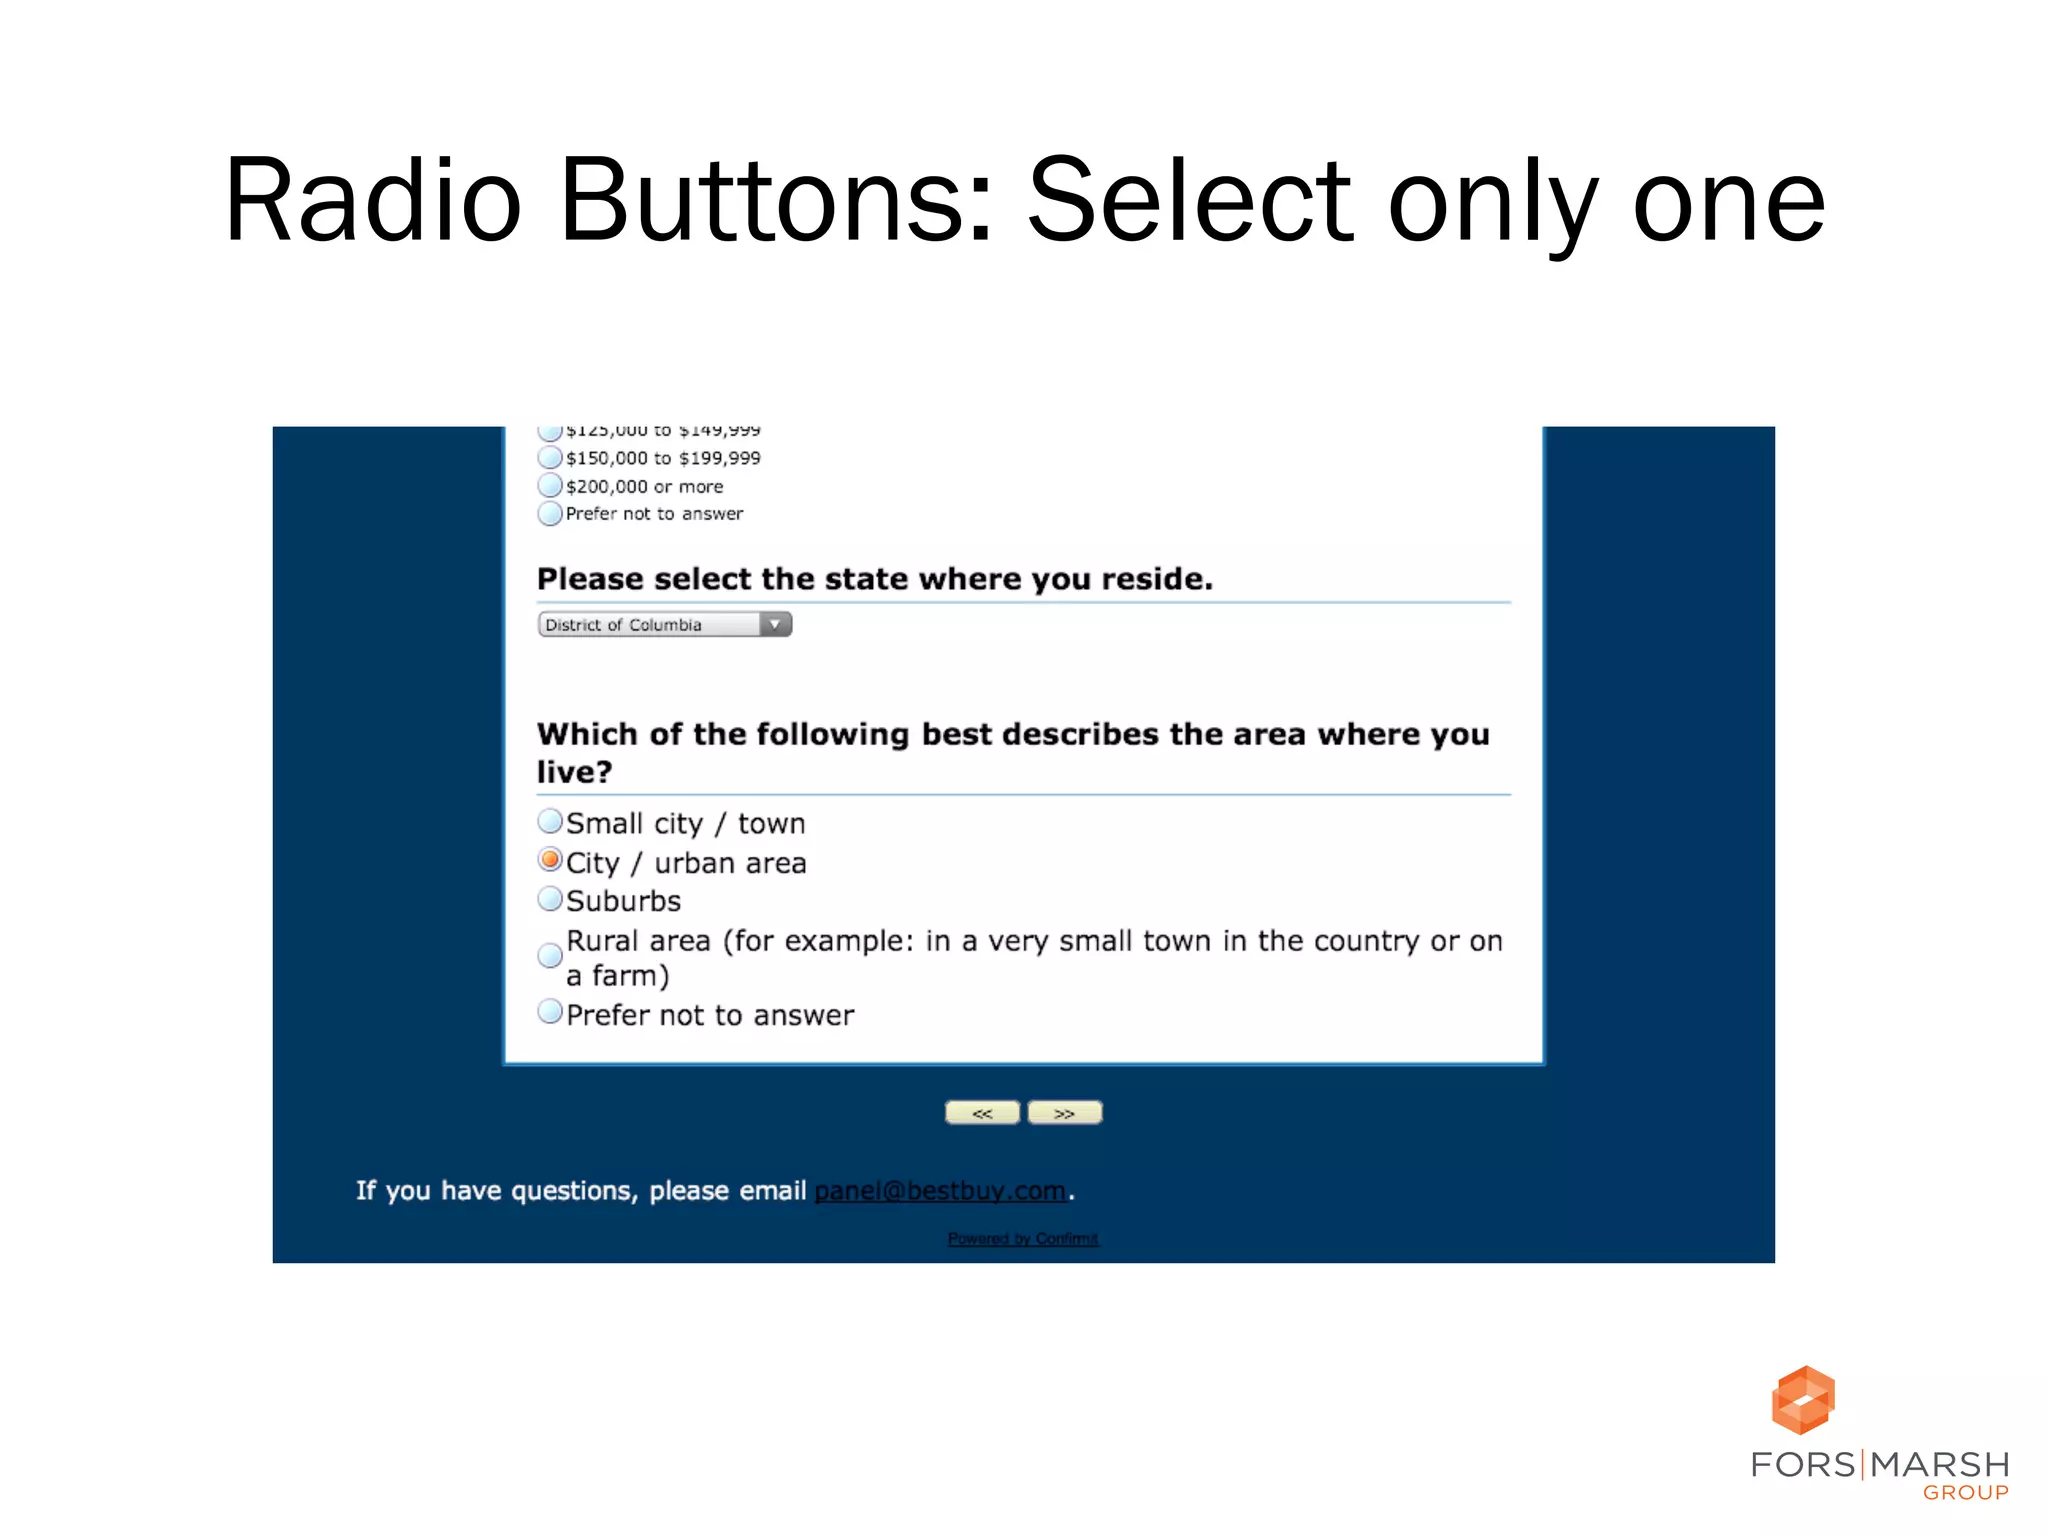
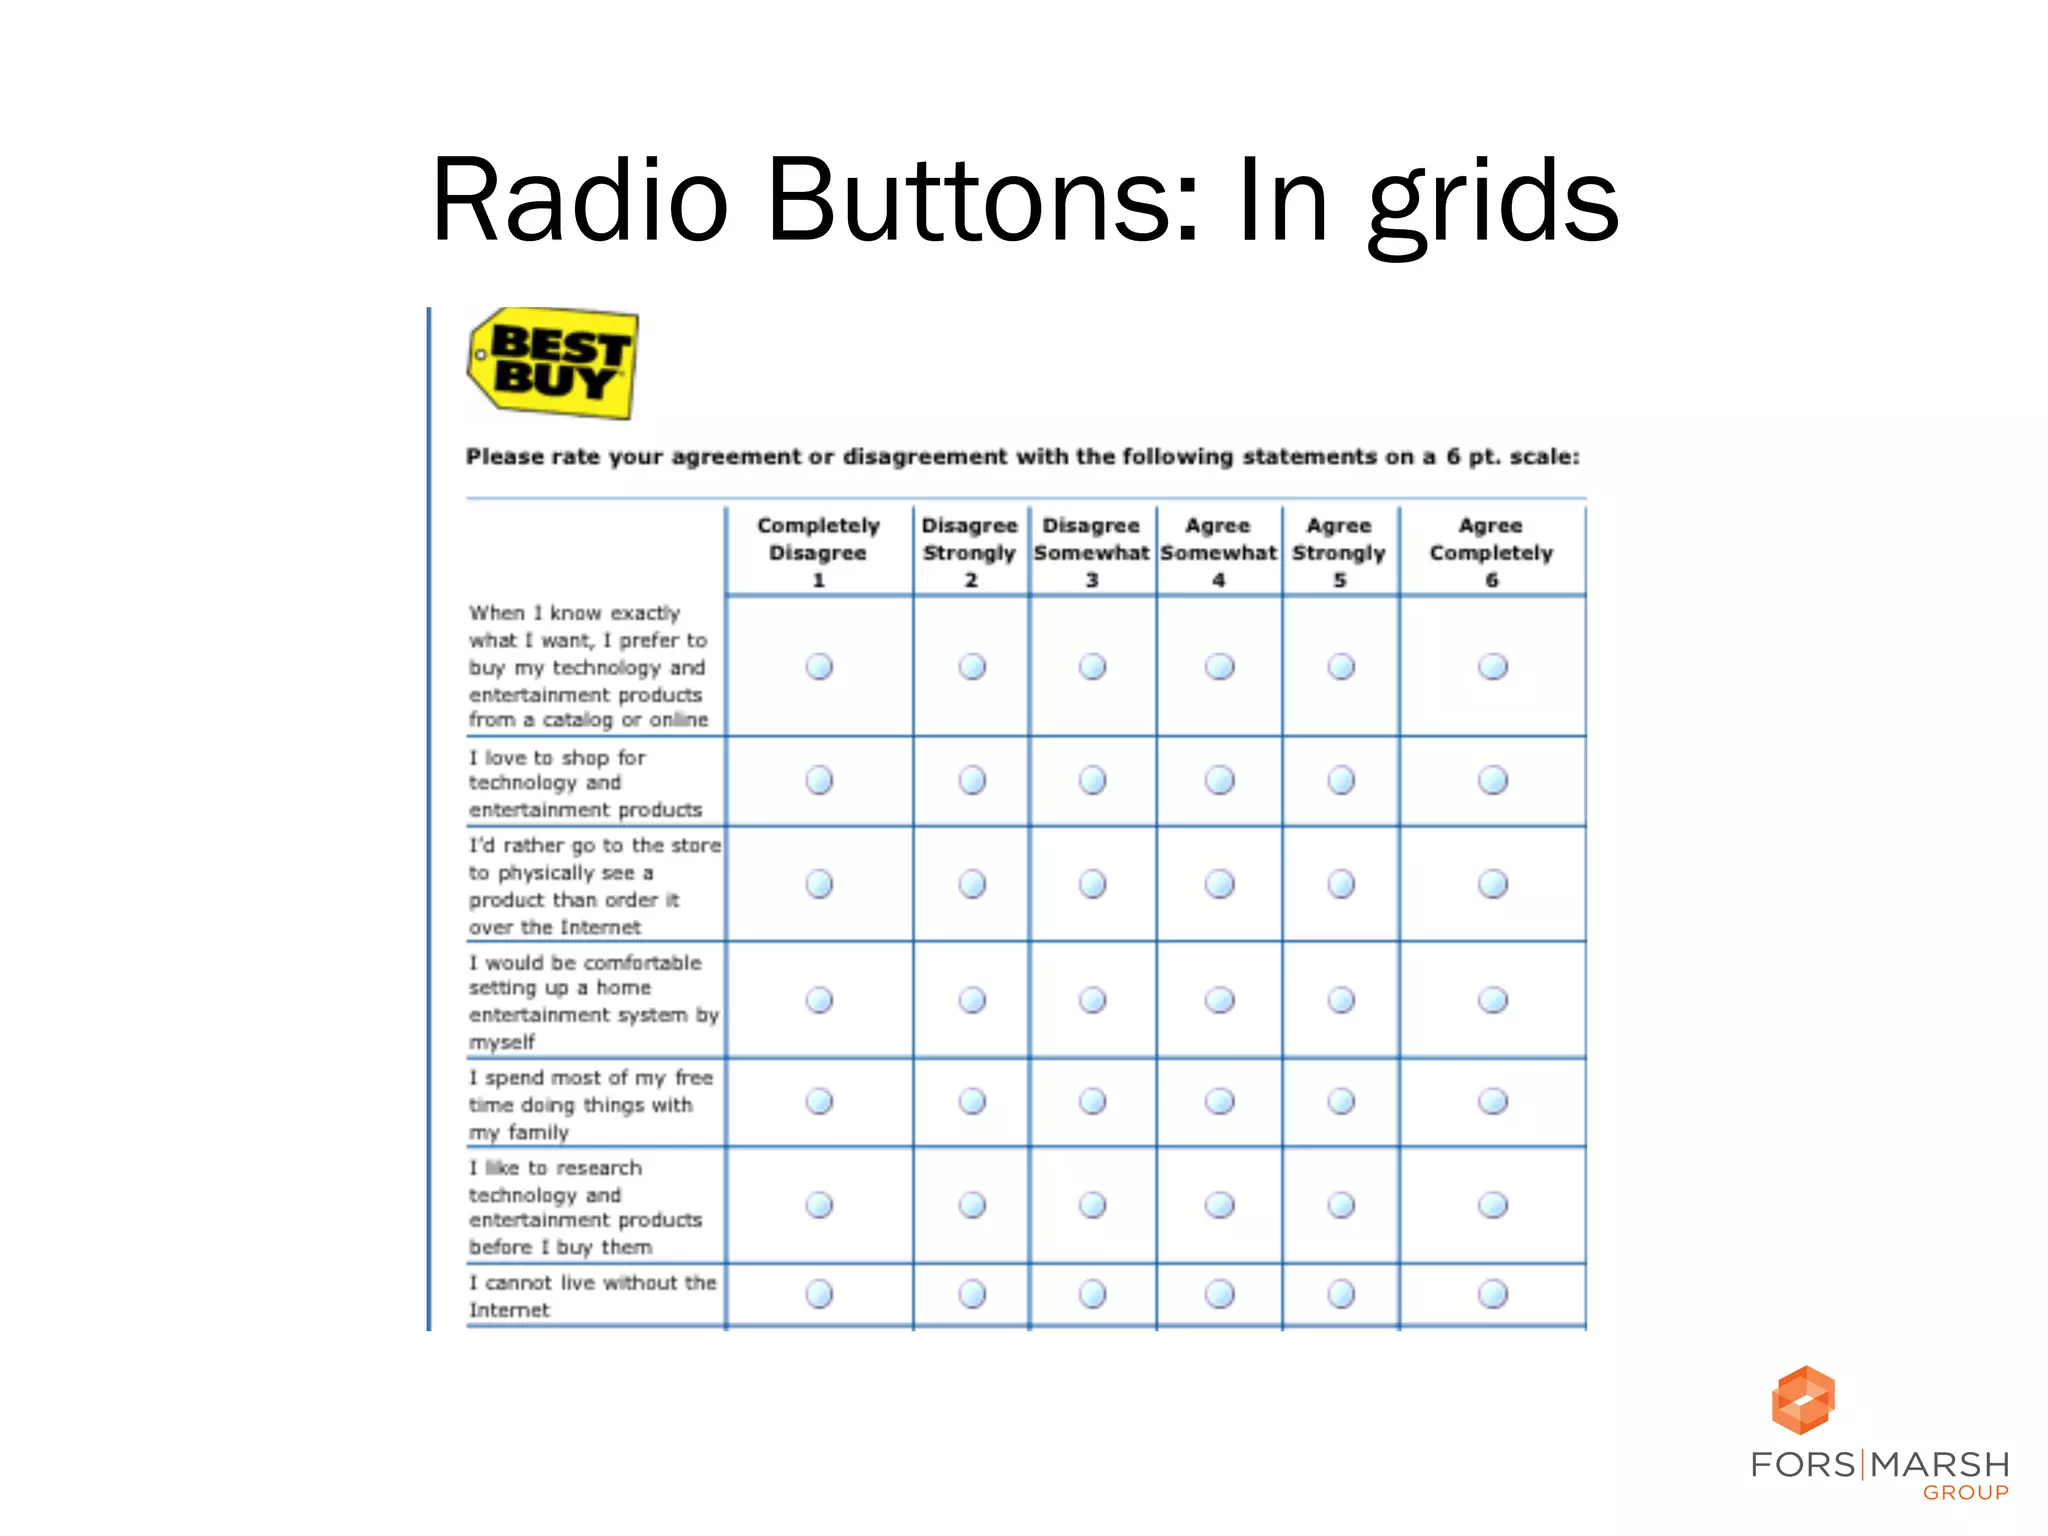
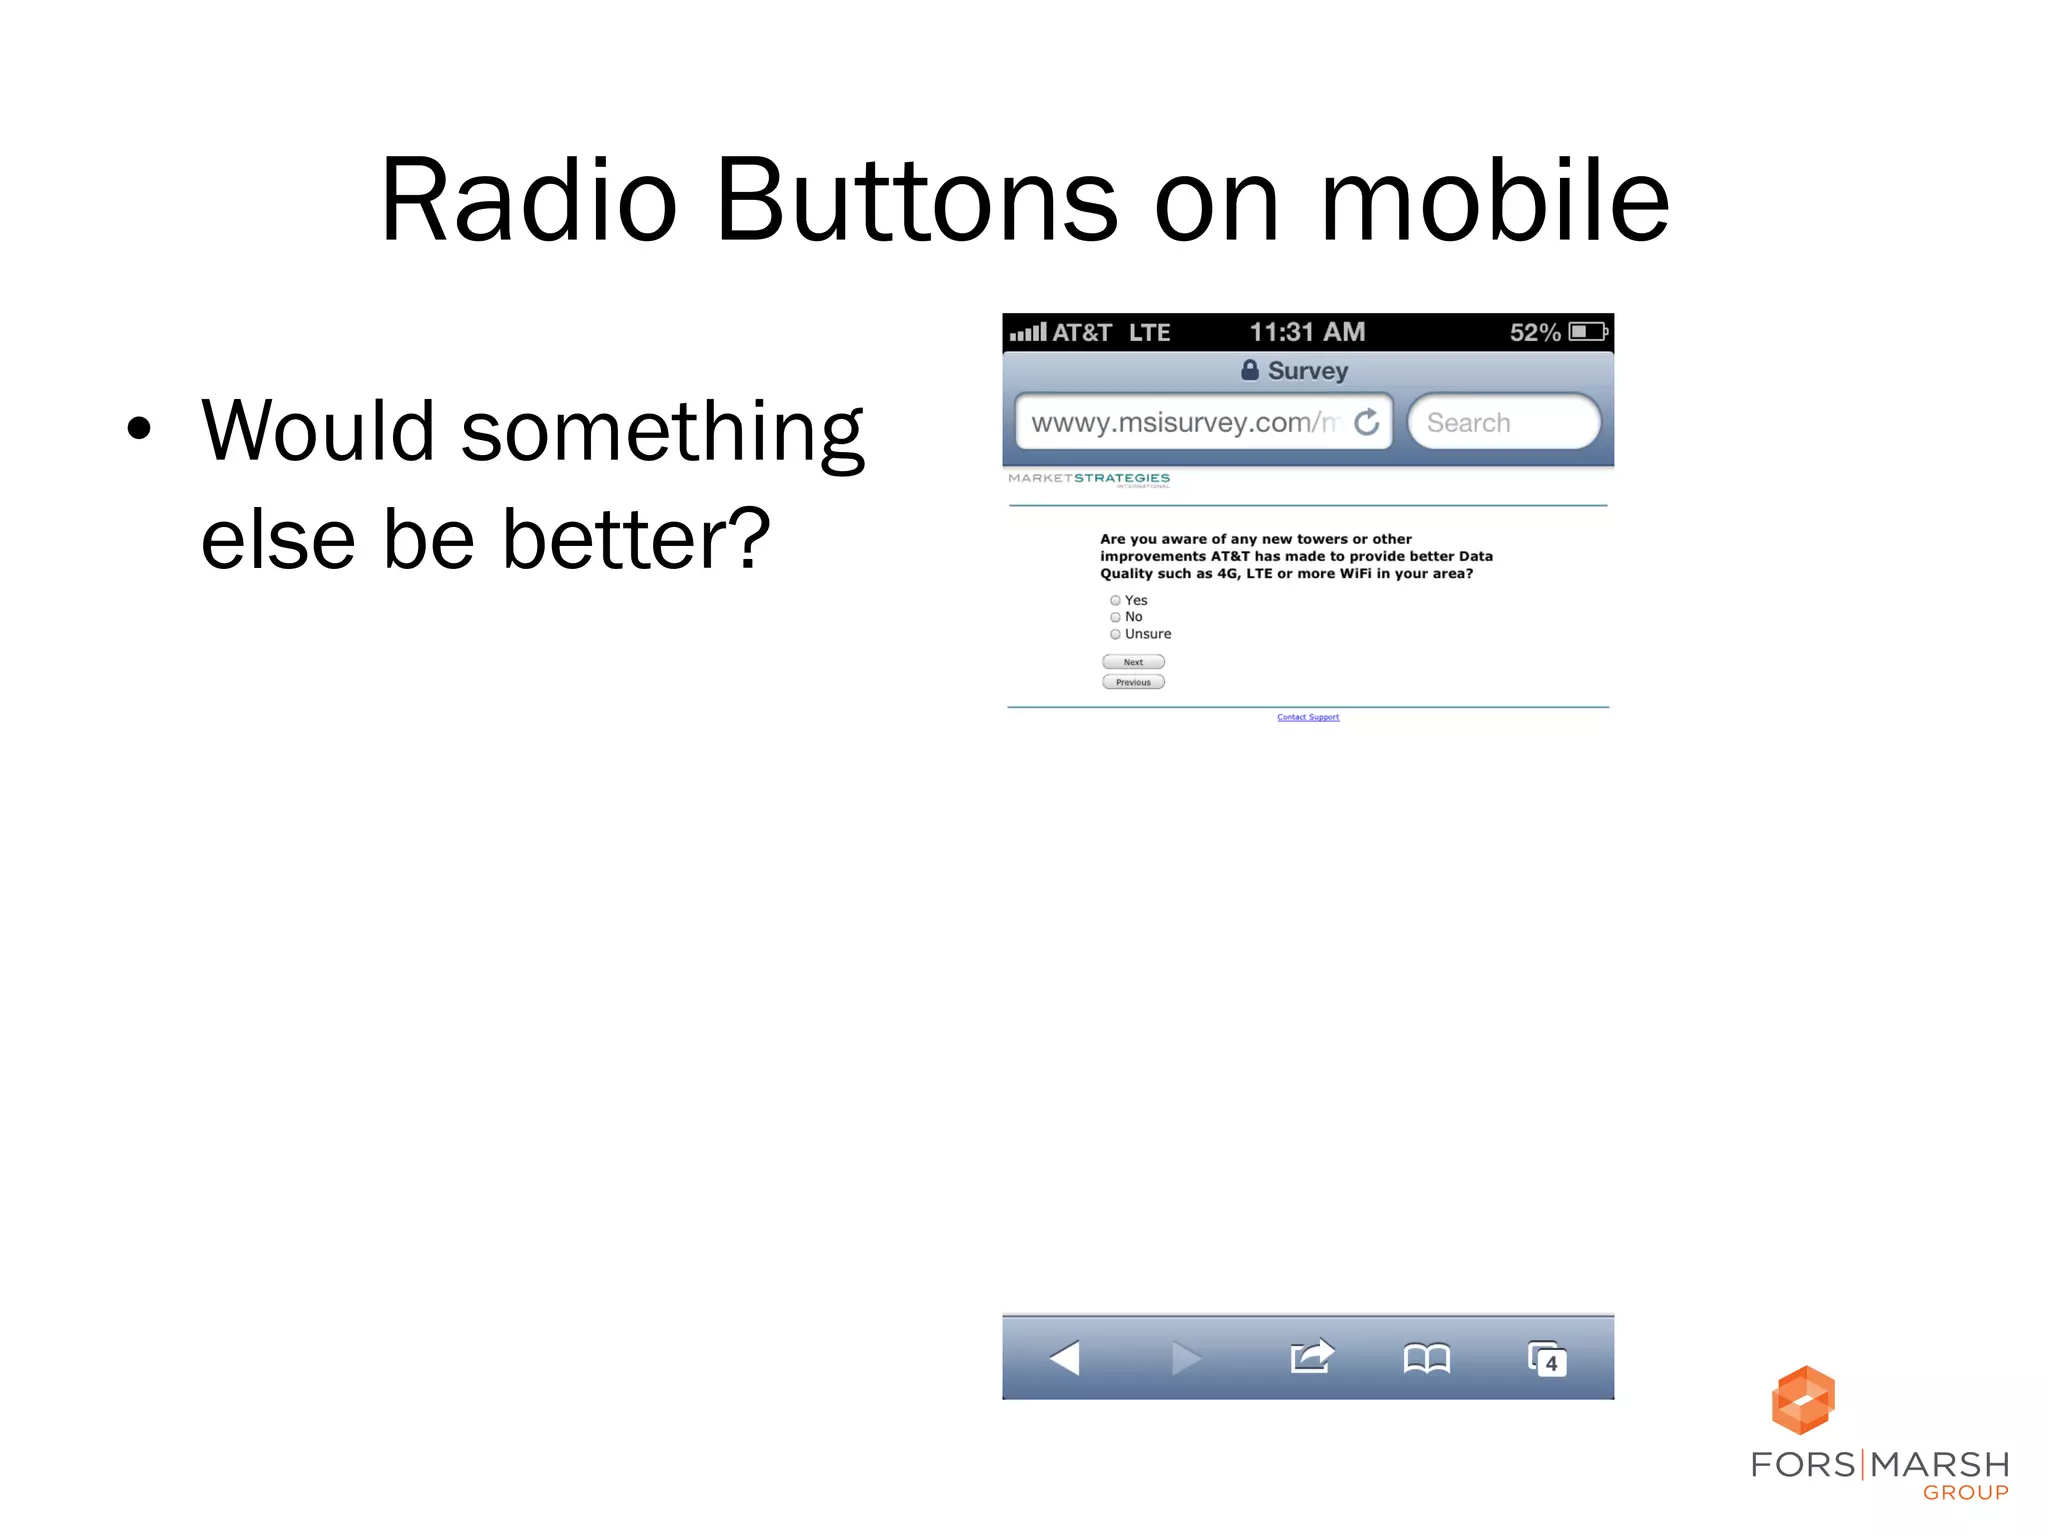
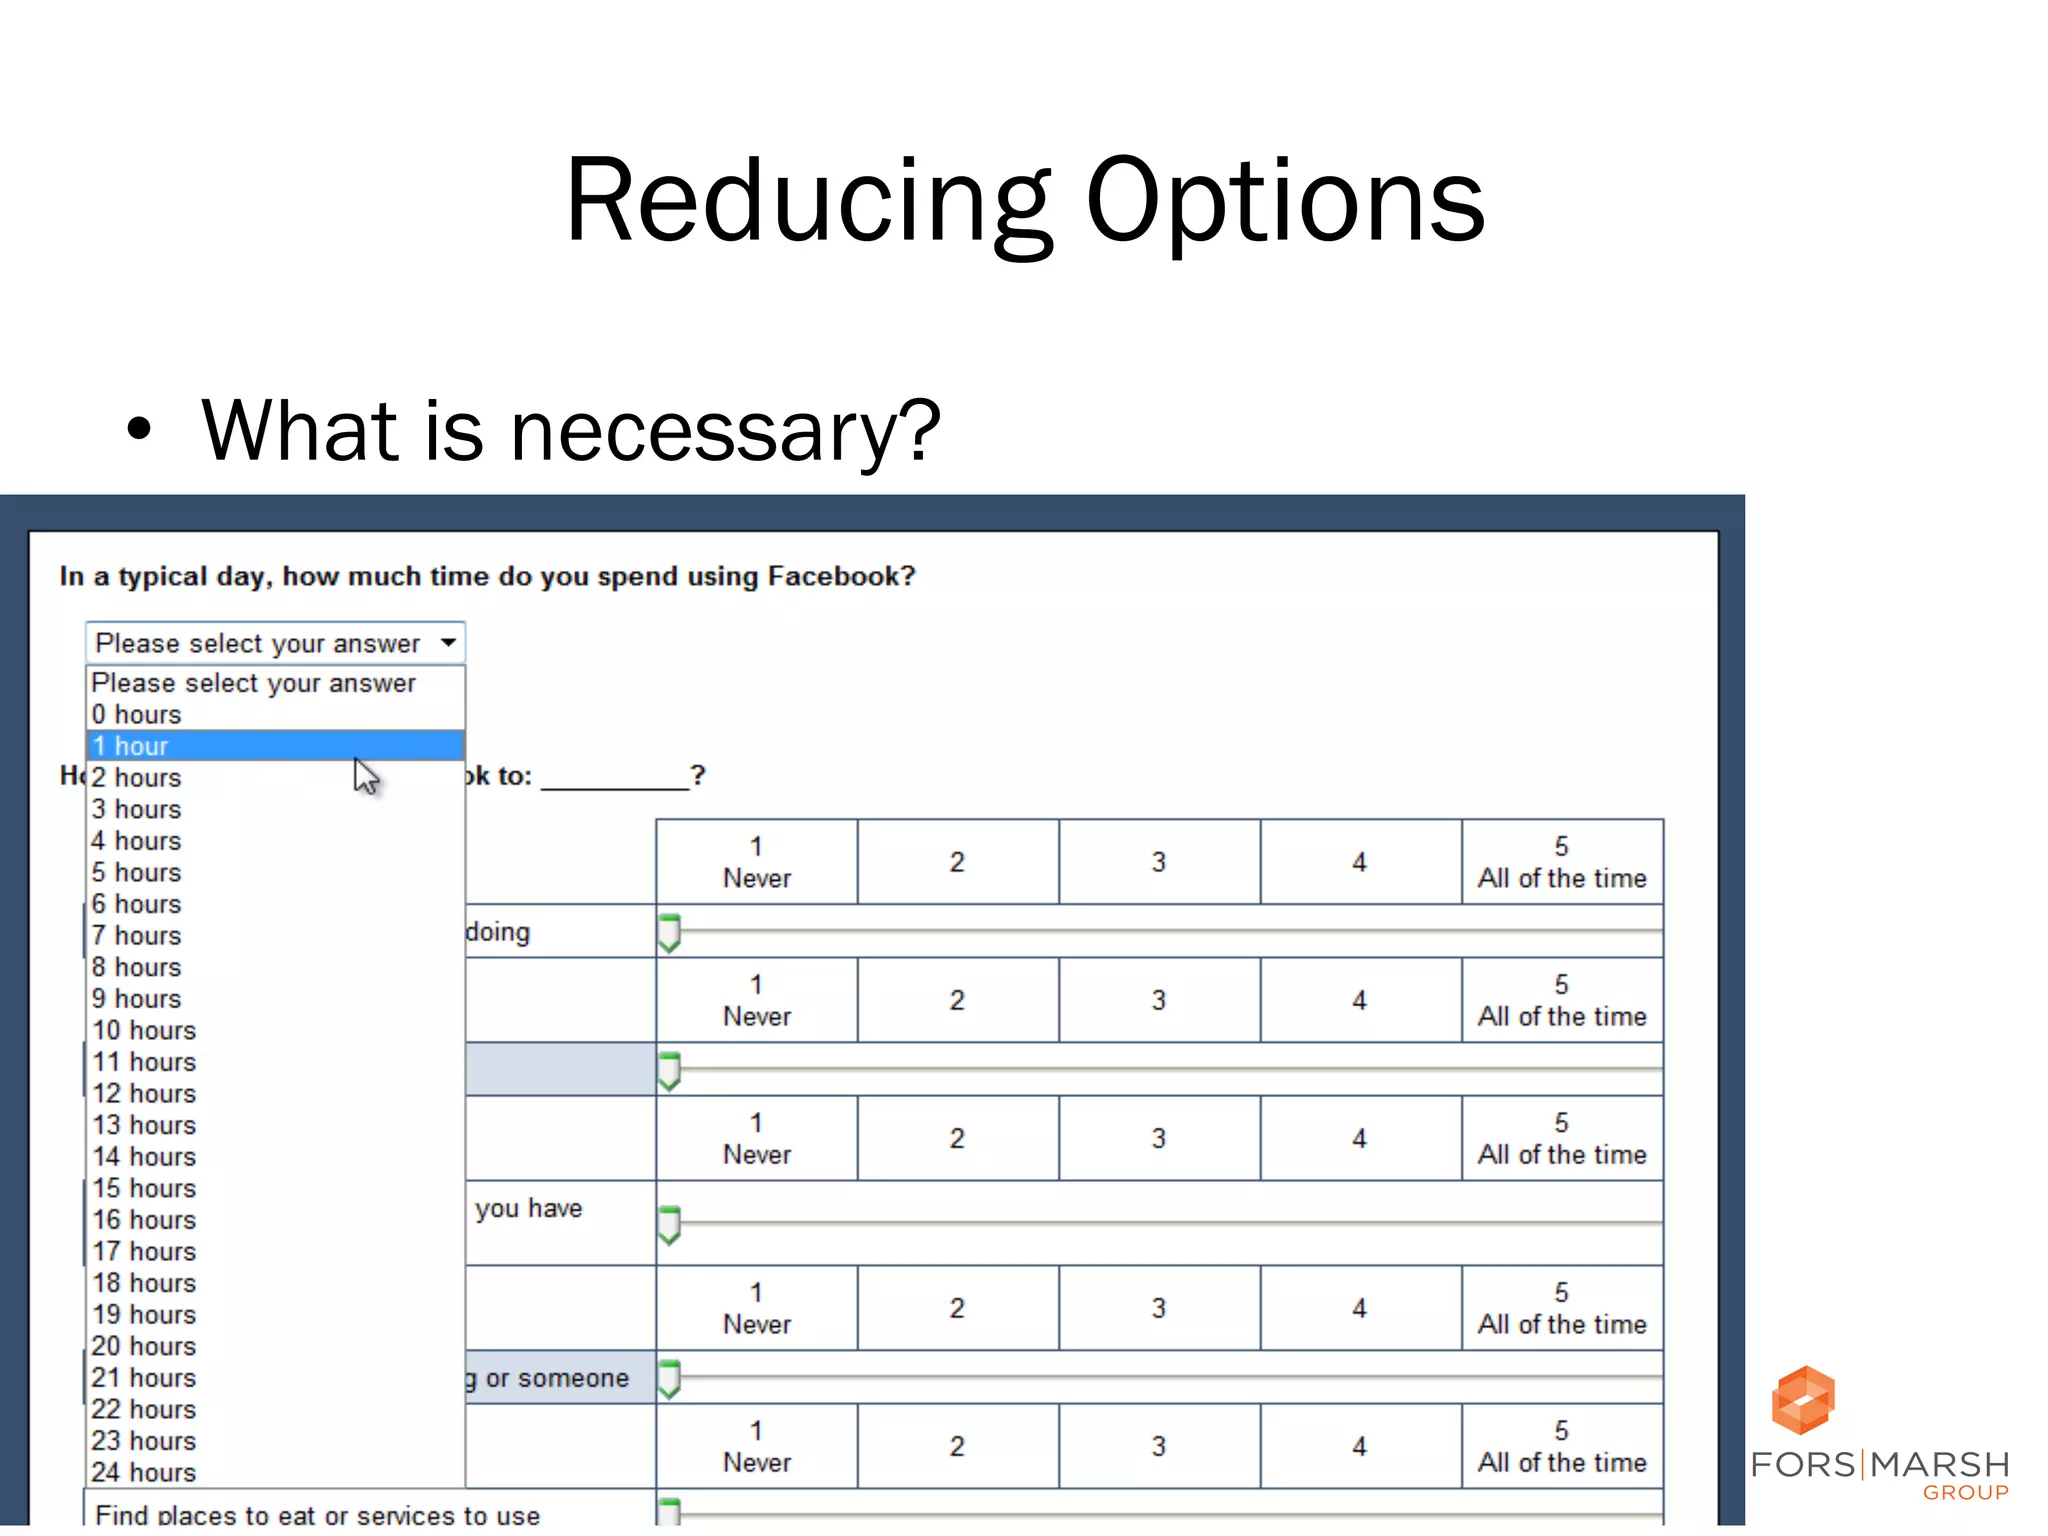
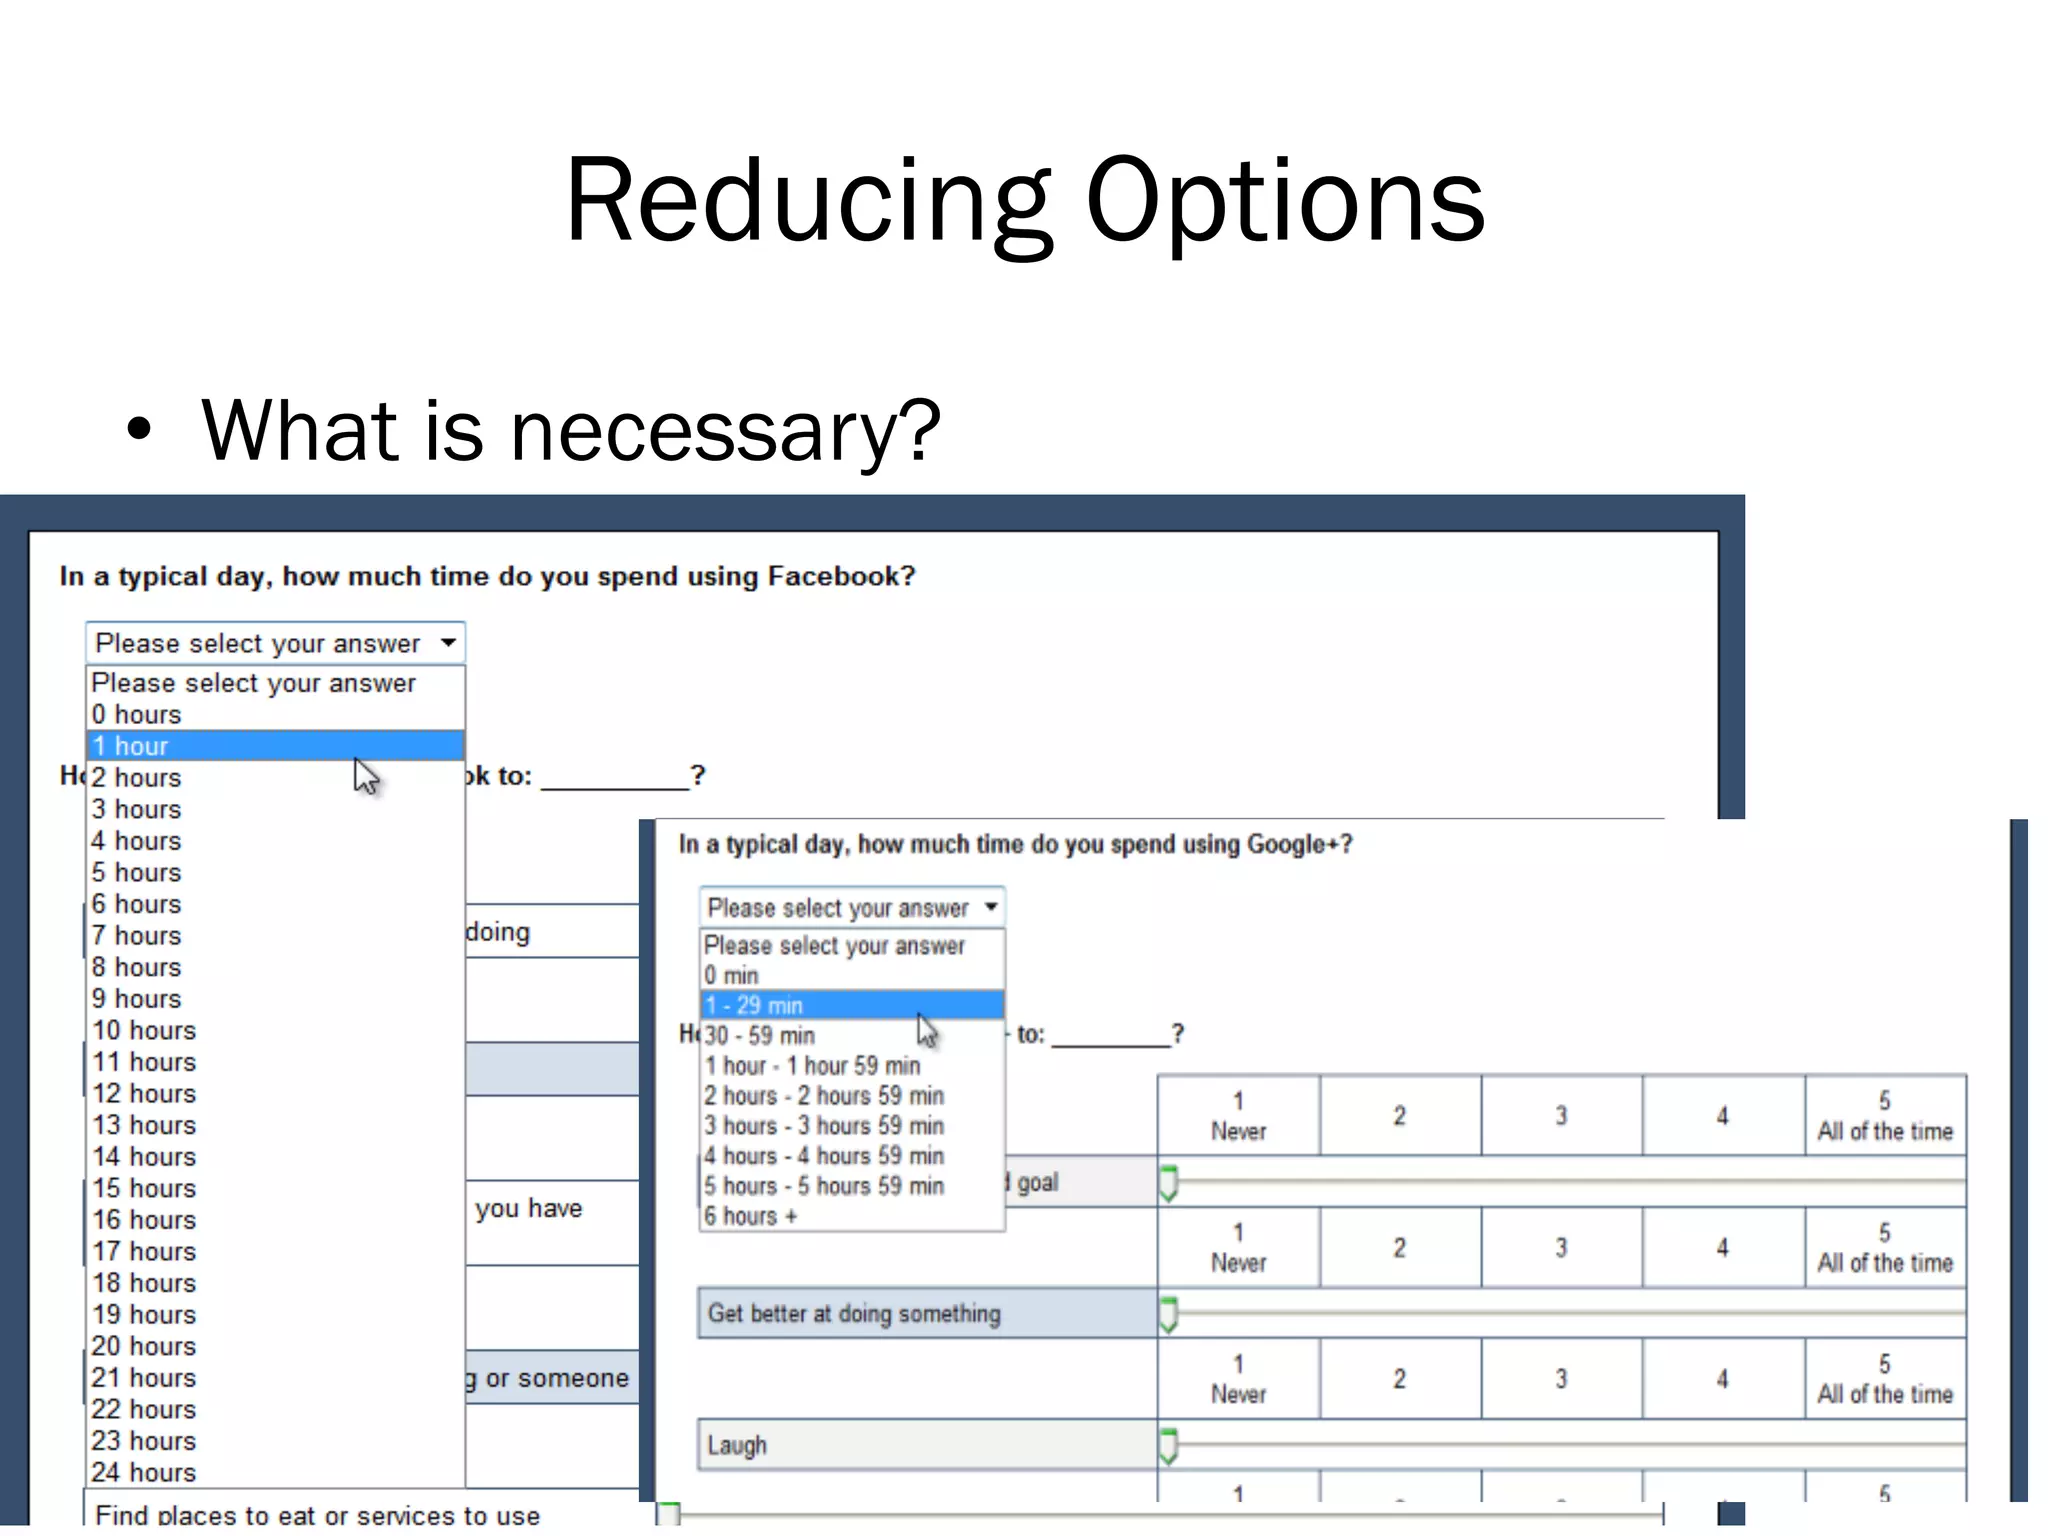
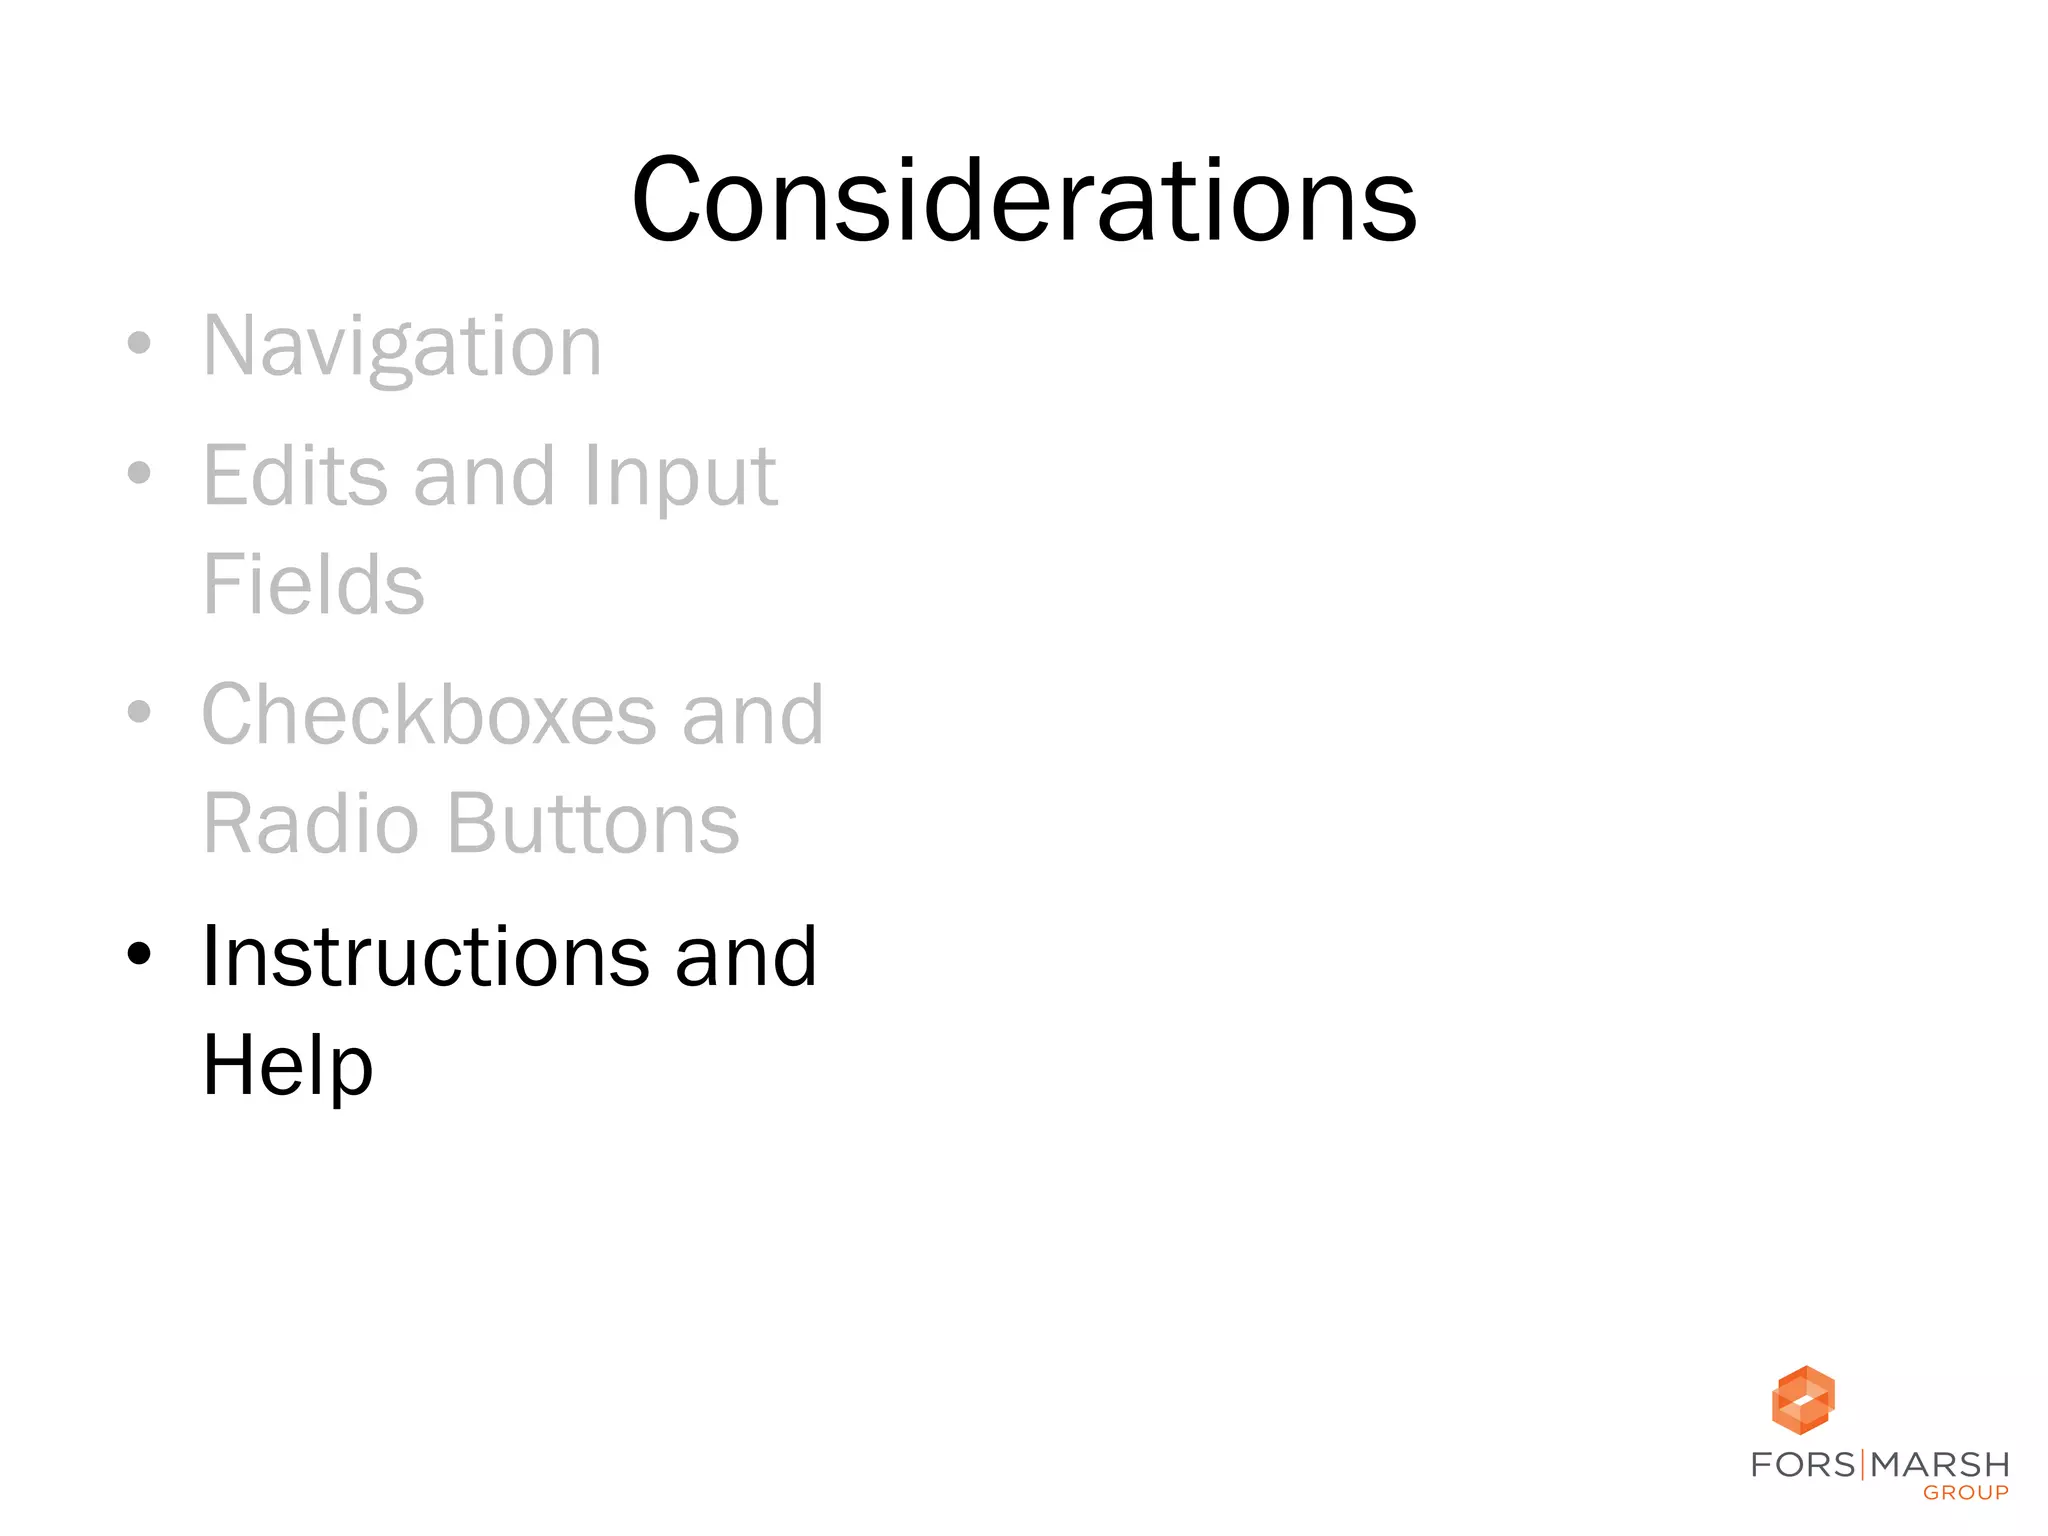
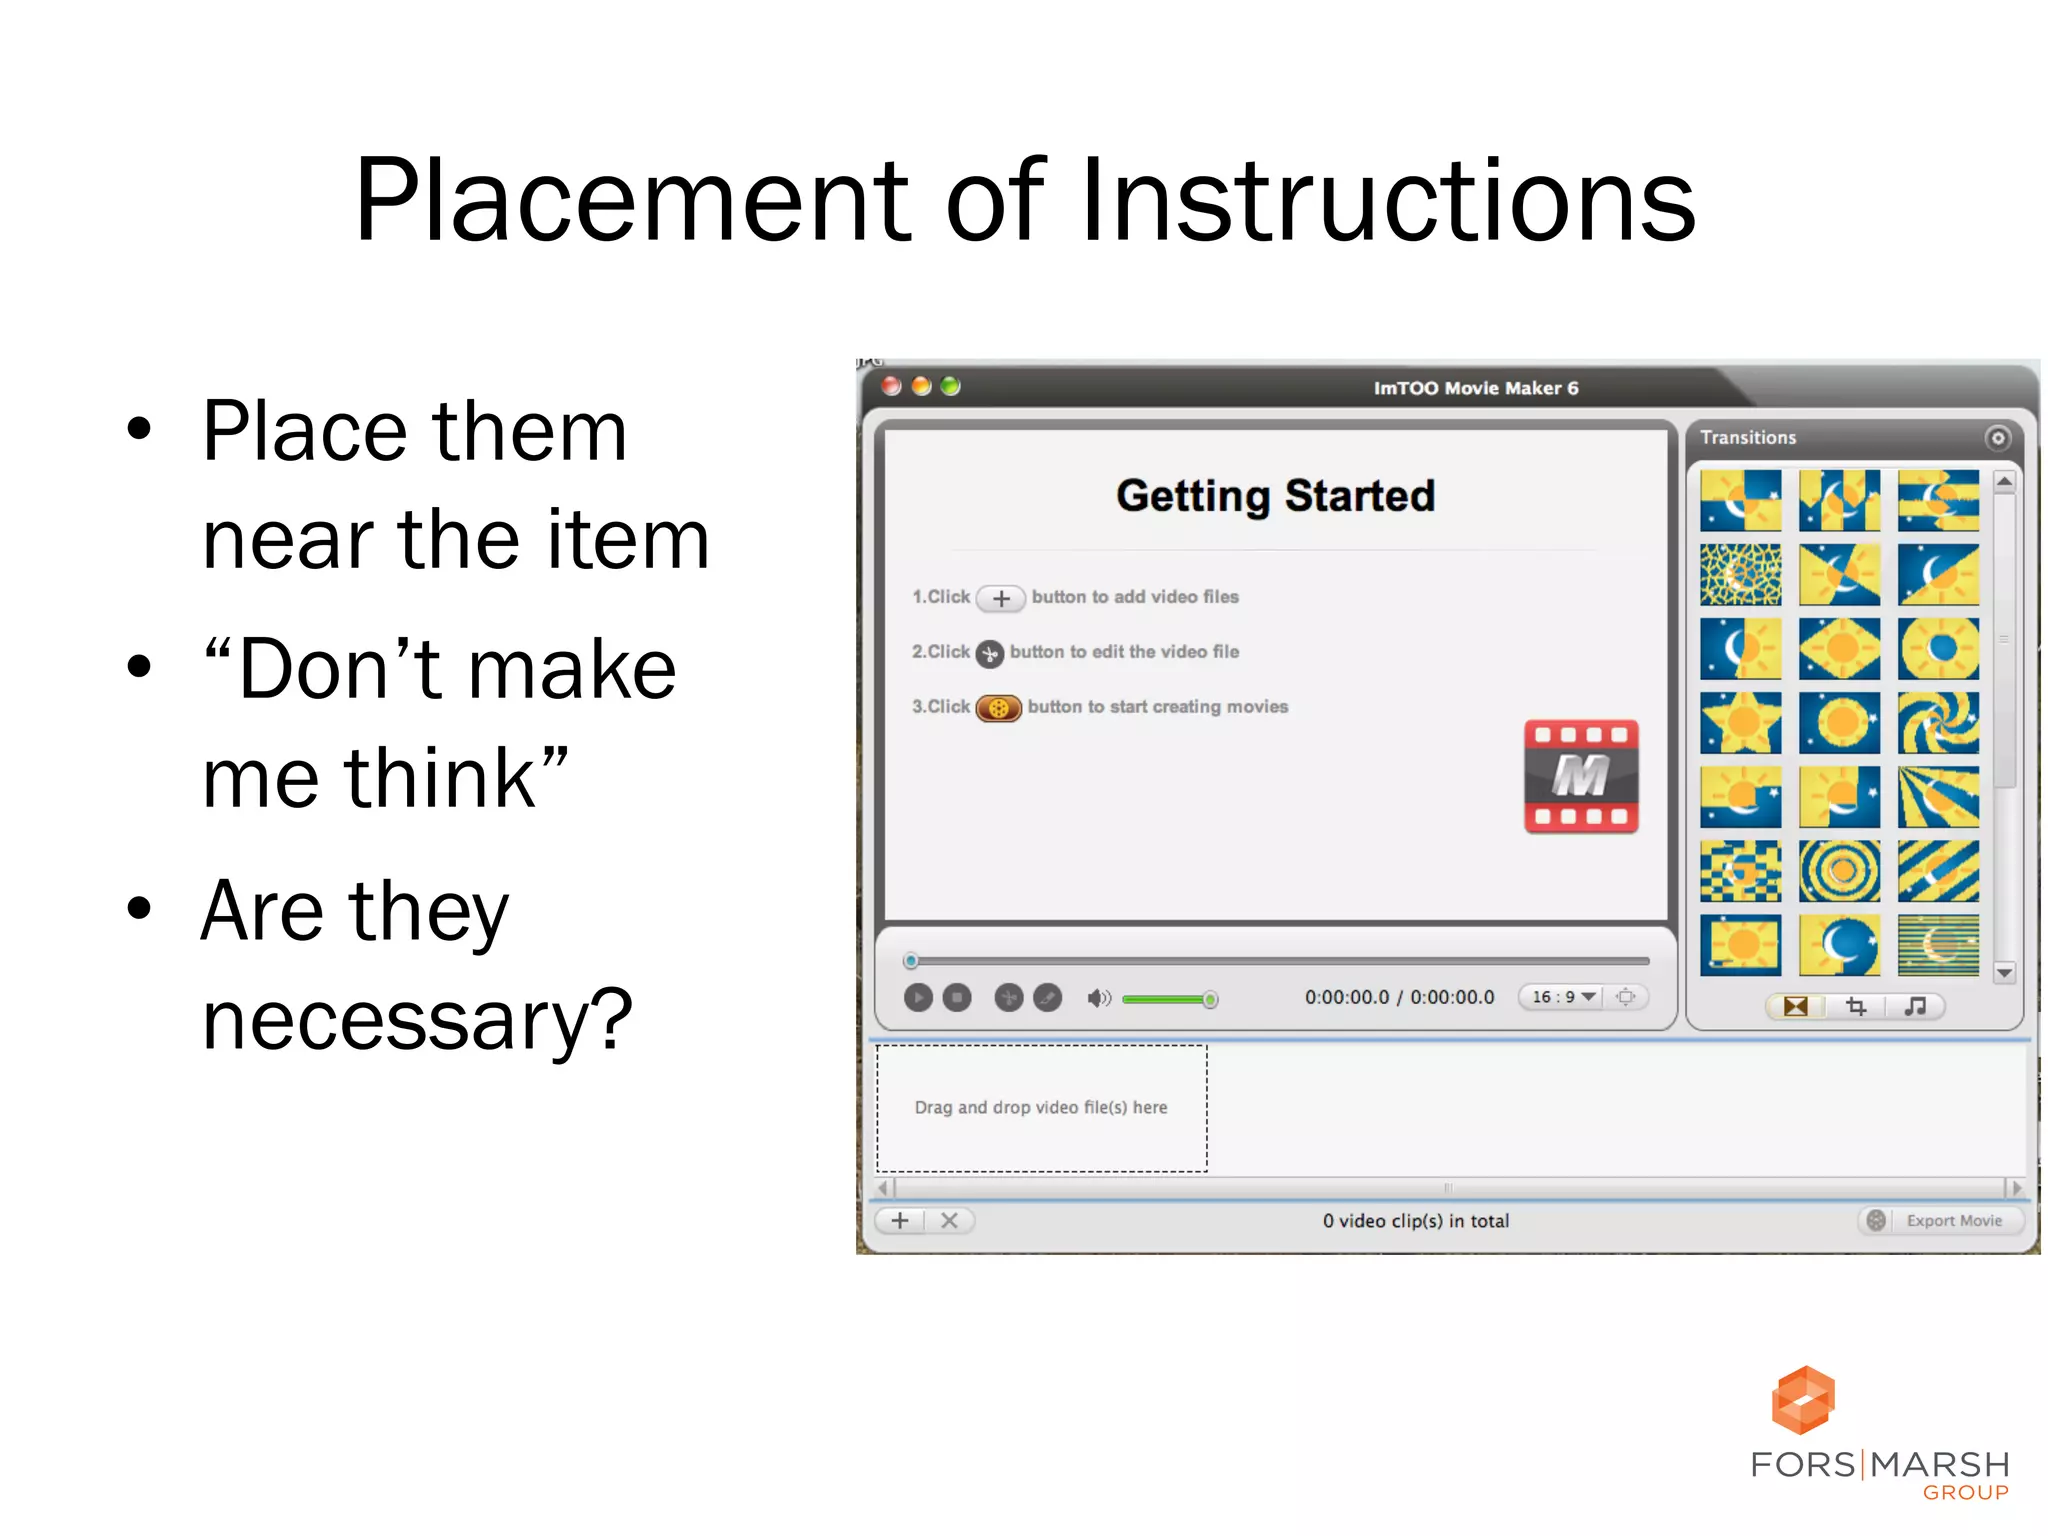
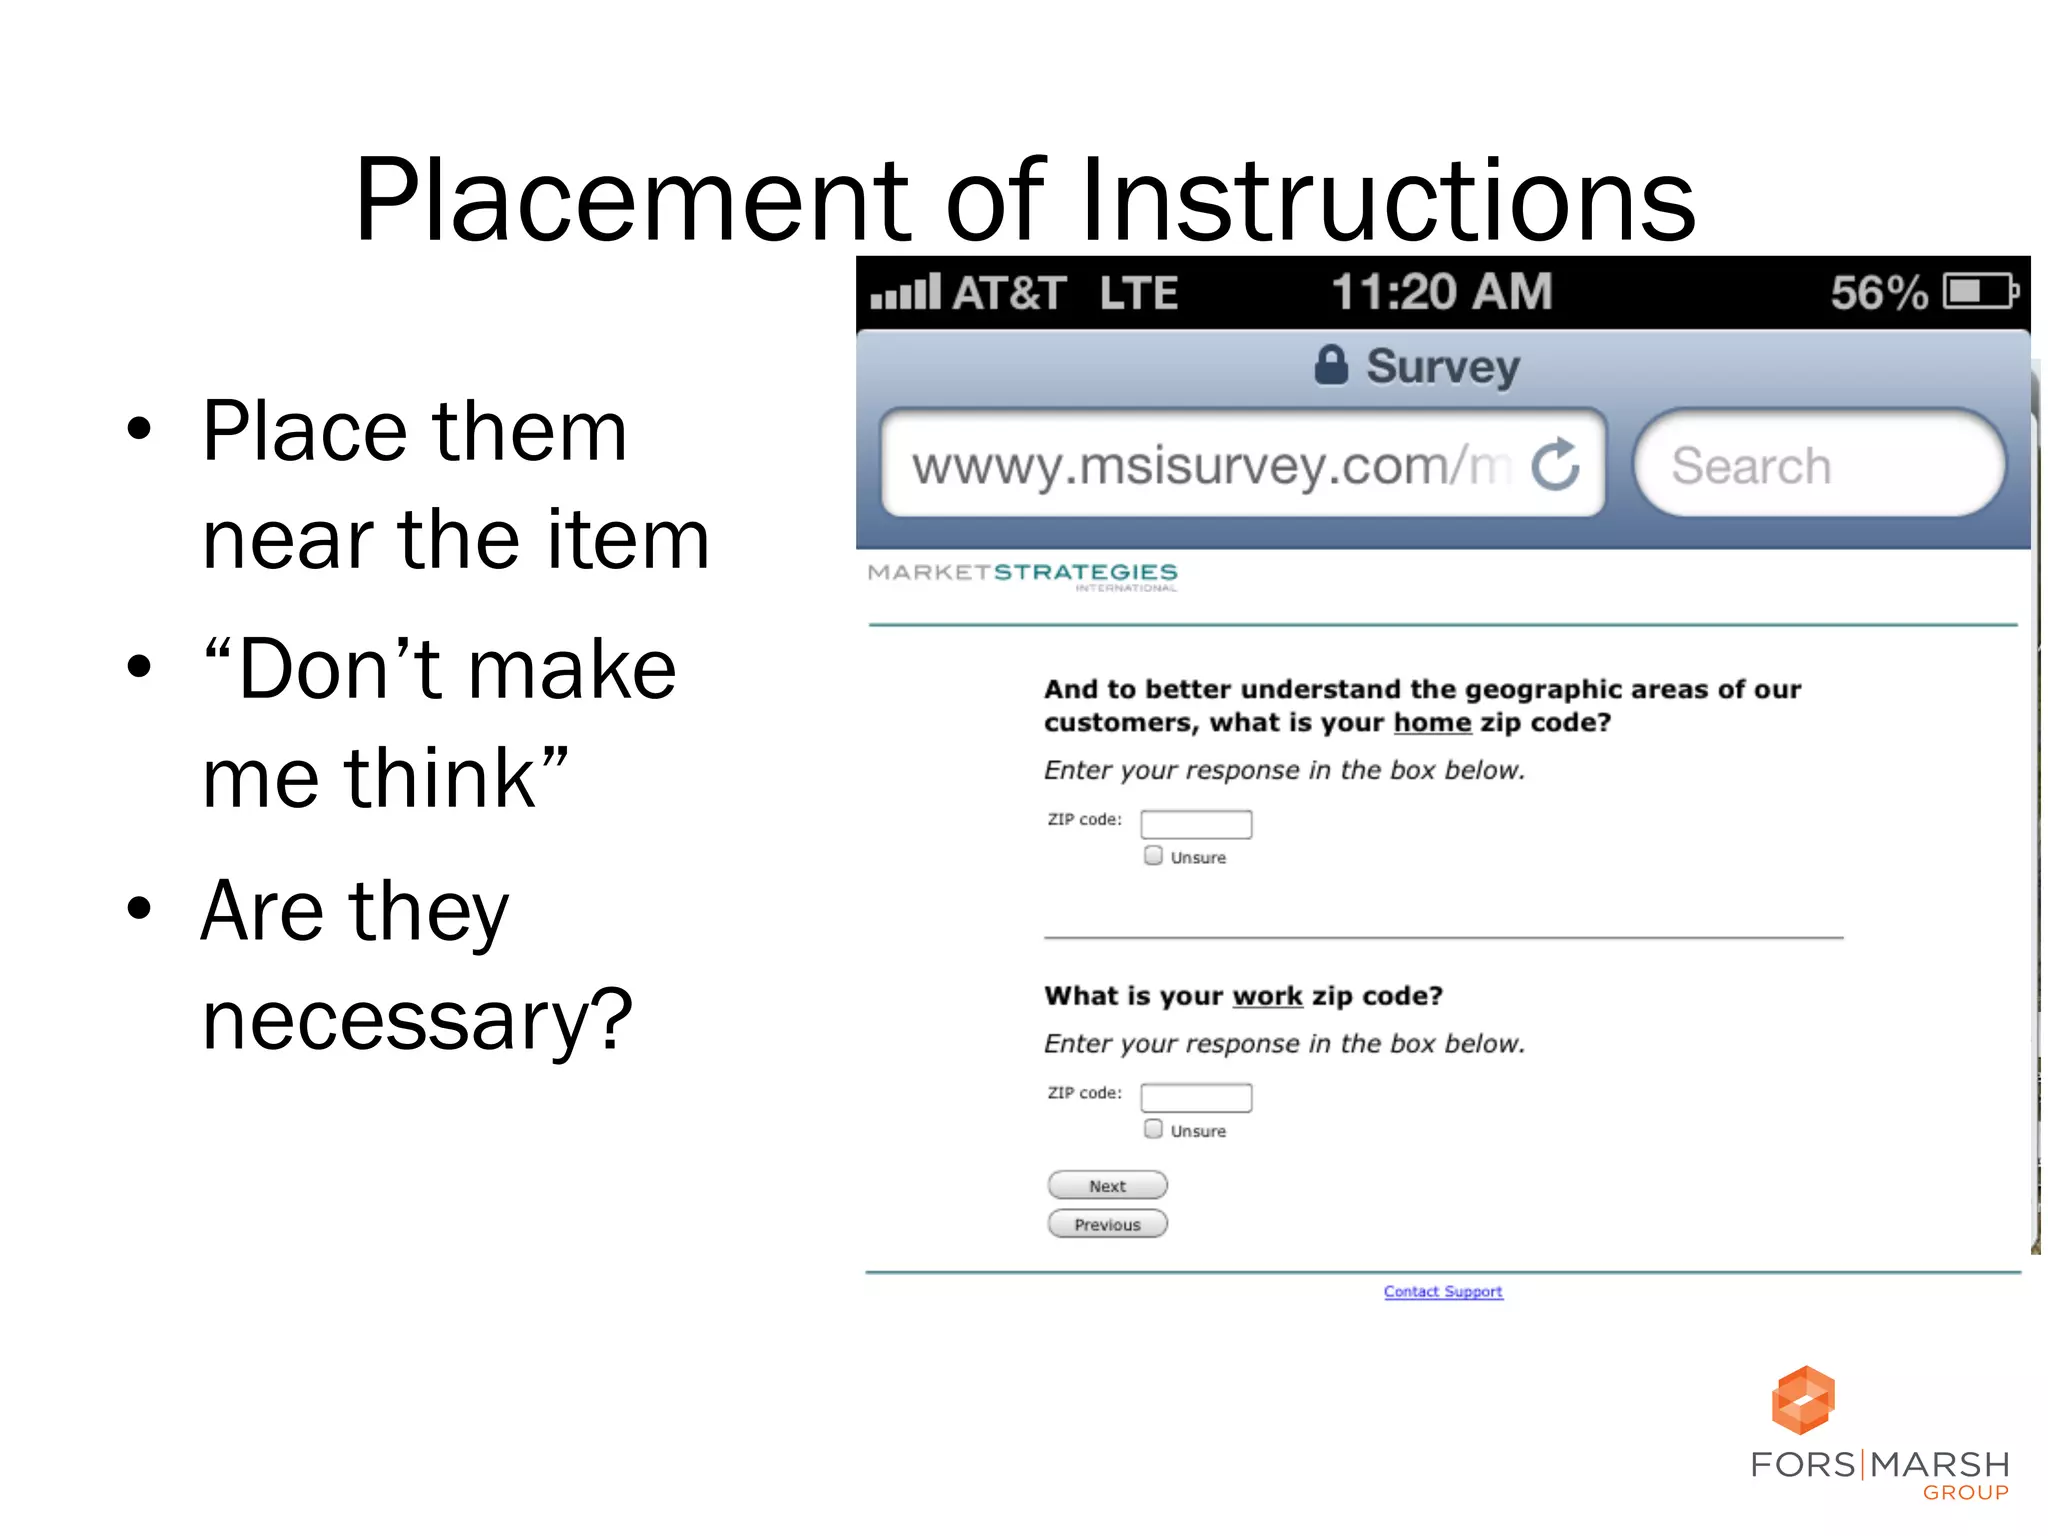
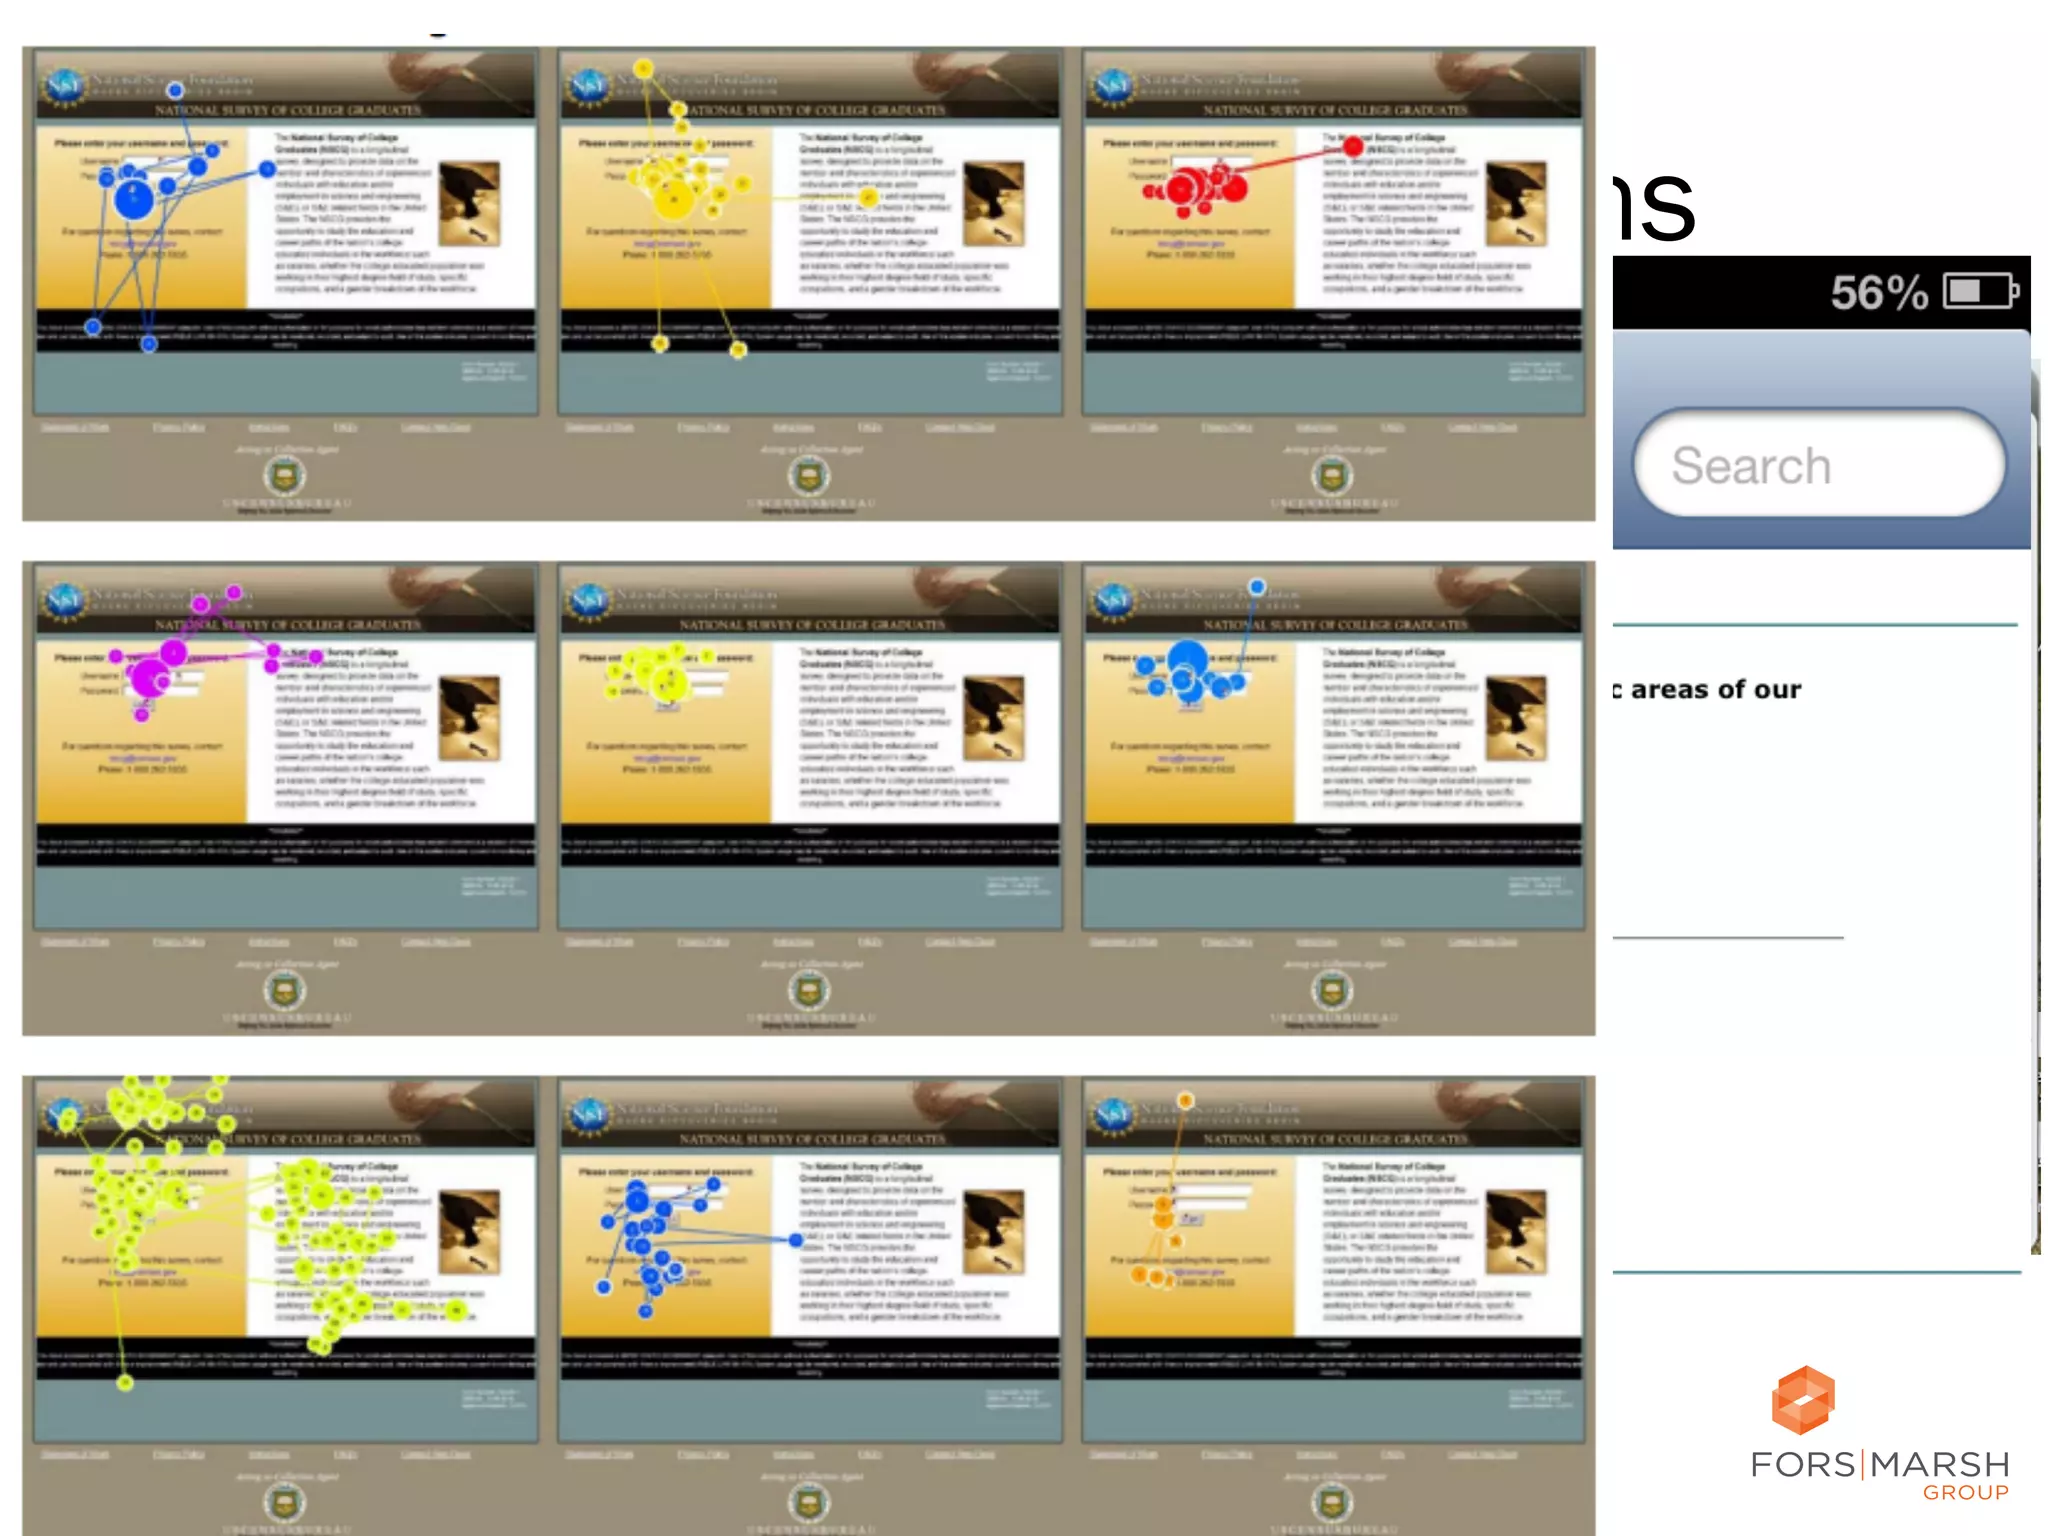
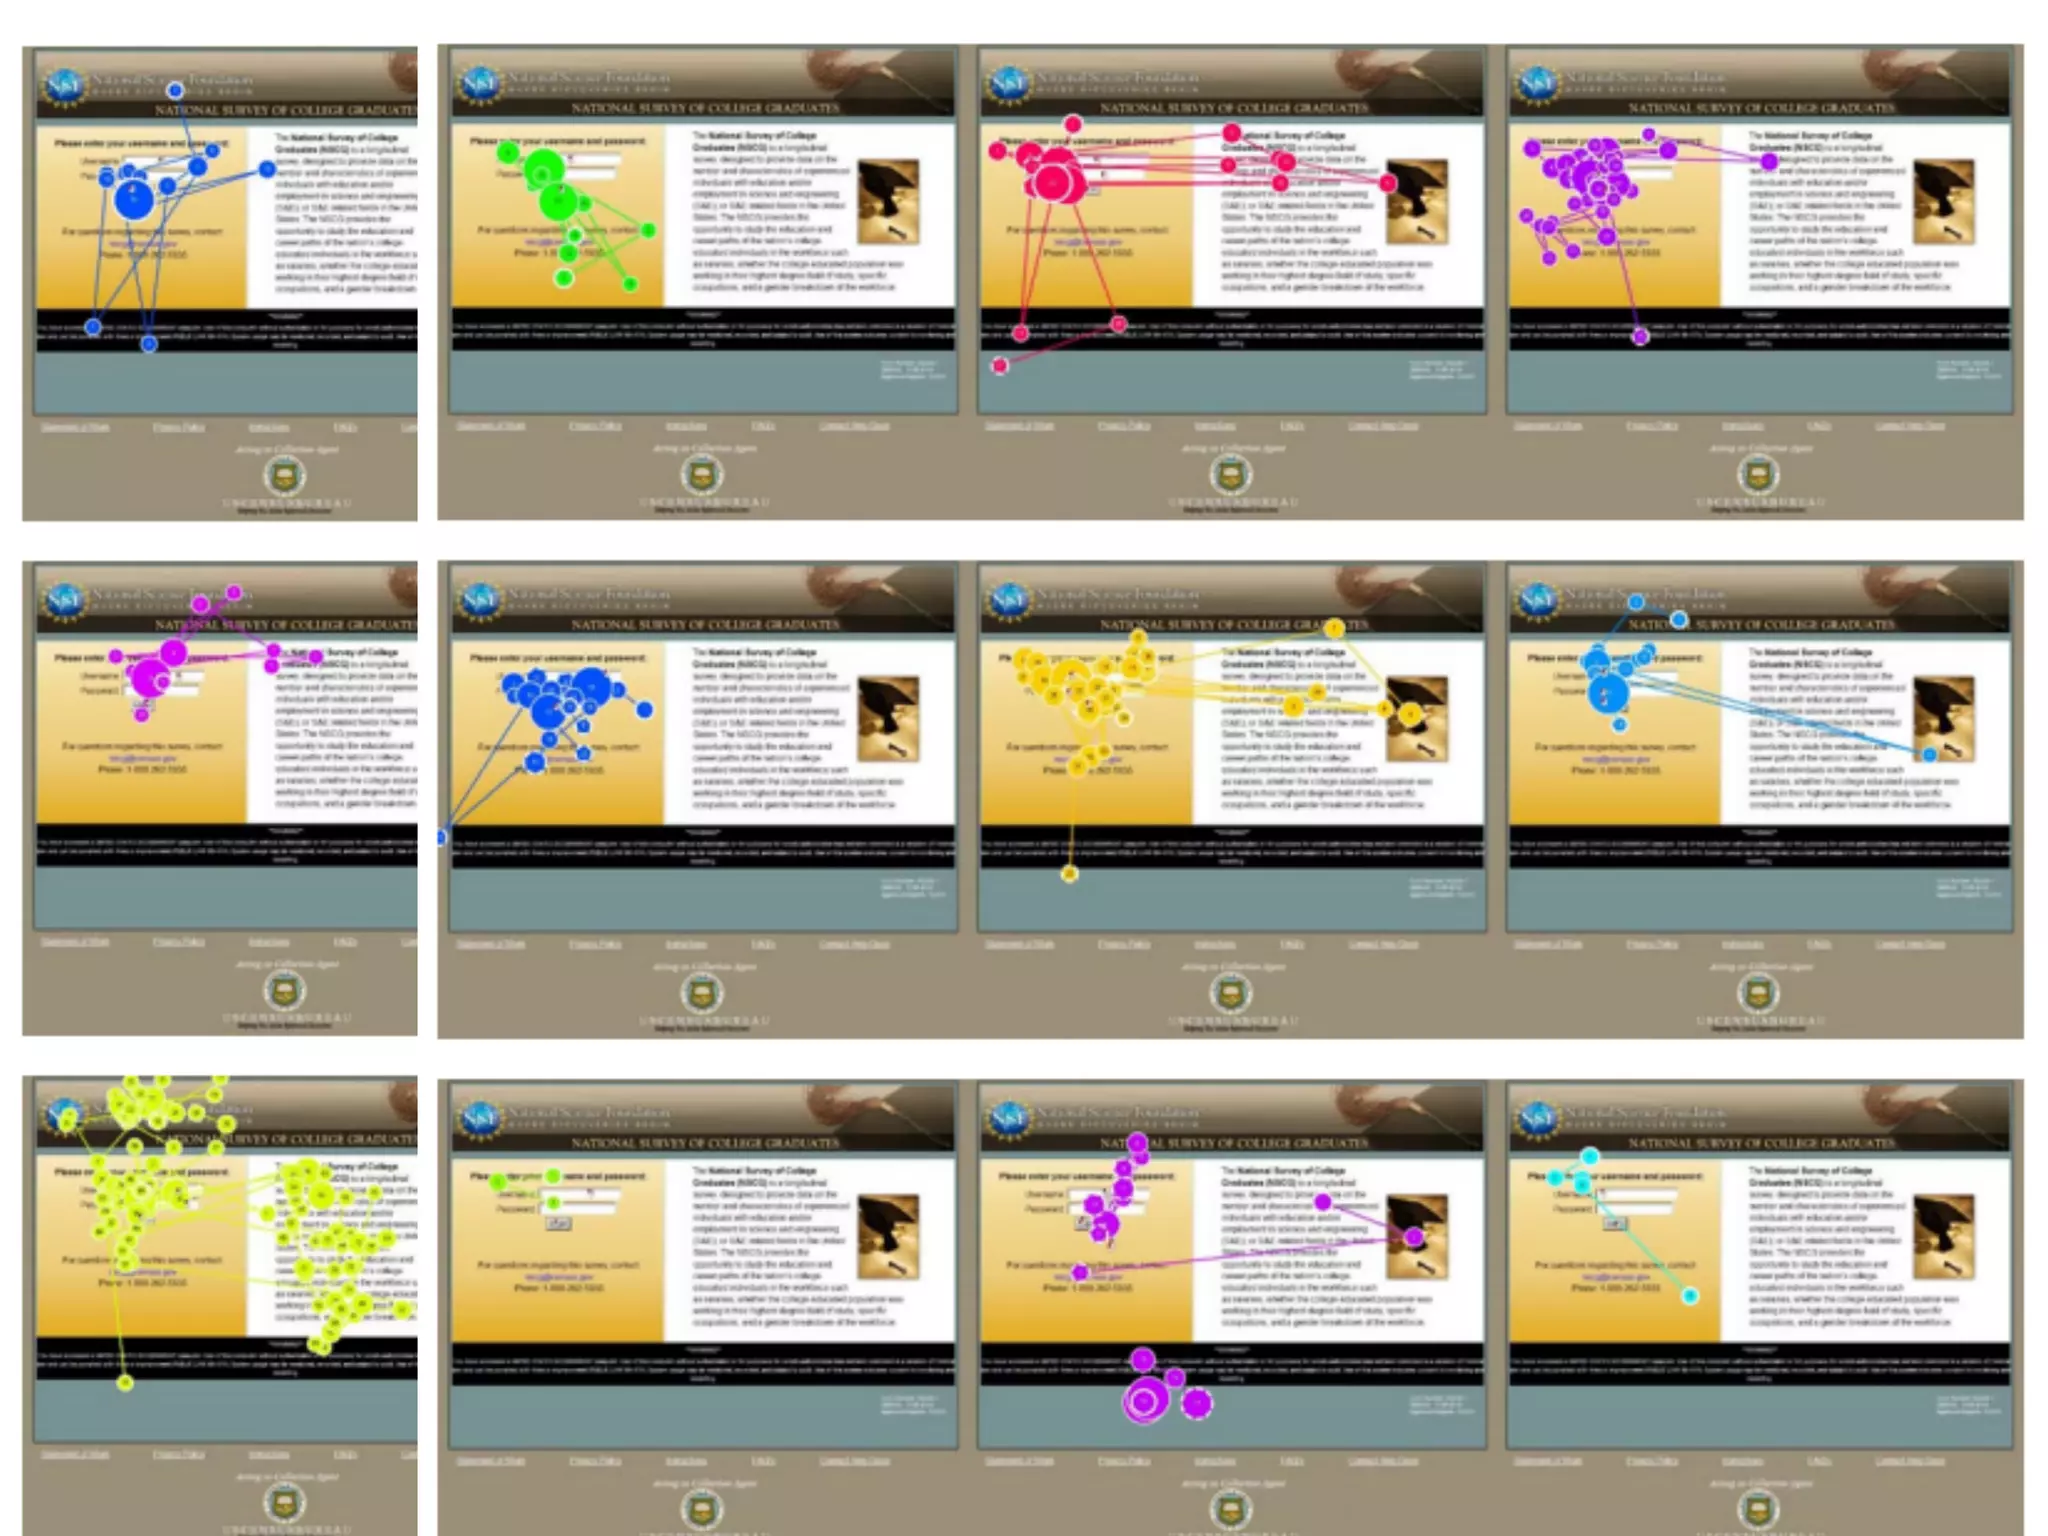
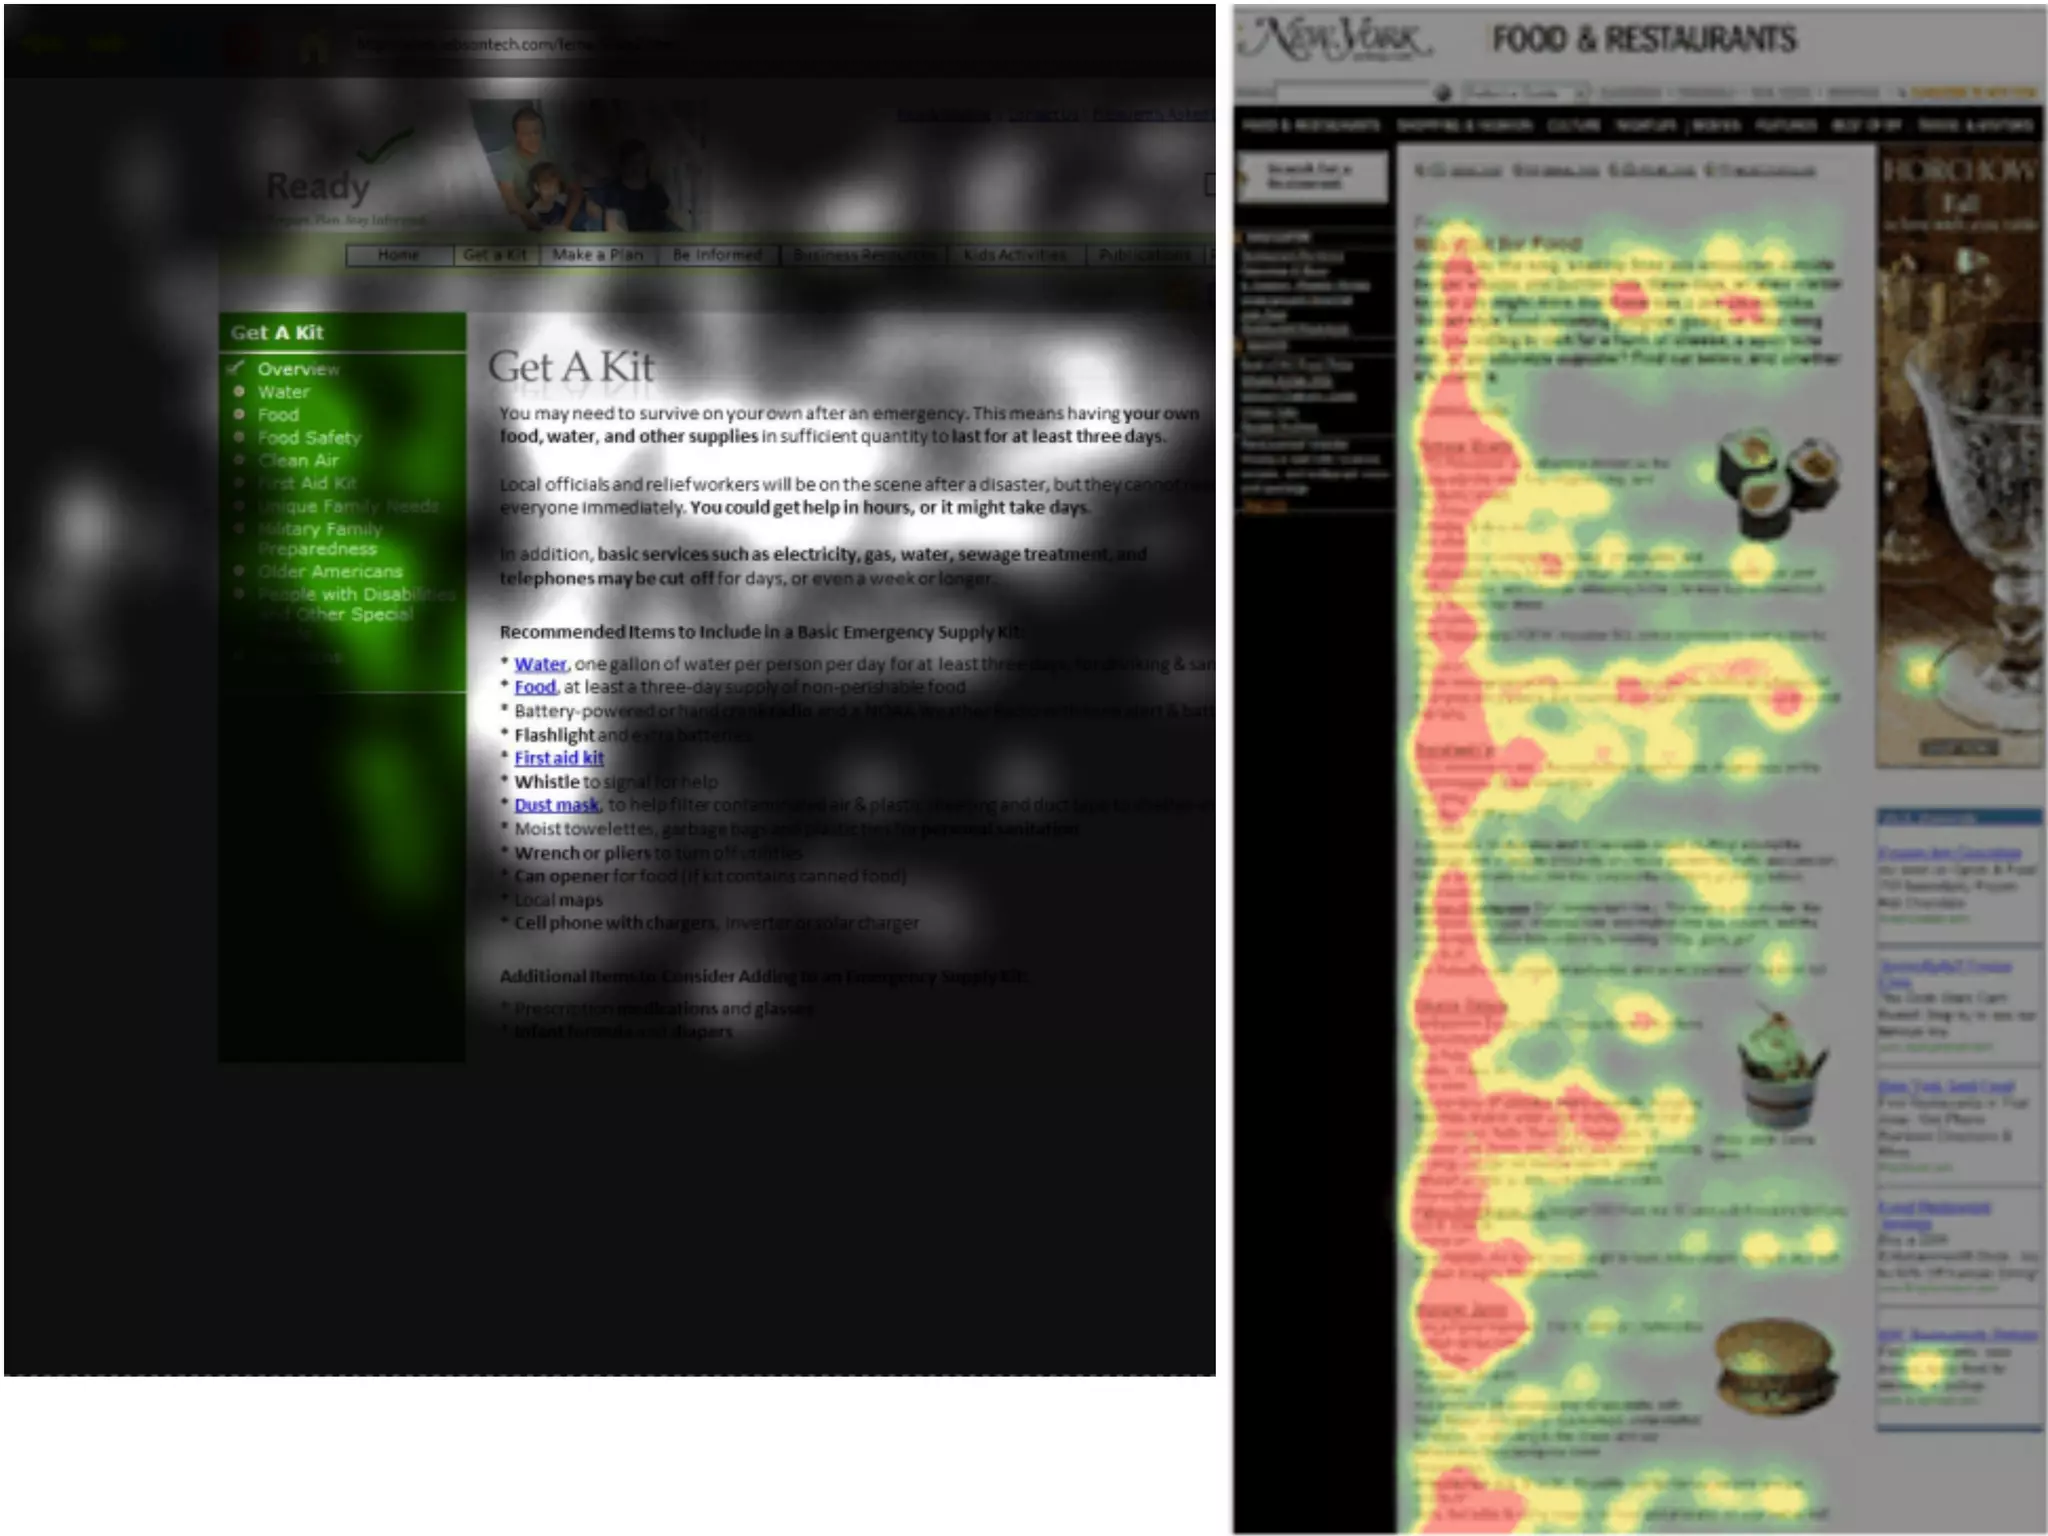
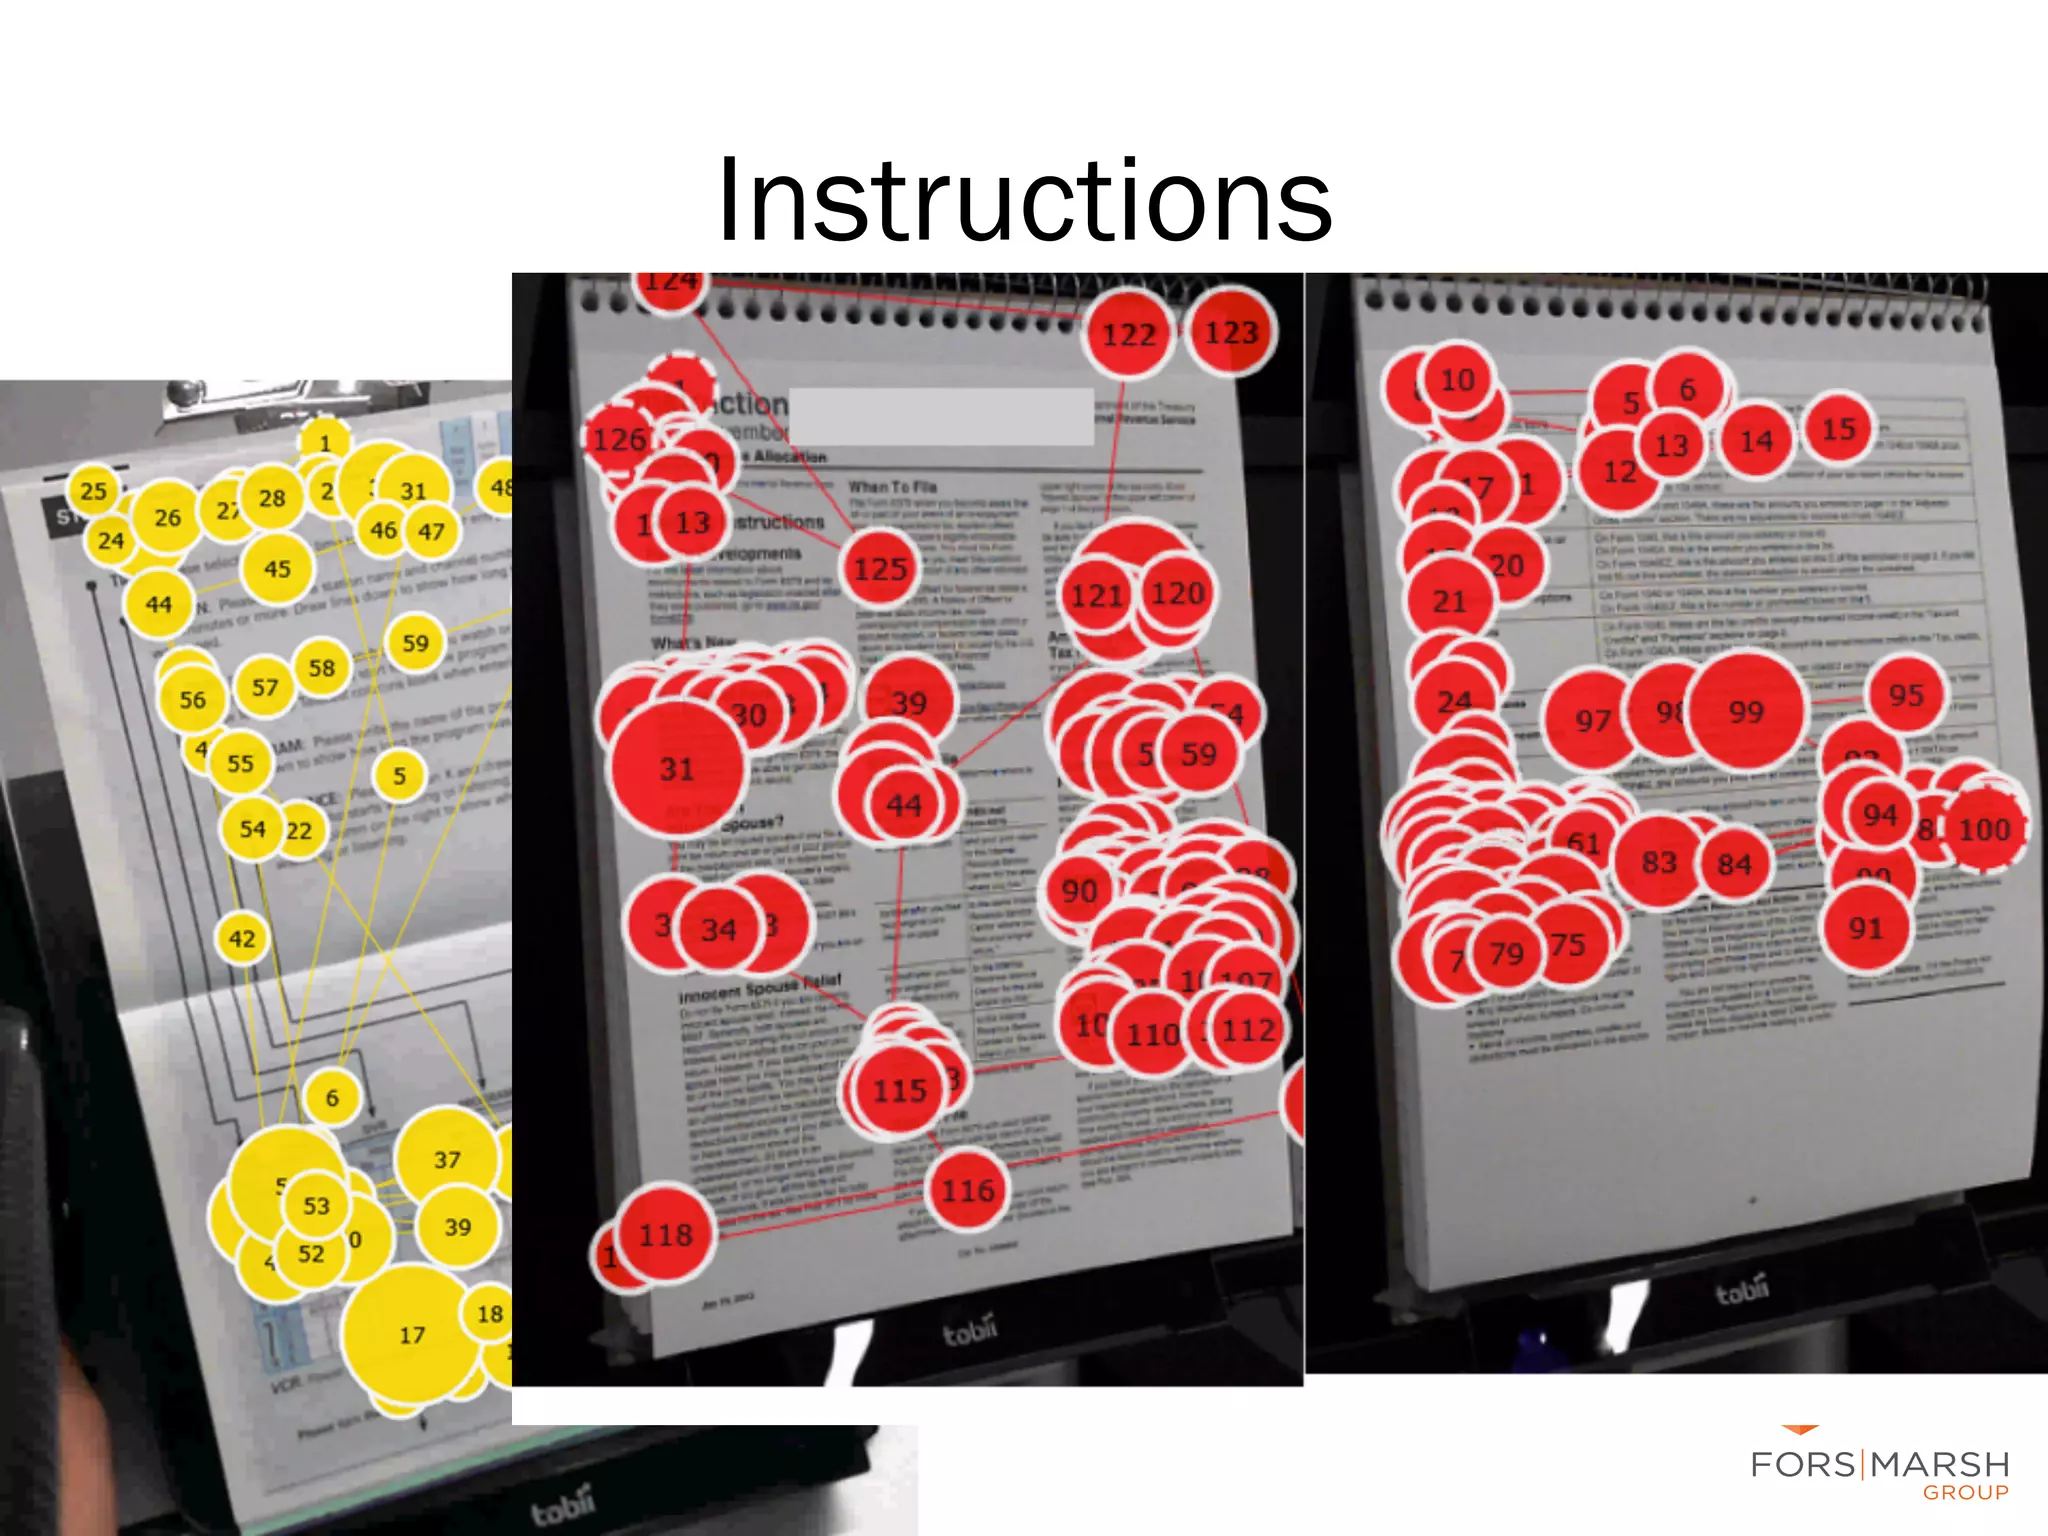
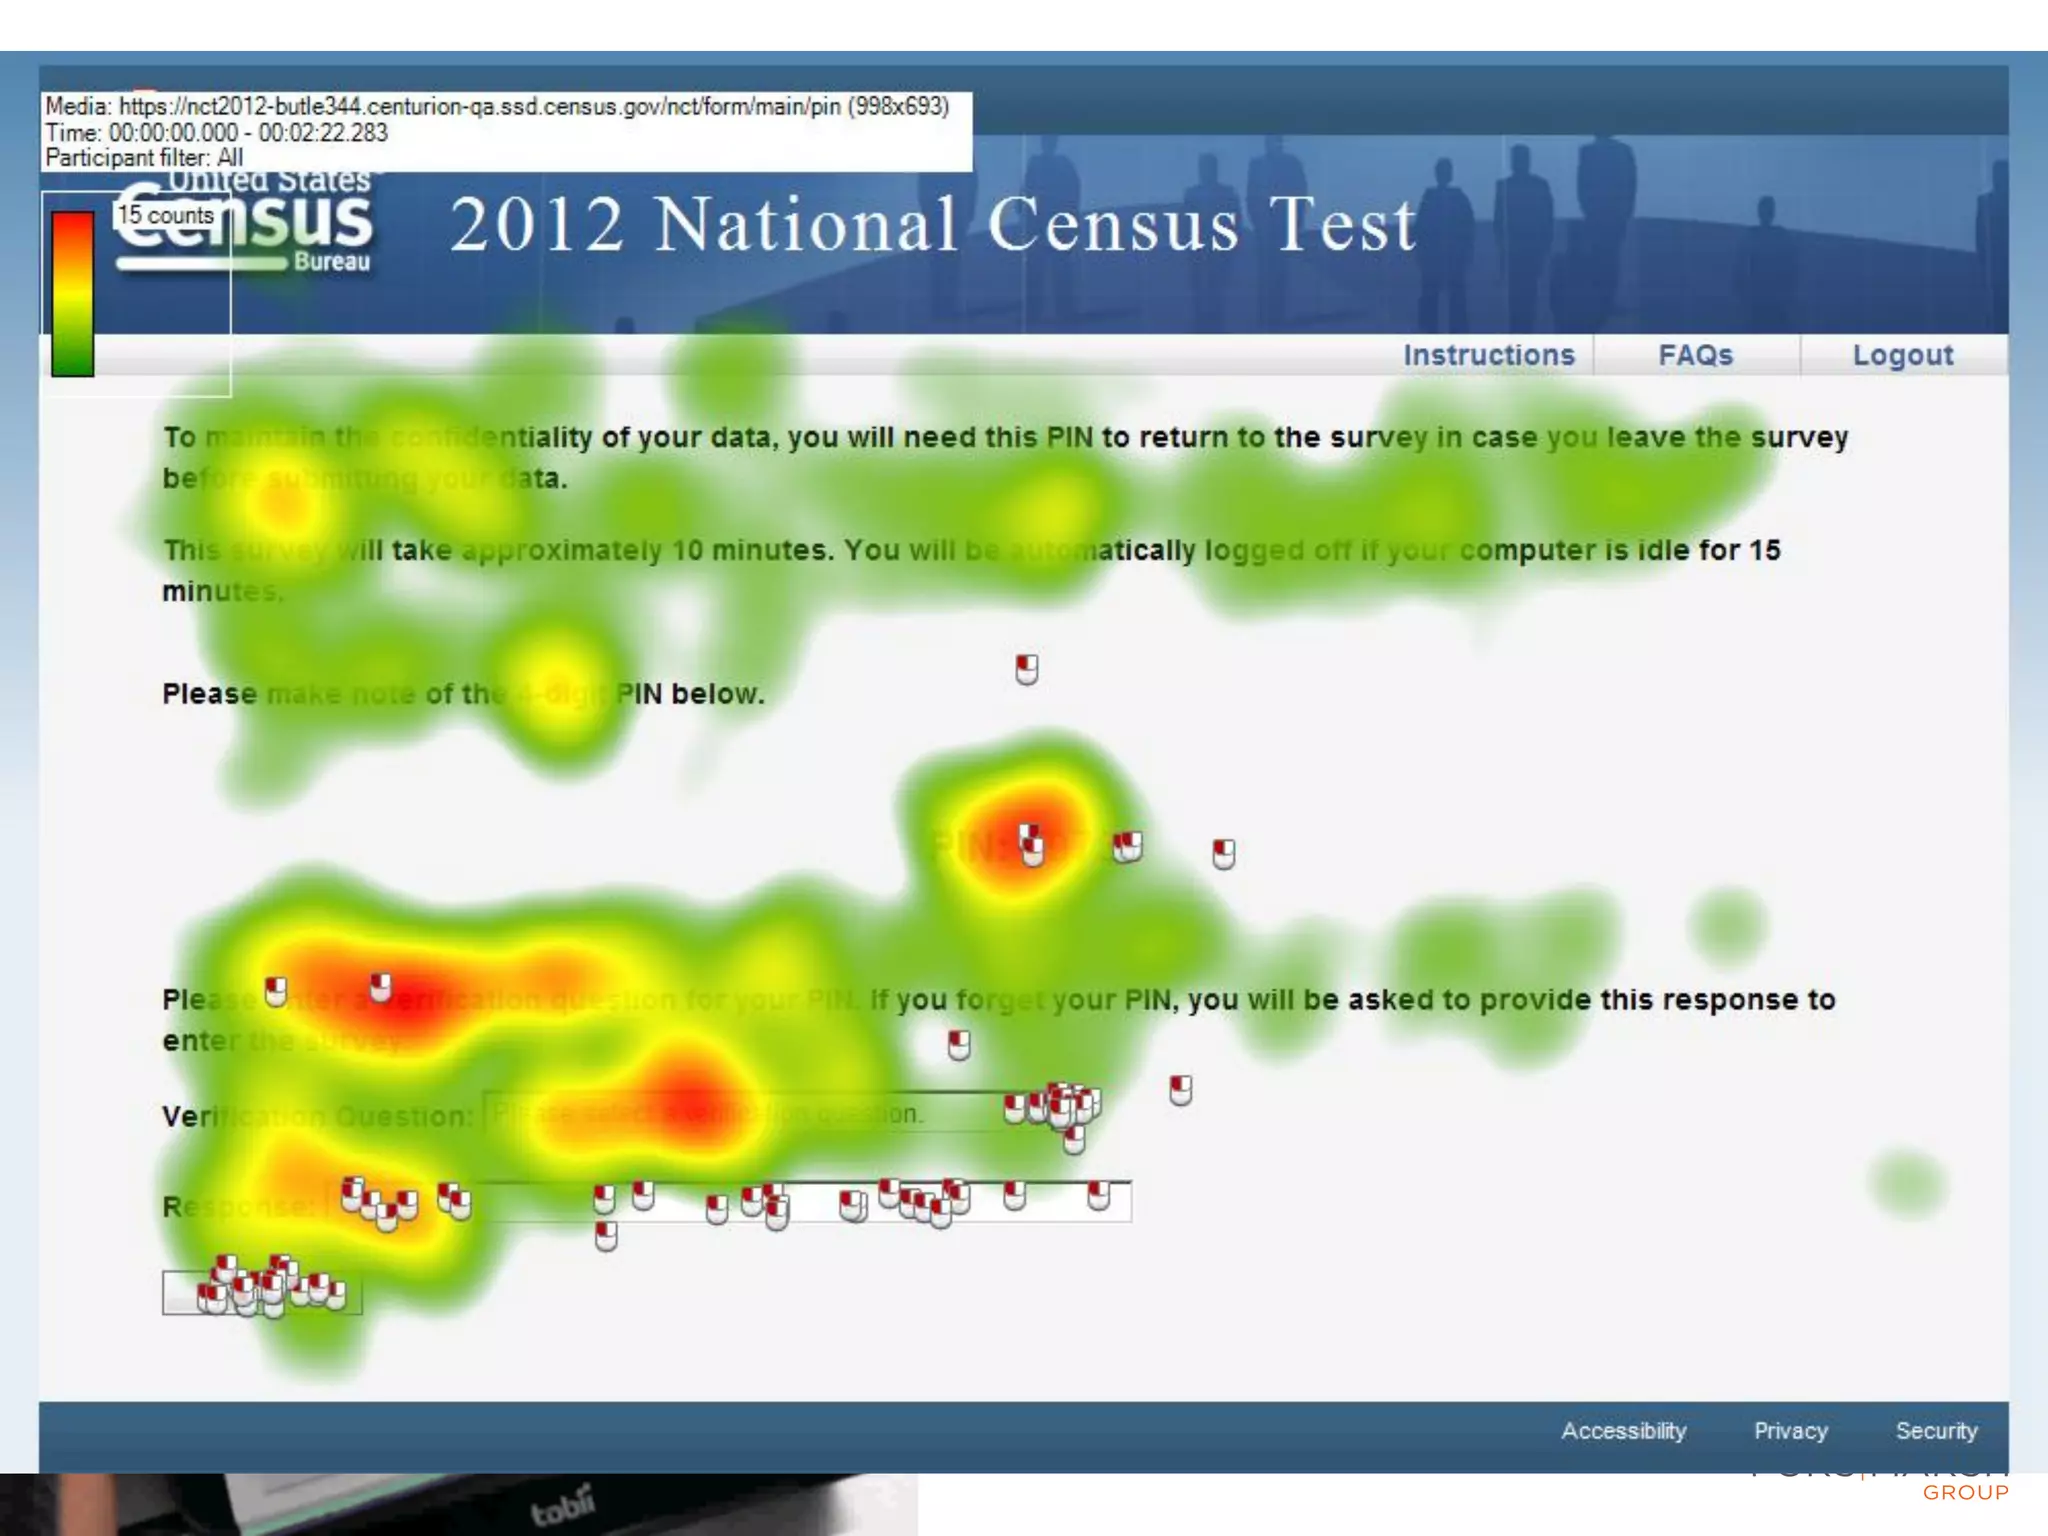
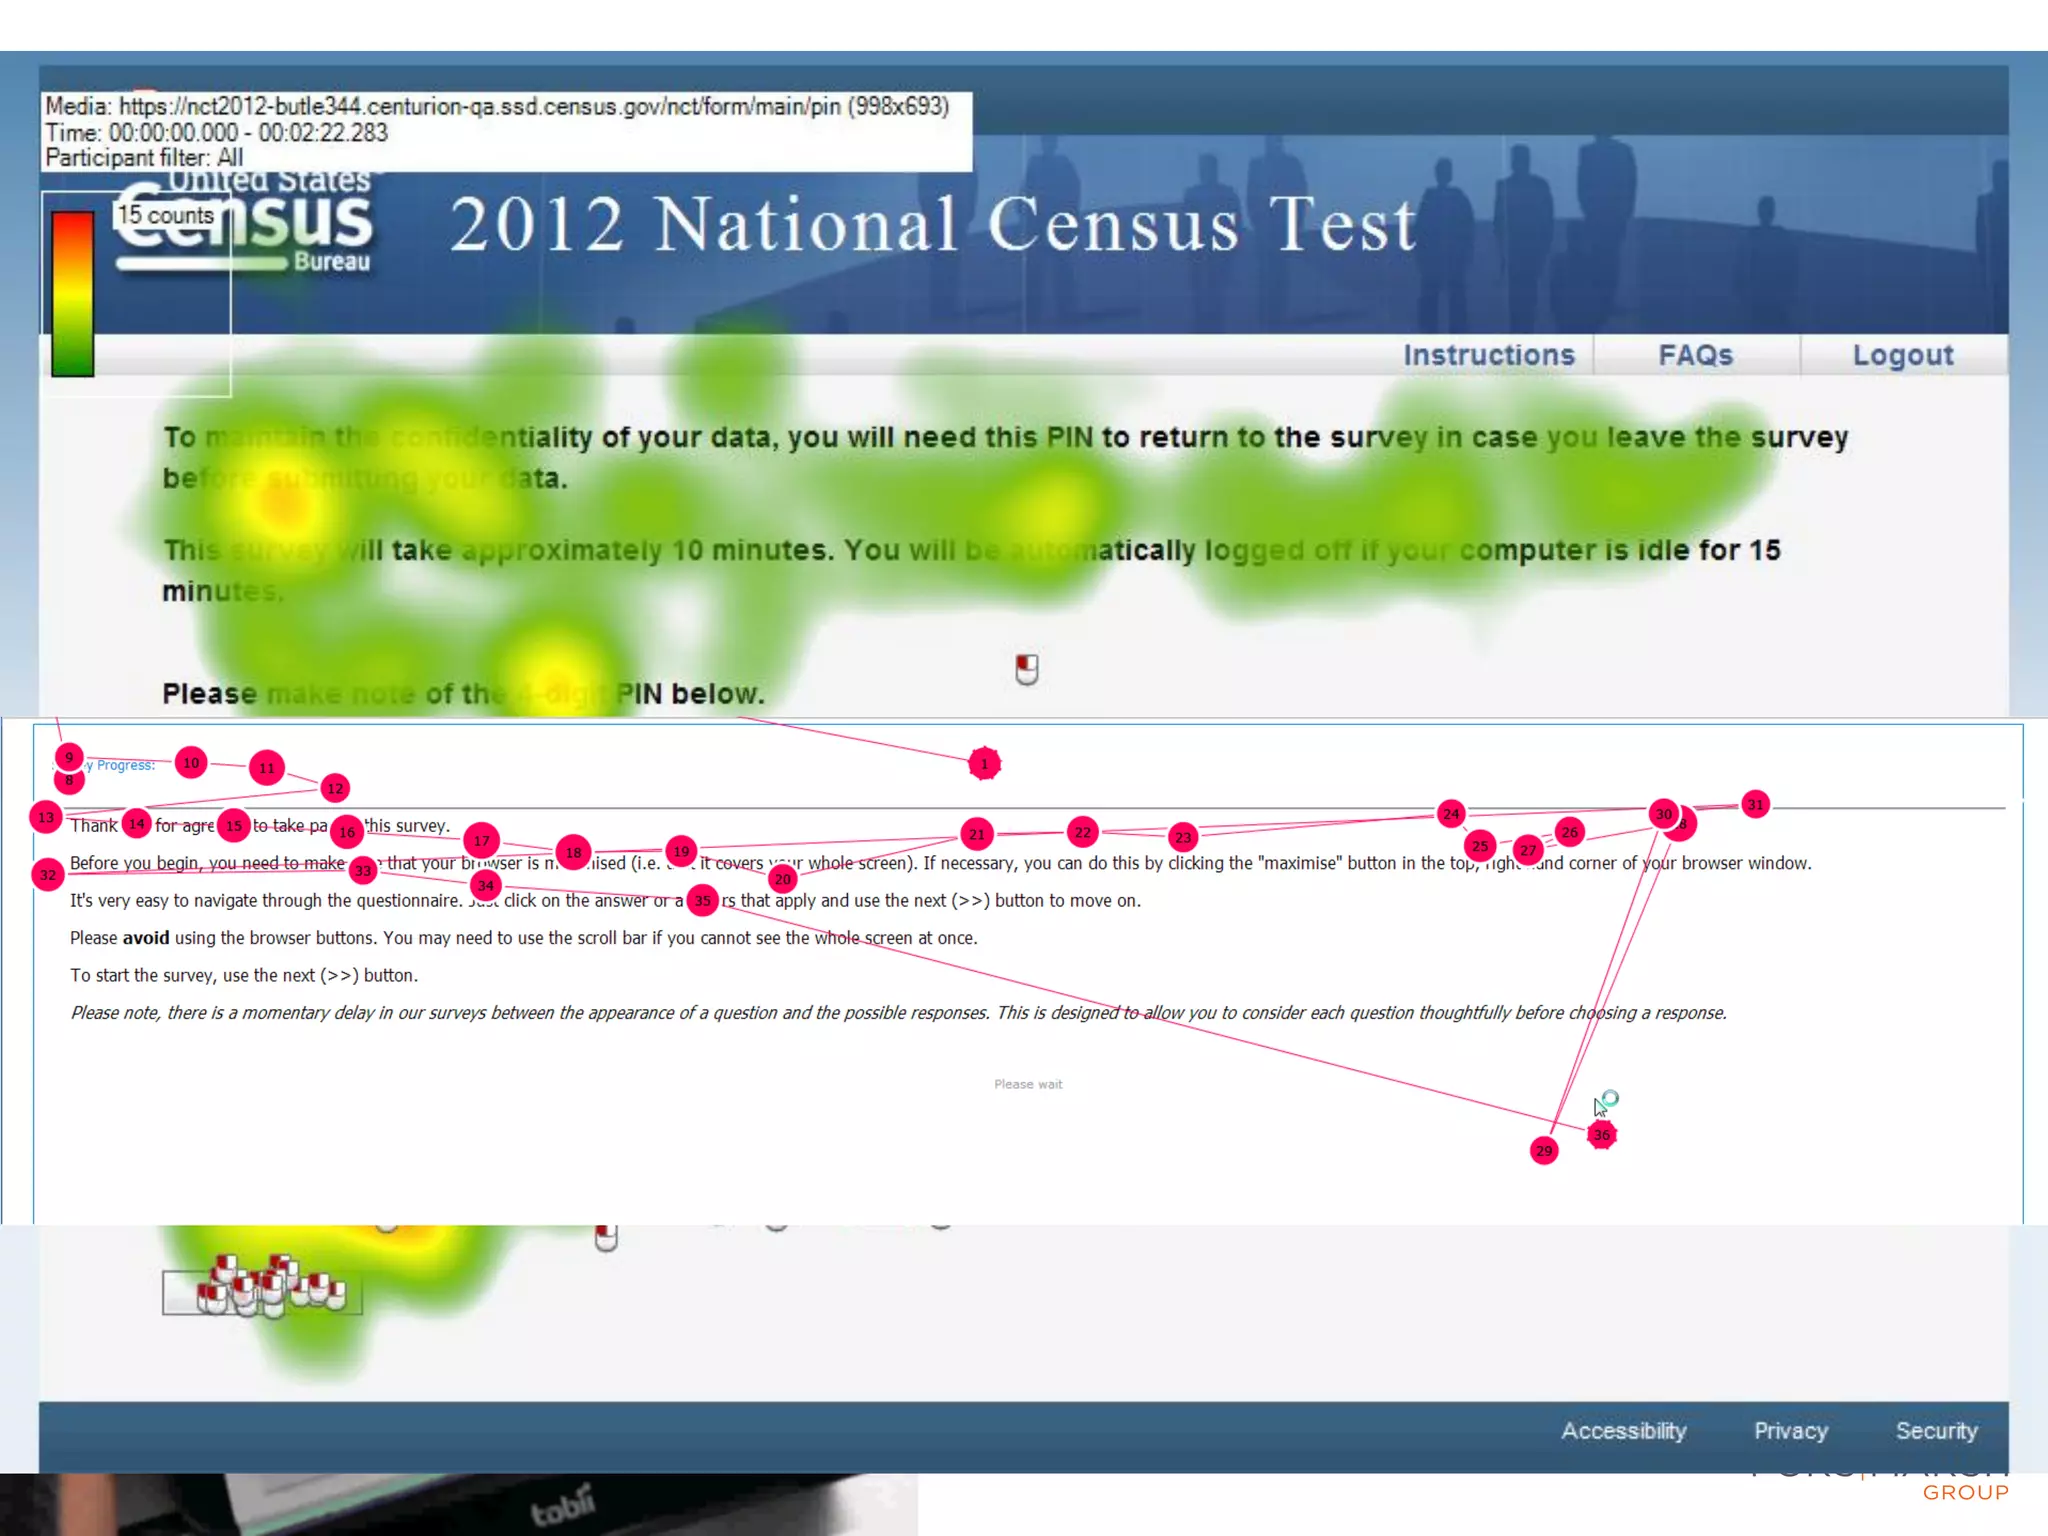
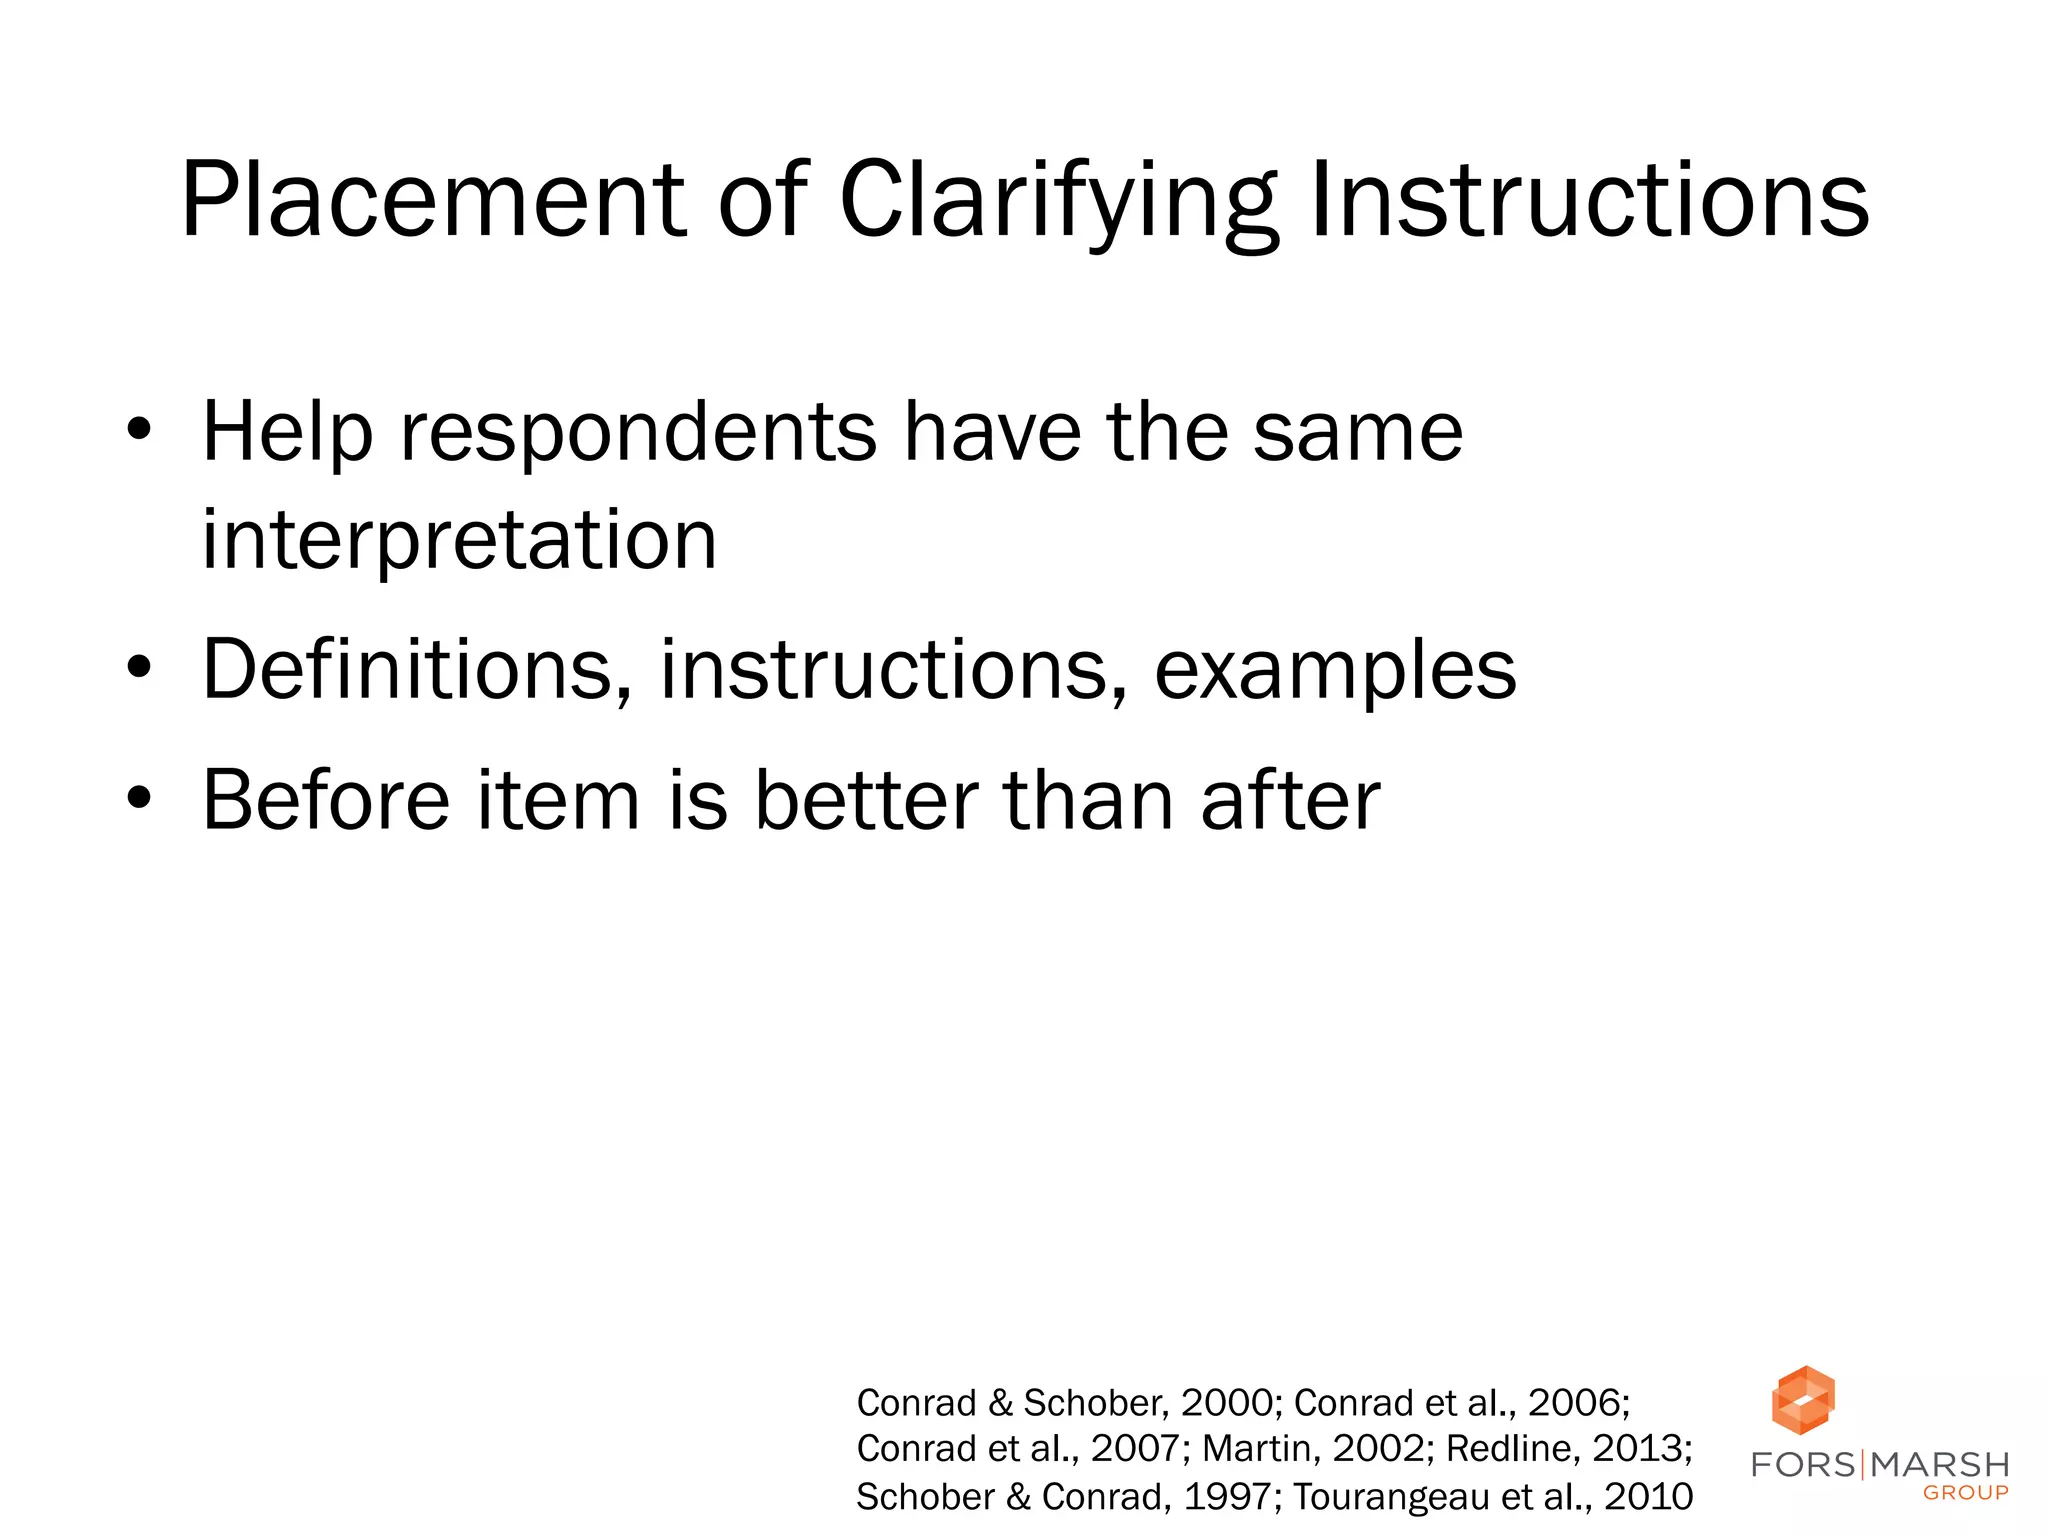
Usable Government Forms and
Surveys: Best Practices for Design
Jennifer Romano Bergstrom
February 26, 2014
MoDevGov| Rosslyn, VA
@romanocog
@forsmarshgroup
Usability vs. User Experience (UX)
Whitney’s 5 Es of Usability

• 
• 

Peter’s User Experience
Honeycomb

The	
  5	
  Es	
  to	
  Understanding	
  Users	
  (W.	
  Quesenbery):	
  h;p://www.wqusability.com/arCcles/geDng-­‐started.html	
  
User	
  Experience	
  Design	
  (P.	
  Morville):	
  h;p://semanCcstudios.com/publicaCons/semanCcs/000029.php	
  

2	
  
What People do on the Web

Krug, S. Don’t Make Me Think

3	
  
UX Design Failures
•  Poor planning
•  “It’s all about me.” (Redish: filing cabinets)
•  Human cognitive limitations
•  Memory and Perception
• 
• 
• 
• 

Primacy
Recency
Chunking
Patterns

4	
  
Patterns

5	
  
Patterns

6	
  
Patterns

7	
  
Mental Models & Repeating Behavior

8	
  
Mental Models & Repeating Behavior

9	
  
Activity
1.  Today’s date
2.  How long did it took you to get here today?

10	
  
Measuring the UX
“the extent to which a
product can be used by
specified users to
achieve specified goals
with effectiveness,
efficiency, and
satisfaction in a
specified context of
use.” ISO 9241-11
+ emotions

•  How does it work for the
end user?
•  What does the user
expect?
•  How does it make the user
feel?
	
  
11	
  
Where to Test
LABORATORY
•  Controlled environment
•  All participants have the
same experience
•  Record and
communicate from
control room
•  Observers watch from
control room and provide
additional probes (via
moderator) in real time
•  Incorporate physiological
measures (e.g., eye
tracking, EDA)

REMOTE

IN THE FIELD

•  Participants in their
natural environments
(e.g., home, work)

•  Participants tend to be
more comfortable in
their natural
environments

•  Use video chat
(moderated sessions)
or online programs
(unmoderated)

•  Recruit hard-to-reach
populations (e.g.,
children, doctors)

•  Conduct many sessions
quickly

•  Moderator travels to
various locations

•  Recruit participants in
many locations (e.g.,
states, countries)

•  Bring equipment (e.g.,
eye tracker)
•  Natural observations

•  No travel costs

12	
  
How to Test
ONE-ON-ONE SESSIONS
•  In-depth feedback from
each participant
•  No group think
•  Can allow participants to
take their own route and
explore freely

FOCUS GROUPS

SURVEYS

•  Participants may be
more comfortable with
others

•  Representative

•  Interview many people
quickly
•  Opinions collide

•  No interference

•  Peer review

•  Remote in participant’s
environment

•  Qualitative

•  Large sample sizes
•  Collect a lot of data
quickly
•  No interviewer bias
•  No scheduling sessions
•  Quantitative analysis

•  Flexible scheduling
•  Qualitative and
Quantitative

13	
  
How to Test
ONE-ON-ONE SESSIONS
•  In-depth feedback from
each participant
•  No group think
•  Can allow participants to
take their own route and
explore freely

FOCUS GROUPS

SURVEYS

•  Participants may be
more comfortable with
others

•  Representative

•  Interview many people
quickly
•  Opinions collide

•  No interference

•  Peer review

•  Remote in participant’s
environment

•  Qualitative

•  Large sample sizes
•  Collect a lot of data
quickly
•  No interviewer bias
•  No scheduling sessions
•  Quantitative analysis

•  Flexible scheduling
•  Qualitative and
Quantitative

14	
  
How to Test
ONE-ON-ONE SESSIONS
•  In-depth feedback from
each participant
•  No group think
•  Can allow participants to
take their own route and
explore freely
•  No interference
•  Remote in participant’s
environment
•  Flexible scheduling
•  Qualitative and
Quantitative

FOCUS GROUPS

SURVEYS

•  Participants may be
more comfortable with
others

•  Representative
•  Large sample sizes
•  Collect a lot of data
quickly

•  Interview many people
quickly
Scale

Overall
Experience

Did not like it at all (1) –
Liked it a lot (5)

3.9

•  No scheduling sessions

Likelihood to Use
Site in the Future

Not likely at all (1) –
Extremely likely (5)

3.1

•  Quantitative analysis

General
Organization of
Website

Not clear at all (1) –
Extremely Clear (5)

3.6

Helpfulness of
Search
Functionality

Not helpful at all (1) –
Extremely helpful (5)

3.9

Ease of
Navigation

Very Easy (1) –
Extremely Difficult (5)

2.0

Usefulness of tool

Not useful at all (1) –
Extremely useful (5)

3.7

•  Opinions collide
•  Peer review
•  Qualitative

Mean

•  No interviewer bias

Question

15	
  
When to Test

16	
  
What to Measure
EXPLICIT

OBSERVATIONAL

+	
  Post-task satisfaction
questionnaires
+	
  In-session difficulty ratings
+	
  Verbal responses
+	
  Moderator follow up
+	
  Real-time +/- dial

+	
  Ethnography
+	
  Time to complete task
+	
  Reaction time
+	
  Selection/click behavior
+	
  Ability to complete tasks
+	
  Accuracy

IMPLICIT
+	
  Facial expression analysis
+	
  Eye tracking
+	
  Electrodermal activity (EDA)
+	
  Behavioral analysis
+	
  Linguistic analysis of verbalizations
+	
  Implicit associations
+	
  Pupil dilation

17	
  
Why is Design Important in
Web Surveys and Forms?
•  No interviewer present to correct/advise
•  Visual presentation affects responses
•  While the Internet provides many ways to
enhance surveys, design tools may be
misused

18	
  
Why is Design Important?
•  Respondents extract meaning from how
question and response options are displayed
•  Design may distract from or interfere with
responses
•  Design may affect data quality

19	
  
Why is Design Important?
Note: We don’t have much confidence in the totals for
ages 5-7 because it appears that some respondents
chose these responses rather than scroll through the list
to their correct age.

http://www.cc.gatech.edu/gvu/user_surveys/

20	
  
Why is Design Important?
•  Respondents are more tech savvy today and
use multiple technologies
•  It is not just about reducing respondent
burden and nonresponse
•  We must increase engagement
•  High-quality design = trust in the designer

Adams & Darwin, 1982; Dillman et al., 1993;
Haberlein & Baumgartner, 1978

21	
  
http://www.pewinternet.org/Static-Pages/TrendData-(Adults)/Device-Ownership.aspx

22	
  
Considerations
•  Navigation
•  Edits and Input
Fields
•  Checkboxes and
Radio Buttons
•  Instructions and
Help

23	
  
Navigation
•  In a paging survey, after entering a response
–  Proceed to next page
–  Return to previous page (sometimes)
–  Quit or stop
–  Launch separate page with Help, definitions, etc.

24
Navigation: NP
•  Next should be on the left
–  Reduces the amount of time to move cursor to
primary navigation button
–  Frequency of use

Couper, 2008; Dillman et al., 2009; Faulkner,
1998; Koyani et al., 2004; Wroblewski, 2008

25
Navigation NP Example

Peytchev	
  	
  &	
  Peytcheva,	
  2011	
  

26	
  
Navigation: PN
•  Previous should be on the left
–  Web application order
–  Everyday devices
–  Logical reading order

27
Navigation PN Example

28	
  
Navigation PN Example

29	
  
Navigation PN Example

30	
  
Navigation PN Example

31	
  
Comparing the Two

Romano & Chen, 2011

•  Participants looked at Previous and Next in PN conditions
•  Many participants looked at Previous in the N_P conditions
–  Couper et al. (2011): Previous gets used more when it is on the right.

32
Navigation Alternative
•  Previous below Next
–  Buttons can be closer
–  But what about older adults?
–  What about on mobile?

Couper et al., 2011; Wroblewski, 2008

33
Navigation Alternative: Large primary
navigation button; secondary smaller

34
Navigation Alternative: No back/
previous option

35
Confusing Navigation

36
Considerations
•  Navigation
•  Edits and Input
Fields
•  Checkboxes and
Radio Buttons
•  Instructions and
Help

37	
  
Input Fields Example

38	
  
Open-Ended Responses: Narrative
•  Avoid vertical scrolling when possible
•  Always avoid horizontal scrolling

39
Open-Ended Responses: Narrative
•  Avoid vertical scrolling when possible
•  Always avoid horizontal scrolling

32.8 characters

38.4 characters

~700 Rs

Wells et al., 2012

40
Open-Ended Responses: Numeric
•  Is there a better way?

41
Open-Ended Responses: Numeric
•  Is there a better way?

42
Open-Ended Responses: Numeric
•  Use of templates reduces ill-formed responses
–  E.g., $_________.00

Couper et al., 2009; Fuchs, 2007

43
Open-Ended Responses: Date
•  Not a good use: intended response will
always be the same format
•  Same for state, zip code, etc.
•  Note
–  “Month” = text
–  “mm/yyyy” = #s

44
Considerations
•  Navigation
•  Edits and Input
Fields
•  Checkboxes and
Radio Buttons
•  Instructions and
Help

45	
  
Check Boxes and Radio Buttons
•  Perceived Affordances
•  Design according to existing conventions and
expectations
•  What are the conventions?

46
Check Boxes: Select all that apply

47
Radio Buttons: Select only one

48
Radio Buttons: In grids

49
Radio Buttons on mobile
•  Would something
else be better?

50
Reducing Options
•  What is necessary?

51
Reducing Options
•  What is necessary?

52
Considerations
•  Navigation
•  Edits and Input
Fields
•  Checkboxes and
Radio Buttons
•  Instructions and
Help

53	
  
Placement of Instructions
•  Place them
near the item
•  “Don’t make
me think”
•  Are they
necessary?

54
Placement of Instructions
•  Place them
near the item
•  “Don’t make
me think”
•  Are they
necessary?

55
Placement of Instructions
•  Place them
near the item
•  “Don’t make
me think”
•  Are they
necessary?

56
Placement of Instructions
•  Place them
near the item
•  “Don’t make
me think”
•  Are they
necessary?

57
Instructions

58
Instructions

59
Instructions

60
Instructions

61
Instructions

62
Instructions

63
Instructions

64
Placement of Clarifying Instructions
•  Help respondents have the same
interpretation
•  Definitions, instructions, examples
•  Before item is better than after

Conrad & Schober, 2000; Conrad et al., 2006;
Conrad et al., 2007; Martin, 2002; Redline, 2013;
Schober & Conrad, 1997; Tourangeau et al., 2010

65
Placement of Help
•  People are less likely to use help when they
have to click than when it is near item
•  “Don’t make me think”

66
Placement of Error Message
•  Should be near the item
•  Should be positive and helpful, suggesting
HOW to help
•  Bad error message:

67
Placement of Error Message
•  Should be near the item
•  Should be positive and helpful, suggesting
HOW to help
•  Bad error message:

68
Placement of Error Message
•  Should be near the item
•  Should be positive and helpful, suggesting
HOW to help
•  Bad error message:

69
Placement of Error Message
•  Should be near the item
•  Should be positive and helpful, suggesting
HOW to help
•  Bad error message:

70
Error Message Across Devices

71
Error Message Across Devices

72
Better UX means…
•  Higher user satisfaction
–  Increased efficiency and accuracy
–  Repeat visits and recommendations
•  Decreased costs for the organization
–  Reduce call center phone calls and staffing
•  Data you can trust
–  Empirically tested products
•  From the end users’ perspective
73
Thank you!
•  Twitter: @forsmarshgroup
•  LinkedIn: http://www.linkedin.com/company/fors-marsh-group
•  Blog: www.forsmarshgroup.com/index.php/blog

Jennifer Romano Bergstrom
@romanocog
jbergstrom@forsmarshgroup.com
MoDevGov| Rosslyn, VA

Usable Government Forms and Surveys: Best Practices for Design (from MoDevGov)

  • 1.
    Usable Government Formsand Surveys: Best Practices for Design Jennifer Romano Bergstrom February 26, 2014 MoDevGov| Rosslyn, VA @romanocog @forsmarshgroup
  • 2.
    Usability vs. UserExperience (UX) Whitney’s 5 Es of Usability •  •  Peter’s User Experience Honeycomb The  5  Es  to  Understanding  Users  (W.  Quesenbery):  h;p://www.wqusability.com/arCcles/geDng-­‐started.html   User  Experience  Design  (P.  Morville):  h;p://semanCcstudios.com/publicaCons/semanCcs/000029.php   2  
  • 3.
    What People doon the Web Krug, S. Don’t Make Me Think 3  
  • 4.
    UX Design Failures • Poor planning •  “It’s all about me.” (Redish: filing cabinets) •  Human cognitive limitations •  Memory and Perception •  •  •  •  Primacy Recency Chunking Patterns 4  
  • 5.
  • 6.
  • 7.
  • 8.
    Mental Models &Repeating Behavior 8  
  • 9.
    Mental Models &Repeating Behavior 9  
  • 10.
    Activity 1.  Today’s date 2. How long did it took you to get here today? 10  
  • 11.
    Measuring the UX “theextent to which a product can be used by specified users to achieve specified goals with effectiveness, efficiency, and satisfaction in a specified context of use.” ISO 9241-11 + emotions •  How does it work for the end user? •  What does the user expect? •  How does it make the user feel?   11  
  • 12.
    Where to Test LABORATORY • Controlled environment •  All participants have the same experience •  Record and communicate from control room •  Observers watch from control room and provide additional probes (via moderator) in real time •  Incorporate physiological measures (e.g., eye tracking, EDA) REMOTE IN THE FIELD •  Participants in their natural environments (e.g., home, work) •  Participants tend to be more comfortable in their natural environments •  Use video chat (moderated sessions) or online programs (unmoderated) •  Recruit hard-to-reach populations (e.g., children, doctors) •  Conduct many sessions quickly •  Moderator travels to various locations •  Recruit participants in many locations (e.g., states, countries) •  Bring equipment (e.g., eye tracker) •  Natural observations •  No travel costs 12  
  • 13.
    How to Test ONE-ON-ONESESSIONS •  In-depth feedback from each participant •  No group think •  Can allow participants to take their own route and explore freely FOCUS GROUPS SURVEYS •  Participants may be more comfortable with others •  Representative •  Interview many people quickly •  Opinions collide •  No interference •  Peer review •  Remote in participant’s environment •  Qualitative •  Large sample sizes •  Collect a lot of data quickly •  No interviewer bias •  No scheduling sessions •  Quantitative analysis •  Flexible scheduling •  Qualitative and Quantitative 13  
  • 14.
    How to Test ONE-ON-ONESESSIONS •  In-depth feedback from each participant •  No group think •  Can allow participants to take their own route and explore freely FOCUS GROUPS SURVEYS •  Participants may be more comfortable with others •  Representative •  Interview many people quickly •  Opinions collide •  No interference •  Peer review •  Remote in participant’s environment •  Qualitative •  Large sample sizes •  Collect a lot of data quickly •  No interviewer bias •  No scheduling sessions •  Quantitative analysis •  Flexible scheduling •  Qualitative and Quantitative 14  
  • 15.
    How to Test ONE-ON-ONESESSIONS •  In-depth feedback from each participant •  No group think •  Can allow participants to take their own route and explore freely •  No interference •  Remote in participant’s environment •  Flexible scheduling •  Qualitative and Quantitative FOCUS GROUPS SURVEYS •  Participants may be more comfortable with others •  Representative •  Large sample sizes •  Collect a lot of data quickly •  Interview many people quickly Scale Overall Experience Did not like it at all (1) – Liked it a lot (5) 3.9 •  No scheduling sessions Likelihood to Use Site in the Future Not likely at all (1) – Extremely likely (5) 3.1 •  Quantitative analysis General Organization of Website Not clear at all (1) – Extremely Clear (5) 3.6 Helpfulness of Search Functionality Not helpful at all (1) – Extremely helpful (5) 3.9 Ease of Navigation Very Easy (1) – Extremely Difficult (5) 2.0 Usefulness of tool Not useful at all (1) – Extremely useful (5) 3.7 •  Opinions collide •  Peer review •  Qualitative Mean •  No interviewer bias Question 15  
  • 16.
  • 17.
    What to Measure EXPLICIT OBSERVATIONAL +  Post-task satisfaction questionnaires +  In-session difficulty ratings +  Verbal responses +  Moderator follow up +  Real-time +/- dial +  Ethnography +  Time to complete task +  Reaction time +  Selection/click behavior +  Ability to complete tasks +  Accuracy IMPLICIT +  Facial expression analysis +  Eye tracking +  Electrodermal activity (EDA) +  Behavioral analysis +  Linguistic analysis of verbalizations +  Implicit associations +  Pupil dilation 17  
  • 18.
    Why is DesignImportant in Web Surveys and Forms? •  No interviewer present to correct/advise •  Visual presentation affects responses •  While the Internet provides many ways to enhance surveys, design tools may be misused 18  
  • 19.
    Why is DesignImportant? •  Respondents extract meaning from how question and response options are displayed •  Design may distract from or interfere with responses •  Design may affect data quality 19  
  • 20.
    Why is DesignImportant? Note: We don’t have much confidence in the totals for ages 5-7 because it appears that some respondents chose these responses rather than scroll through the list to their correct age. http://www.cc.gatech.edu/gvu/user_surveys/ 20  
  • 21.
    Why is DesignImportant? •  Respondents are more tech savvy today and use multiple technologies •  It is not just about reducing respondent burden and nonresponse •  We must increase engagement •  High-quality design = trust in the designer Adams & Darwin, 1982; Dillman et al., 1993; Haberlein & Baumgartner, 1978 21  
  • 22.
  • 23.
    Considerations •  Navigation •  Editsand Input Fields •  Checkboxes and Radio Buttons •  Instructions and Help 23  
  • 24.
    Navigation •  In apaging survey, after entering a response –  Proceed to next page –  Return to previous page (sometimes) –  Quit or stop –  Launch separate page with Help, definitions, etc. 24
  • 25.
    Navigation: NP •  Nextshould be on the left –  Reduces the amount of time to move cursor to primary navigation button –  Frequency of use Couper, 2008; Dillman et al., 2009; Faulkner, 1998; Koyani et al., 2004; Wroblewski, 2008 25
  • 26.
    Navigation NP Example Peytchev    &  Peytcheva,  2011   26  
  • 27.
    Navigation: PN •  Previousshould be on the left –  Web application order –  Everyday devices –  Logical reading order 27
  • 28.
  • 29.
  • 30.
  • 31.
  • 32.
    Comparing the Two Romano& Chen, 2011 •  Participants looked at Previous and Next in PN conditions •  Many participants looked at Previous in the N_P conditions –  Couper et al. (2011): Previous gets used more when it is on the right. 32
  • 33.
    Navigation Alternative •  Previousbelow Next –  Buttons can be closer –  But what about older adults? –  What about on mobile? Couper et al., 2011; Wroblewski, 2008 33
  • 34.
    Navigation Alternative: Largeprimary navigation button; secondary smaller 34
  • 35.
    Navigation Alternative: Noback/ previous option 35
  • 36.
  • 37.
    Considerations •  Navigation •  Editsand Input Fields •  Checkboxes and Radio Buttons •  Instructions and Help 37  
  • 38.
  • 39.
    Open-Ended Responses: Narrative • Avoid vertical scrolling when possible •  Always avoid horizontal scrolling 39
  • 40.
    Open-Ended Responses: Narrative • Avoid vertical scrolling when possible •  Always avoid horizontal scrolling 32.8 characters 38.4 characters ~700 Rs Wells et al., 2012 40
  • 41.
    Open-Ended Responses: Numeric • Is there a better way? 41
  • 42.
    Open-Ended Responses: Numeric • Is there a better way? 42
  • 43.
    Open-Ended Responses: Numeric • Use of templates reduces ill-formed responses –  E.g., $_________.00 Couper et al., 2009; Fuchs, 2007 43
  • 44.
    Open-Ended Responses: Date • Not a good use: intended response will always be the same format •  Same for state, zip code, etc. •  Note –  “Month” = text –  “mm/yyyy” = #s 44
  • 45.
    Considerations •  Navigation •  Editsand Input Fields •  Checkboxes and Radio Buttons •  Instructions and Help 45  
  • 46.
    Check Boxes andRadio Buttons •  Perceived Affordances •  Design according to existing conventions and expectations •  What are the conventions? 46
  • 47.
    Check Boxes: Selectall that apply 47
  • 48.
  • 49.
  • 50.
    Radio Buttons onmobile •  Would something else be better? 50
  • 51.
  • 52.
  • 53.
    Considerations •  Navigation •  Editsand Input Fields •  Checkboxes and Radio Buttons •  Instructions and Help 53  
  • 54.
    Placement of Instructions • Place them near the item •  “Don’t make me think” •  Are they necessary? 54
  • 55.
    Placement of Instructions • Place them near the item •  “Don’t make me think” •  Are they necessary? 55
  • 56.
    Placement of Instructions • Place them near the item •  “Don’t make me think” •  Are they necessary? 56
  • 57.
    Placement of Instructions • Place them near the item •  “Don’t make me think” •  Are they necessary? 57
  • 58.
  • 59.
  • 60.
  • 61.
  • 62.
  • 63.
  • 64.
  • 65.
    Placement of ClarifyingInstructions •  Help respondents have the same interpretation •  Definitions, instructions, examples •  Before item is better than after Conrad & Schober, 2000; Conrad et al., 2006; Conrad et al., 2007; Martin, 2002; Redline, 2013; Schober & Conrad, 1997; Tourangeau et al., 2010 65
  • 66.
    Placement of Help • People are less likely to use help when they have to click than when it is near item •  “Don’t make me think” 66
  • 67.
    Placement of ErrorMessage •  Should be near the item •  Should be positive and helpful, suggesting HOW to help •  Bad error message: 67
  • 68.
    Placement of ErrorMessage •  Should be near the item •  Should be positive and helpful, suggesting HOW to help •  Bad error message: 68
  • 69.
    Placement of ErrorMessage •  Should be near the item •  Should be positive and helpful, suggesting HOW to help •  Bad error message: 69
  • 70.
    Placement of ErrorMessage •  Should be near the item •  Should be positive and helpful, suggesting HOW to help •  Bad error message: 70
  • 71.
  • 72.
  • 73.
    Better UX means… • Higher user satisfaction –  Increased efficiency and accuracy –  Repeat visits and recommendations •  Decreased costs for the organization –  Reduce call center phone calls and staffing •  Data you can trust –  Empirically tested products •  From the end users’ perspective 73
  • 74.
    Thank you! •  Twitter:@forsmarshgroup •  LinkedIn: http://www.linkedin.com/company/fors-marsh-group •  Blog: www.forsmarshgroup.com/index.php/blog Jennifer Romano Bergstrom @romanocog jbergstrom@forsmarshgroup.com MoDevGov| Rosslyn, VA