Download to read offline


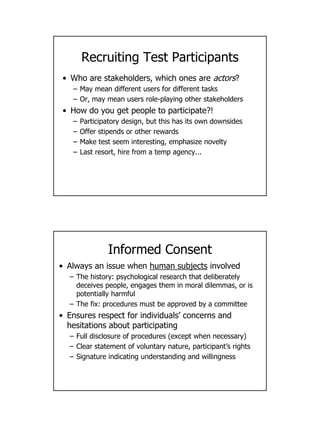


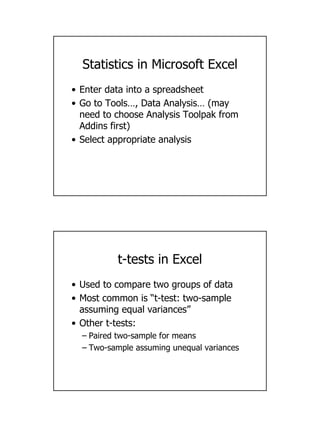


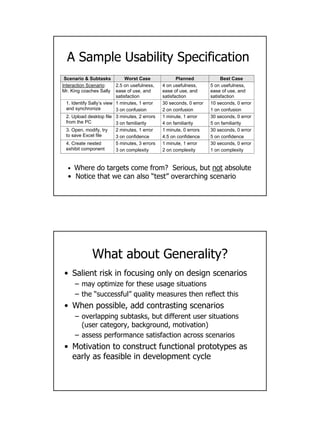

This document discusses various methods for evaluating the usability of systems, including both analytic methods conducted by experts and empirical methods involving observations of and surveys with users. Empirical evaluations aim to draw valid conclusions about real-world usage but can be challenging due to issues with the representativeness of test users, the realism of test contexts and tasks, and whether collected data truly reflects real impacts. Field studies observe users in realistic contexts but are time-consuming, while lab studies allow more control but also reduce realism. Interviews rely on subjective user memory and perspective. Statistics like t-tests and ANOVAs can be used to analyze empirical data and determine statistical significance.


![[DSC Europe 25] Srba Markovic - From Pilot to Production: Overcoming AI Deplo...](https://cdn.slidesharecdn.com/ss_thumbnails/yjjmrtytmwbalxlba7px-4-srba-markovic-from-pilot-to-production-overcoming-ai-deployment-blockers-with-260114111931-4a892d44-thumbnail.jpg?width=640&height=640&fit=bounds)


![[DSC Europe 25] Nikola Vasiljevic - Player segmentation by combat playstyles ...](https://cdn.slidesharecdn.com/ss_thumbnails/mnvbf0yvrwaqsipzrrv3-2-nikola-vasiljevic-player-segmentation-by-playstyles-in-action-shooter-games-260114111931-b4d766cd-thumbnail.jpg?width=640&height=640&fit=bounds)

