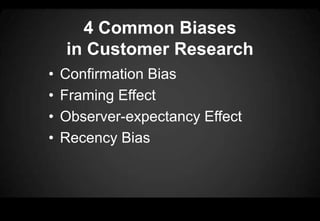
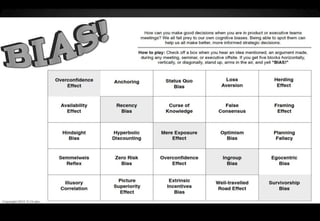
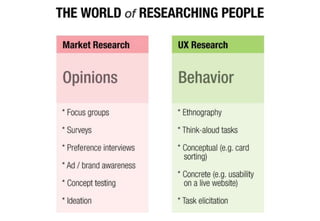
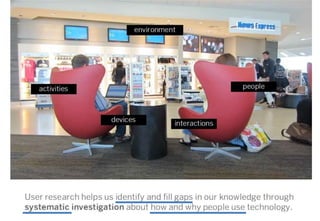
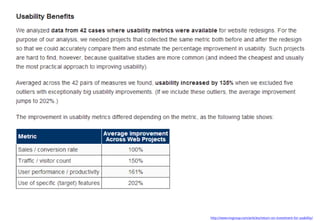
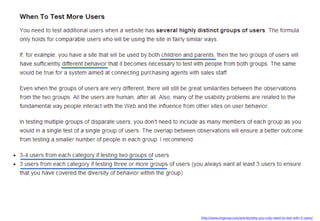
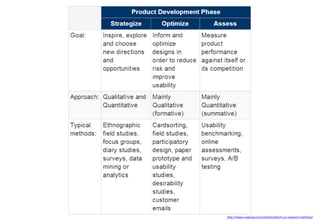
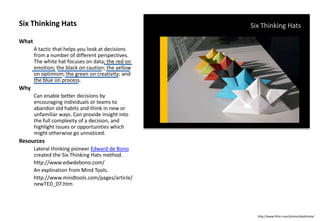
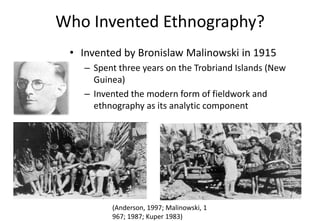
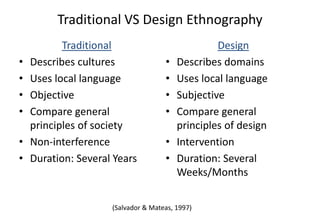
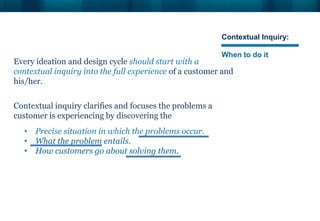
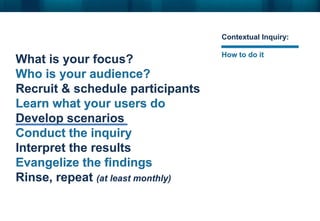
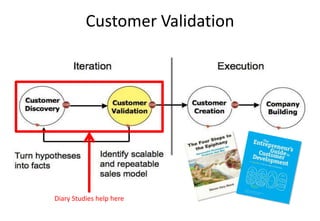
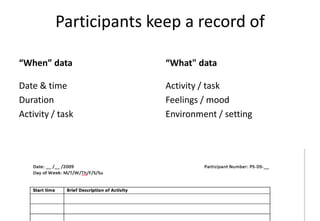
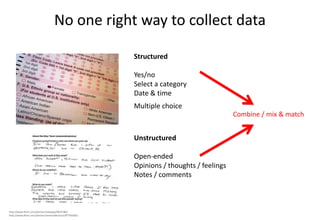
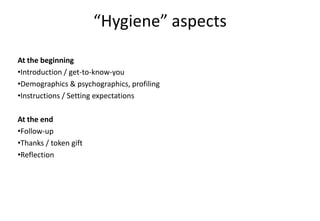
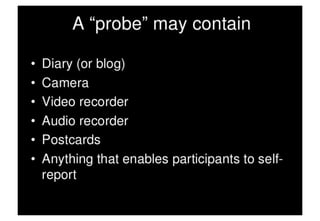
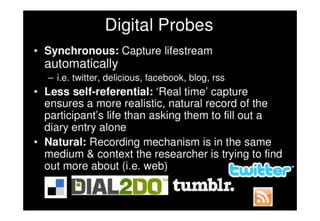
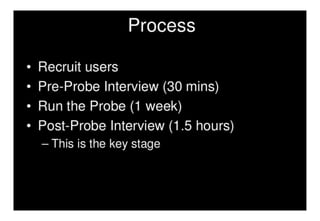
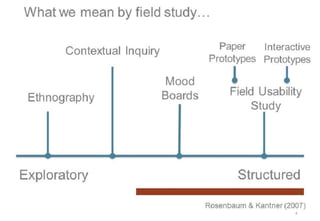
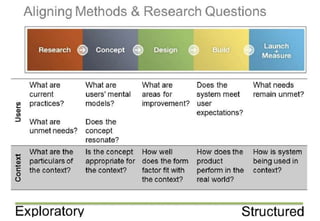
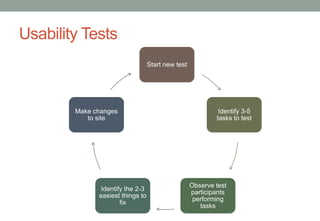
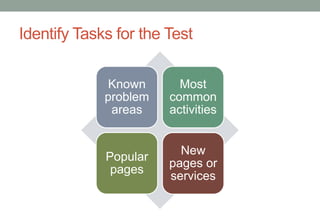
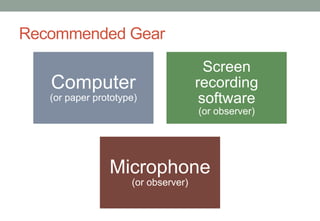
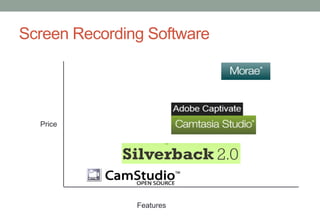
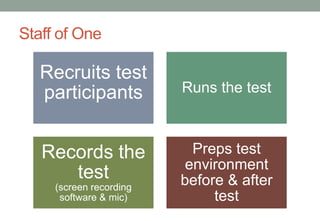
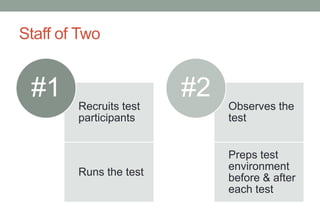
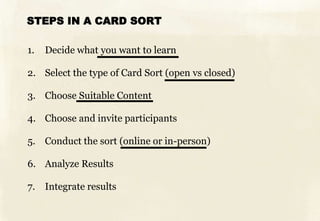
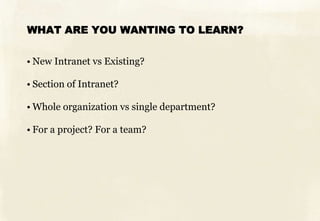
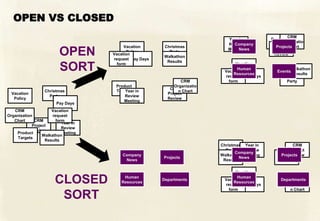
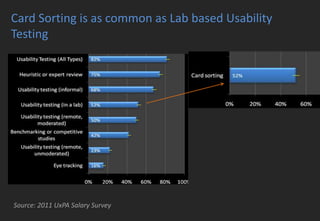
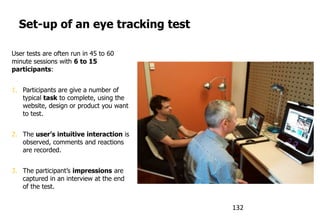
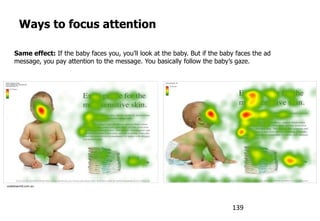
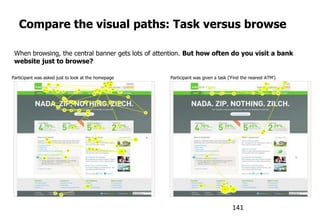
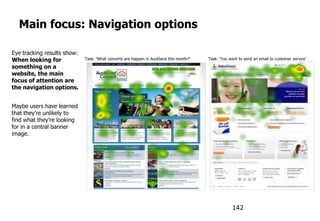
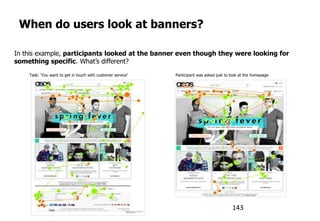
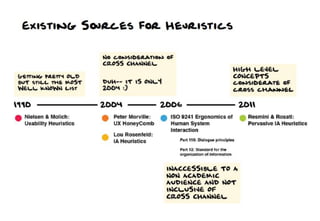
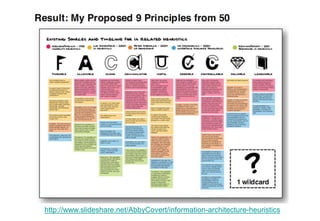
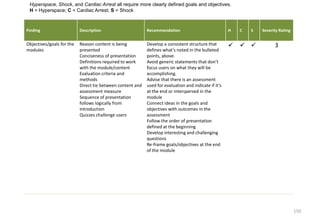
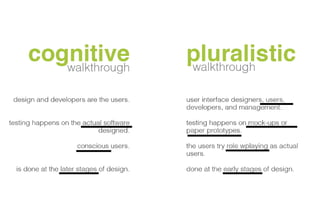
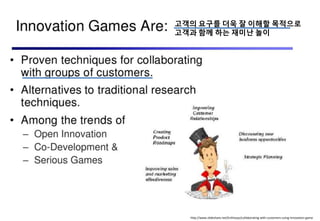
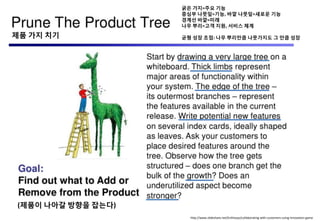
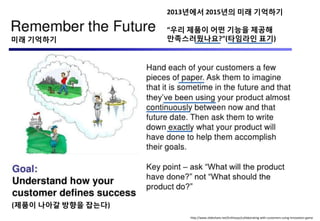
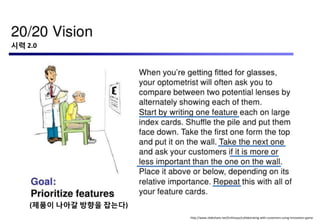
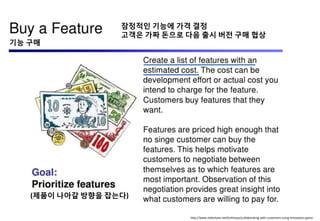
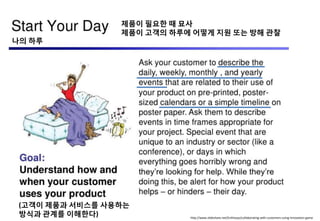
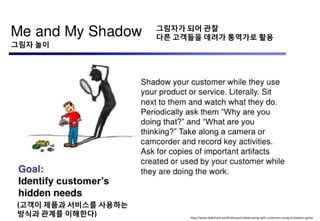
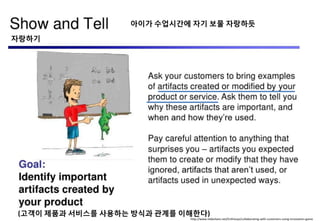
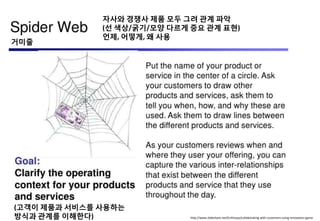
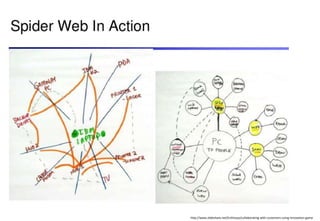
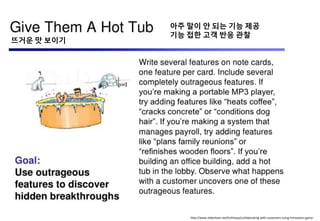
This document provides an overview of UX research methods. It begins with an introduction to big thinking in UX and discusses common biases in customer research such as confirmation bias and framing effect. The document then defines terms like market research, user research, and UX research. It provides examples of case studies and describes various methodologies for conducting UX research like contextual inquiry, diary studies, card sorting, and usability testing. Details are given for each methodology including when to use it, how to conduct it, types of data collected, and example tools. The document concludes with a section on innovation game techniques.
Usability testing (or user testing) involves measuring the ease with which users can complete common tasks on your website. The results of the analysis are a huge eye-opener and their implementation often leads to:
Increased sales and task completion and a high rate of return site visitors
A greatly improved understanding of your customers’ needs
A significant reduction in call centre enquiries
A much more user-focused in-house development team Source: http://www.wbcsoftwarelab.com/wbcblog/read-basics-of-usability-testing
Combination of expert opinion is frequently used to
produce estimates in software projects. However, if,
when and how to combine expert estimates, is poorly
understood. In order to study the effects of a
combination technique called planning poker, the
technique was introduced in a software project for half
of the tasks. The tasks estimated with planning poker
provided: 1) group consensus estimates that were less
optimistic than the mechanical combination of
individual estimates for the same tasks, and 2) group
consensus estimates that were more accurate than the
mechanical combination of individual estimates for the
same tasks. The set of control tasks in the same project,
estimated by individual experts, achieved similar
estimation accuracy as the planning poker tasks.
However, for both planning poker and the control
group, measures of the median estimation bias
indicated that both groups had unbiased estimates, as
the typical estimated task was perfectly on target.
To segment effectively, you need to understand what drives the segments, not just how to measure them. That's where qualitative insight comes in.
Please credit the author if you use the material. Some images are subject to copyright.
Presented by Rob Tannen of the Bresslergroup and Charles Mauro of MauroNewMedia on February 29, 2012 at "Measuring Your User Experience Design." The event was held at the New York Institute of Technology and organized by the New York Technology Council (NYTECH). www.nytech.org
Qualitative Research vs Quantitative Research - a QuestionPro Academic WebinarQuestionPro
Hosted on October 14, 2020, this QuestionPro Academic focused webinar delved into the differences of Qualitative and Quantitative research and how you can achieve this using the QuestionPro research platform. We spoke about Heatmap and Hotspot analysis, card sorting, online focus groups using video discussions and even a beta feature coming soon, LiveCast that uses NLP to build real-time analytics from video survey questions. Our speaker was Dan Fleetwood, the President for Research and Insights at QuestionPro.
Chapter 9: Evaluation techniques
from
Dix, Finlay, Abowd and Beale (2004).
Human-Computer Interaction, third edition.
Prentice Hall. ISBN 0-13-239864-8.
http://www.hcibook.com/e3/
The goal of this presentation is to give attendees a deeper understanding of usability testing so they can leverage it in their own work. The material will shed light on what is important to the research buyer and will help the research provider to better understand how to plan, moderate, and report on a usability study. It will also provide information on where they can go to learn more about this very practical qualitative method.
Kay will cover what a usability test is and when to use it, the key planning steps, the language around it, and the unique insights this method produces. She will also discuss the various approaches a market researcher can take when running a usability study at different points in a product’s development (e.g., concept, early prototype, released product).
UX Burlington 2017: Exploratory Research in UX DesignSarah Fathallah
Presentation given at the 2017 UX Burlington conference, on the topic of "Exploratory Research in UX Design."
Exploratory research focuses on gaining a deep understanding of the lives of the end users and the contexts in which they use certain products and services. At its core, it’s about challenging and exploring the problem space, before venturing into the solution space. Using real-life examples of digital tools that help people access affordable housing or register to vote, this talk will explore the different tools used for exploratory research, including ethnographic interviews, contextual inquiry, and co-creation activities and prompts. This talk will leave the audience with a better understanding of the types of insights that exploratory research generates, and how they can complement the findings of evaluative or comparative research.
Users are Losers! They’ll Like Whatever we Make! and Other Fallacies.Carol Smith
Presented at CodeMash 2013.
If this sounds familiar it is time to make big changes or look for a new job. Failing your users will only end badly. In this session we look at the assumptions that are all-too-often made about users, usability and the User Experience (UX). In response to each of these misguided statements Carol will provide a quick method you can conduct with little or no resources to debunk these myths.
Pitfalls and Countermeasures in Software Quality Measurements and EvaluationsHironori Washizaki
Hironori Washizaki, "Pitfalls and Countermeasures in Software Quality Measurements and Evaluations," 5th International Workshop on Quantitative Approaches to Software Quality (QuASoQ), Keynote, Nanjing, Dec 4, 2017
My presentation given at the Association of Subscription Agents annual conference, Feb 2013.
It was titled Understanding how researchers and practitioners use STM information, but the specific theme was understanding how to design information products and services for researchs and practitioners against a background of information abundance (aka information overload).
Learn how to use prototyping and usability testing as a means to validate proposed functionality and designs before you invest in development. SOMETIMES there is a huge disconnect between the people who make a product and the people who use it. Usability testing is vital to uncovering the areas where these disconnects happen. In this symposium you will learn the steps to conduct a successful usability test. This includes tips and real life examples on how to plan the tests, recruit users, facilitate the sessions, analyze the data, and communicate the results.
Usability Testing Basics: What's it All About? at Web SIG ClevelandCarol Smith
Presented to Web SIG Cleveland on May 21, 2011 at Notre Dame College in South Euclid (Cleveland), Ohio.
Learn all you need to get started:
- Where you can conduct studies (does it have to be in a lab?)
- Types of studies (RITE, think aloud, etc.)
- Tips for recruiting participants
- Tips for Interacting with participants without biasing the study
- Preparing for the study (materials needed, forms, etc.)
- Guidance for analyzing the study
This presentation was provided by Serena Rosenhan of ProQuest, during Session Four of the NISO event "Agile Product and Project Management for Information Products and Services," held on June 4, 2020.
In this Webinar, Stephen Fleming-Prot, Principal UX Researcher, provides techniques to guide you through the sometimes rough waters of customer experience research in 2019. With executives demanding that their teams connect with customers and build empathy for their users, this webinar gives you actionable tactics to help you expand your cross-functional teams’ methods and approaches for research.
You’ll learn:
Guidance on “mapping” out a plan for 2019
Considerations for the “gear” and tools you need for the journey, including balancing quantitative and qualitative approaches to research
New techniques to help you “navigate” your research needs
Research considerations for dealing with new tech
Tips on ensuring everyone is moving in the same direction - towards a better understanding of, and more empathy for customers
용산FM 라디오 방송 with 최병호 교수
I. 최병호 교수 소개: 본인 소개, 주요 기여, 인터뷰
II. 4차산업혁명: 4차산업혁명의 정체는?, 사례, 사회문제해결 도전과제
III. 소셜임팩트 AI 사례: 센시, 수퍼빈, 테스트웍스
IV. 최병호 교수 미래: 위대한 인물 육성 강사, 소셜임팩트 창출 AC, 문해력 해결 전도사, 사람과 자연을 사랑하는 작가
AI 트렌드 통찰로 산업파괴적인 AI BM을 모색해보고, AI 중심의 NEW THINKING으로 인류의 삶을 변화시킬 위대한 리더십을 고찰해본다.
AI 적용 트렌드 통한 산업파괴적인 AI BM 모색
AI 사례 분석으로 새로운 패러다임 창출 전략 탐색
AI 도전
NEW THINKING
소상공인을 위한 오프라인 매장 전략
방역 시스템 전략
블루오션 전략(1): No virus & No wait
마케팅용 퍼소나(PERSONA) 전략
젠트리피케이션 예측 전략
블루오션 전략(2): Noise masking
소상공인 제품을 위한 전략
수요 예측 전략
판로 예측 전략
장인과 예비장인을 위한 제조 지원 전략
소상공인을 위한 금융 지원 전략
소상공인을 위한 지능형 신용평가 및 금융 지원 전략
인공지능(AI)과 사용자 경험(UX)
담론 I. 드라마로 본 AI & UX
담론 II. 도전과제로 본 AI & UX
담론 III. 변방성 질문으로 본 AI & UX
사례연구 #1-1. 지능형 패션 프로파일링 및 UX
사례연구 #1-2. 지능형 패션 추천 시스템 및 UX
사례연구 #2. 지능형 시니어 맞춤 UX
인공지능시대?! 지금, 무슨 일이 벌어지고 있는가? 우리는, 무엇을 질문하고 통찰해야 하는가?Billy Choi
EPISODE #1. 치매환자를 위해서 인공지능은 무엇을 할 수 있을까요?
EPISODE #2. 미래의 집을 위한 지능형 HCI/UX?
EPISODE #3. 시니어를 위해서 지능형 HCI/UX?
EPISODE #4. 패션 장인들을 위해서 인공지능은 무엇을 할 수 있을까요?
SCENARIO #1. 인공지능과 비즈니스모델링
SCENARIO #2. 인공지능과 철학
I. 사회혁신 담론과 게이미피케이션
사회적경제 아파트와 게이미피케이션?
스마트앵커와 게이미피케이션?
지역기반 노인통합돌봄서비스와 게이미피케이션?
사회적경제특구와 게이미피케이션?
사회문제 해결형 혁신형 사업과 게이미피케이션?
II. 행동변화를 유도할 수 있는 HCI/UX 이론과 게이미피케이션
(시니어에게 지속적으로 스마트밴드를 착용하도록 만드는 휴먼 인터랙션의 비밀? )
새로운 것을 시도하게 하려면
내적 동기 유발
지속가능성 시동 – 자동화 시도
지속가능성 본격 진입 – 착수: ‘지속적 강화 계획’
지속가능성 본격 진입 – 단기 가속: ‘고정비율 계획’
지속가능성 유지 – ‘변동비율 계획’
지속가능성 유지 – 중독성 있는 고리 형성
처음 시작은 아주 사소한 것부터 출발
지금까지 논의한 거의 모든 것은 습관의 힘
Story Editing
Book Formatting: Quality Control Checks for DesignersConfidence Ago
This presentation was made to help designers who work in publishing houses or format books for printing ensure quality.
Quality control is vital to every industry. This is why every department in a company need create a method they use in ensuring quality. This, perhaps, will not only improve the quality of products and bring errors to the barest minimum, but take it to a near perfect finish.
It is beyond a moot point that a good book will somewhat be judged by its cover, but the content of the book remains king. No matter how beautiful the cover, if the quality of writing or presentation is off, that will be a reason for readers not to come back to the book or recommend it.
So, this presentation points designers to some important things that may be missed by an editor that they could eventually discover and call the attention of the editor.
Connect Conference 2022: Passive House - Economic and Environmental Solution...TE Studio
Passive House: The Economic and Environmental Solution for Sustainable Real Estate. Lecture by Tim Eian of TE Studio Passive House Design in November 2022 in Minneapolis.
- The Built Environment
- Let's imagine the perfect building
- The Passive House standard
- Why Passive House targets
- Clean Energy Plans?!
- How does Passive House compare and fit in?
- The business case for Passive House real estate
- Tools to quantify the value of Passive House
- What can I do?
- Resources
Expert Accessory Dwelling Unit (ADU) Drafting ServicesResDraft
Whether you’re looking to create a guest house, a rental unit, or a private retreat, our experienced team will design a space that complements your existing home and maximizes your investment. We provide personalized, comprehensive expert accessory dwelling unit (ADU)drafting solutions tailored to your needs, ensuring a seamless process from concept to completion.
Storytelling For The Web: Integrate Storytelling in your Design ProcessChiara Aliotta
In this slides I explain how I have used storytelling techniques to elevate websites and brands and create memorable user experiences. You can discover practical tips as I showcase the elements of good storytelling and its applied to some examples of diverse brands/projects..
Transforming Brand Perception and Boosting Profitabilityaaryangarg12
In today's digital era, the dynamics of brand perception, consumer behavior, and profitability have been profoundly reshaped by the synergy of branding, social media, and website design. This research paper investigates the transformative power of these elements in influencing how individuals perceive brands and products and how this transformation can be harnessed to drive sales and profitability for businesses.
Through an exploration of brand psychology and consumer behavior, this study sheds light on the intricate ways in which effective branding strategies, strategic social media engagement, and user-centric website design contribute to altering consumers' perceptions. We delve into the principles that underlie successful brand transformations, examining how visual identity, messaging, and storytelling can captivate and resonate with target audiences.
Methodologically, this research employs a comprehensive approach, combining qualitative and quantitative analyses. Real-world case studies illustrate the impact of branding, social media campaigns, and website redesigns on consumer perception, sales figures, and profitability. We assess the various metrics, including brand awareness, customer engagement, conversion rates, and revenue growth, to measure the effectiveness of these strategies.
The results underscore the pivotal role of cohesive branding, social media influence, and website usability in shaping positive brand perceptions, influencing consumer decisions, and ultimately bolstering sales and profitability. This paper provides actionable insights and strategic recommendations for businesses seeking to leverage branding, social media, and website design as potent tools to enhance their market position and financial success.
7. 4 Common Biases
in Customer Research
• Confirmation Bias
• Framing Effect
• Observer-expectancy Effect
• Recency Bias
8. Confirmation Bias
Your tendency to search for or interpret
information in a way that confirms your
preconceptions or hypotheses.
9. Framing Effect
When you and your team draw different
conclusions from the same data based on your
own preconceptions.
10. Observer-expectancy
When you expect a given result from your
research which makes you unconsciously
manipulate your experiments to give you that
result
11. Recency Bias
This results from disproportionate salience
attributed to recent observations (your very last
interview) – or the tendency to weigh more
recent information over earlier observations
38. You need to gather:
• Factual information
• Behavior
• Pain points
• Goals
You can document this on the persona validation board
As well as…
Photos, video, audio, journals…document everything
49. 48
Methodology: Contextual Observation/Ethnography
► Business problem
► How are people actually using products versus how they were designed?
► Description
► In-depth, in-person observation of tasks & activities at work or home. Observations
are recorded.
► Benefits
► Access to the full dimensions of the user experience (e.g. information flow,
physical environment, social interactions, interruptions, etc)
► Limitations
► Time-consuming research; travel involved, Smaller sample size does not provide
statistical significance, Data analysis can be time consuming
► Data
► Patterns of observed behavior and verbatims based on participant response,
transcripts and video recordings
► Tools
► LiveScribe (for combining audio recording with note-taking)
Cost / respondent: Low – Moderate – High
Statistical validity: None – Some – Extensive
50.
51.
52.
53. 52
Methodology: Remote Ethnography
► Business problem
► How are people actually using in their environment in real-time?
► Description
► Participants self-record activities over days or weeks with pocket video cameras or
mobile devices, based on tasks provided by researcher.
► Benefits
► Allows participants to capture activities as they happen and where they happen
(away from computer), without the presence of observers. Useful for longitudinal
research & geographically spread participants.
► Limitations
► Dependence on participant ability to articulate and record activities, Relatively high
data analysis to small sample size ratio
► Data
► Patterns based on participant response, transcripts and video recordings
► Tools
► Qualvu.com
Cost / respondent: Low – Moderate – High
Statistical validity: None – Some – Extensive
54. 53
Methodology: Large-Sample Online Behavior Tracking
► Business problem
► Major redesign of a large complex site that is business-critical?
► Description
► 200-10,000+ respondents do tasks using online tracking / survey tools
► Benefits:
► Large sample size, low cost per respondent, extensive data possible
► Limitations
► No direct observation of users, survey design complex…other issues
► Data
► You name it (data exports to professional analysis tools).
► Tools of Choice
► Keynote WebEffective, UserZoom,
Cost / respondent: Low – Moderate – High
Statistical validity: None – Some – Extensive
55. 54
Methodology: Lab-based UX Testing
► Business problem
► Are there show-stopper (CI) usability problems with your user experience?
► Description
► 12-24 Respondents undertake structured tasks in controlled setting (Lab)
► Benefits
► Relatively fast, moderate cost, very graphic display of major issues
► Limitations
► Small sample, study design, recruiting good respondents
► Data
► Summary data in tabular and chart format PLUS video out-takes
► Tools
► Leased testing room, recruiting service and Morae (Industry Standard)
Cost / respondent: Low – Moderate – High
Statistical validity: None – Some – Extensive
56.
57. 56
Methodology: Eye-Tracking
Business Problem
Do users see critical content and in what order?
Description
Respondents view content on a specialized workstation or glasses.
Benefits
Very accurate tracking of eye fixations and pathways.
Limitations
Relatively high cost, analysis is complex, data can be deceiving.
Data
Live eye fixations, heat maps…etc.
Tools of Choice
Tobii - SMI
Cost / respondent: Low – Moderate – High
Statistical validity: None – Some – Extensive
58. 57
Methodology: Automated Online Card Sorting
► Business problem
► User’s cannot understand where content they want is located?
► Description
► Online card sorting based on terms you provide (or users create)
► Benefits
► Large sample size, low cost, easy to field
► Limitations
► Use of sorting tools confuse users, data hard to understand
► Data
► Standard cluster analysis charts and more
► Tools of Choice
► WebSort…and others
Cost / respondent: Low – Moderate – High
Statistical validity: None – Some – Extensive
59. 58
Methodology: fMRI (Brain Imaging)
► Business Problem?
► What areas of the brain are being activated by UX design
► Description
► Respondents given visual stimulus while in FMRI scanner
► Benefits
► Maps design variables to core functions of the human brain
► Limitations
► Expensive and data can be highly misleading
► Data
► Brain scans
► Tools
► Major medical centers and research services (some consultants)
Cost / respondent: Low – Moderate – High
Statistical validity: None – Some – Extensive
60. 59
Methodology: Professional Heuristics
► Business problem
► Rapid feedback on UX design based on best practices or opinions
► Definition
► “Heuristic is a simple procedure that helps find adequate, though often imperfect,
answers to difficult questions (same root as: eureka)”
► Benefits
► Fast, low cost, can be very effective in some applications
► Limitations
► No actual user data, analysis only as good as expert doing audit
► Data
► Ranging from verbal direction to highly detailed recommendations
► Tools of Choice
► Written or verbal descriptions and custom tools by each experts.
Cost / respondent: NA
Statistical validity: None – Some – Extensive
61. 60
Methodology: Focus Groups
► Business problem
► What are perceptions and ideas around products/concepts?
► Description
► Moderated discussion group to gain concept/product feedback and inputs; can
include screens, physical models and other artifacts
► Benefits
► Efficient method for understanding end-user preferences and for getting early
feedback on concepts , particularly for physical or complex products that benefit
from hands-on exposure and explanation
► Limitations
► Lacks realistic context of use; Influence of participants on each other
► Data
► Combination of qualitative observations (like ethnographic research) with
quantitative data (e.g. ratings, surveys)
► Tools
► See qualitative data analysis
Cost / respondent: Low – Moderate – High
Statistical validity: None – Some – Extensive
62. A / B Testing
What
A testing procedure in which two (or
more) different designs are evaluated in
order to see which one is the most
effective. Alternate designs are served to
different users on the live website.
Why
Can be valuable in refining elements on a
web page. Altering the size, placement, or
color of a single element, or the wording
of a single phrase can have dramatic
effects. A / B Testing measures the results
of these changes.
Resources
A/B testing is covered in depth in the book
Always Be Testing: The Complete Guide to
Google Website Optimizer by Bryan
Eisenberg and John Quarto-von Tivadar.
http://www.testingtoolbox.com/
You can also check out the free A/B
testing tool Google Optimizer.
https://www.google.com/analytics/siteopt/pr
eview
A / B Testing
http://www.flickr.com/photos/danielwaisberg/
63. Kano Analysis
What
Survey method that determines
how people value features and
attributes in a known product
domain. Shows what features are
basic must-haves, which features
create user satisfaction, and which
features delight.
Why
Allows quantitative analysis of
feature priority to guide
development efforts and
specifications. Ensures that
organization understands what is
valued by users. Less effective for
new product categories
Kano Analysis
64. Six Thinking Hats
What
A tactic that helps you look at decisions
from a number of different perspectives.
The white hat focuses on data; the red on
emotion; the black on caution; the yellow
on optimism; the green on creativity; and
the blue on process.
Why
Can enable better decisions by
encouraging individuals or teams to
abandon old habits and think in new or
unfamiliar ways. Can provide insight into
the full complexity of a decision, and
highlight issues or opportunities which
might otherwise go unnoticed.
Resources
Lateral thinking pioneer Edward de Bono
created the Six Thinking Hats method.
http://www.edwdebono.com/
An explination from Mind Tools.
http://www.mindtools.com/pages/article/
newTED_07.htm
Six Thinking Hats
http://www.flickr.com/photos/daijihirata/
68. What is Ethnography?
• Defined as:
– a method of observing human interactions in social
settings and activities (Burke & Kirk, 2001)
– as the observation of people in their ‘cultural context’
– the study and systematic recording of human cultures;
also : a descriptive work produced from such research
(Merriam-Webster Online)
• Rather than studying people from the outside, you
learn from people from the inside
69. (Anderson, 1997; Malinowski, 1
967; 1987; Kuper 1983)
Who Invented Ethnography?
• Invented by Bronislaw Malinowski in 1915
– Spent three years on the Trobriand Islands (New
Guinea)
– Invented the modern form of fieldwork and
ethnography as its analytic component
70. (Salvador & Mateas, 1997)
Traditional VS Design Ethnography
Traditional
• Describes cultures
• Uses local language
• Objective
• Compare general
principles of society
• Non-interference
• Duration: Several Years
Design
• Describes domains
• Uses local language
• Subjective
• Compare general
principles of design
• Intervention
• Duration: Several
Weeks/Months
71. Contextual inquiry is a field data-gathering technique
that studies a few carefully selected individuals in
depth to arrive at a fuller understanding of the work
practice across all customers.
Through inquiry and interpretation, it reveals
commonalities across a product’s customer base.
What is contextual inquiry?
~ Beyer & Holtzblatt
72. Contextual Inquiry:
When to do it
Every ideation and design cycle should start with a
contextual inquiry into the full experience of a customer and
his/her.
Contextual inquiry clarifies and focuses the problems a
customer is experiencing by discovering the
• Precise situation in which the problems occur.
• What the problem entails.
• How customers go about solving them.
73. What is your focus?
Who is your audience?
Recruit & schedule participants
Learn what your users do
Develop scenarios
Conduct the inquiry
Interpret the results
Evangelize the findings
Rinse, repeat (at least monthly)
Contextual Inquiry:
How to do it
74. (Nielsen, 2002)
Dos & Don’ts
Don’t
• Ask simple Yes/No
questions
• Ask leading questions
• Use unfamiliar jargon
• Lead/guide the ‘user’
Do
• Ask open-ended questions
• Phrase questions properly
to avoid bias
• Speak their language
• Let user notice things on
his/her own
75. Analyzing
the results
“The output from customer research is not a
neat hierarchy; rather, it is narratives of
successes and breakdowns, examples of use
that entail context, and messy use artifacts”
Dave Hendry
74
76. Research Analysis
What are people’s values?
People are driven by their social and cultural contexts as much as their rational
decision making processes.
What are the mental models people build?
When the operation of a process isn’t apparent, people create their own models of
it
What are the tools people use?
It is important to know what tools people use since you are building new tools to
replace the current ones.
What terminology do people use to describe what they do?
Words reveal aspects of people’s mental models and thought processes
What methods do people use?
Flow is work is crucial to understanding what people’s needs are and where
existing tools are failing them.
What are people’s goals?
Understanding why people perform certain actions reveals an underlying
structure of their work that they may not be aware of themselves.
77. Affinity
Diagrams
“People from different teams engaged in affinity
diagramming is as valuable as tequila shots and
karaoke. Everyone develops a shared
understanding of customer needs, without the
hangover or walk of shame”
76
78. Research Analysis: Affinity Diagrams
Creates a hierarchy of all observations, clustering them
into themes.
From the video observations, 50-100 singular
observations are written on post-its
(observations ranging from tools, sequences, interactions,
work-arounds, mental models, etc)
With entire team, notes are categorized by relations into
themes and trends.
83. Users record thoughts,
comments, etc. over time
http://www.flickr.com/photos/vanessabertozzi/877910821
http://www.flickr.com/photos/yourdon/3599753183/
http://www.flickr.com/photos/stevendepolo/3020452399/
http://www.flickr.com/photos/jevnin/390234217/
Interview users
Gather feedback, data
Organise and analyse
(affinity maps, analytics)
84. Participants keep a record of
“When” data
Date & time
Duration
Activity / task
“What" data
Activity / task
Feelings / mood
Environment / setting
85. No one right way to collect data
Structured
Yes/no
Select a category
Date & time
Multiple choice
Unstructured
Open-ended
Opinions / thoughts / feelings
Notes / comments
Combine / mix & match
http://www.flickr.com/photos/roboppy/9625780/
http://www.flickr.com/photos/vanessabertozzi/877910821
86.
87. “Hygiene” aspects
At the beginning
•Introduction / get-to-know-you
•Demographics & psychographics, profiling
•Instructions / Setting expectations
At the end
•Follow-up
•Thanks / token gift
•Reflection
100. Usability Tests
Start new test
Identify 3-5
tasks to test
Observe test
participants
performing
tasks
Identify the 2-3
easiest things to
fix
Make changes
to site
101. Identify Tasks for the Test
Known
problem
areas
Most
common
activities
Popular
pages
New
pages or
services
104. Staff of One
Recruits test
participants Runs the test
Records the
test
(screen recording
software & mic)
Preps test
environment
before & after
test
105. Staff of Two
Recruits test
participants
Runs the test
#1
Observes the
test
Preps test
environment
before & after
each test
#2
108. New technologies and
techniques allow for
Remote:
– Moderated testing
– Unmoderated testing
– Observation
Irrelevance of
Place
109. Remote Moderated Testing
Products like GotoMeeting allow connections
to the test (or observation) computer to the
Internet. VoIP can carry voice cheaply.
LiveMeeting
WebEx
GoToMeeting
For screen VoIP Audio
Skype
GoogleTalk
Translator
Moderator
Participant
Observers
110. Remote Unmoderated Testing
‘Task-based’ Surveys
> Online/remote Usability Studies
(unmoderated)
> Benchmarking (competitive /comparison)
> UX Dash`boards (measure ROI)
Online Card Sorting
> Open or closed
> Stand alone or
> Integrated with task-based
studies & surveys
Online Surveys
> Ad hoc research
> Voice of Customer studies
> Integrated with Web Analytics data
User Recruiting Tool
> Intercept real visitors (tab or layer)
> Create your own private panel
> Use a panel provider*
Robust Set of Services
111. 110
• Saves time
o Lab study takes 2-4 weeks from start to finish, unmoderated typically takes hours to
a few days*
• Saves money
o Participants compensation typically a lot less ($10 vs. $100)
o Tools are becoming very inexpensive
• Reliable metrics
o Only (reasonable) way to collect UX data from large sample sizes
• Geography is not a limitation
o Collect feedback from customers all over the world
• Greater Customer insight
o Richest dataset about the customer experience
Why Should You Care?
112. 111
Common Research Questions:
• What are the usability issues, and how big?
• Which design is better, and by how much?
• How do customer segments differ?
• What are user design preferences?
• Is the new design better than the old design?
• Where are users most likely to abandon a transaction?
Types of Studies:
• Comprehensive evaluation
• UX benchmark
• Competitive evaluation
• Live site vs. prototype comparison
• Feature/function test
• Discovery
Overview
Typical Metrics:
• Task success
• Task time
• Self-report ratings such as ease of use,
confidence, satisfaction
• Click paths
• Abandonment
121. STEPS IN A CARD SORT
1. Decide what you want to learn
2. Select the type of Card Sort (open vs closed)
3. Choose Suitable Content
4. Choose and invite participants
5. Conduct the sort (online or in-person)
6. Analyze Results
7. Integrate results
122. WHAT ARE YOU WANTING TO LEARN?
• New Intranet vs Existing?
• Section of Intranet?
• Whole organization vs single department?
• For a project? For a team?
123. Product
Targets
CRM
Project
Review
CRM
Organizatio
n Chart
Christmas
Party
Walkathon
Results
Year in
Review
Meeting
Vacation
Policy
Pay Days
Vacation
request
form
Year in
Review
Meeting
Product
TargetsCRM
Project
Review
CRM
Organizatio
n Chart
Christmas
Party
Walkathon
Results
Vacation
Policy
Pay Days
Vacation
request
form
OPEN VS CLOSED
Vacation
Policy
Christmas
Party
CRM
Project
Review
CRM
Organization
Chart
Product
Targets
Year in
Review
Meeting
Pay Days
Walkathon
Results
Vacation
request
form
Vacation
Policy
Christmas
Party
CRM
Project
Review
CRM
Organizatio
n Chart
Product
TargetsYear in
Review
Meeting
Pay Days
Walkathon
Results
Vacation
request
form
Company
News
Departments
Human
Resources
Projects
Company
News
Events
Human
Resources
Projects
Company
News
Departments
Human
Resources
Projects
OPEN
SORT
CLOSED
SORT
124. SELECTING CONTENT
Do’s
•30 – 100 Cards
•Select content that can be
grouped
•Select terms and concepts
that mean something to
users
Don’ts
• More than 100 cards
• Mix functionality and
content
• Include both detailed and
broad content
126. LOOK AT
• What groups were created
• Where the cards were placed
• What terms were used for labels
• Organization scheme used
• Whether people created accurate or inaccurate groups
127. INTEGRATE RESULTS: CREATE YOUR IA
Our Company
Executive Blog
New York
Vancouver
Mission and Values
Projects
Project Name 1
Project Name 2
Project Name 3
Project Name 4
Departments
Executive
Operations
Operations Support
Vessel Planning
Yard Planning
Rail Planning
Finance &
Administration
Human Resources
Corporate
Communications
IT
Community &
Groups
Events
Charitable Campaigns
Vancouver Carpool
Employee
Resources
Vacation & Holidays
Expenses
Travel
Health & Safety
Wellness
Benefits
Facilities
Payroll
Communication Tools
Centers of
Excellence
Project Management
Professionals
Engineering
Terminal Technologies
NAVIS
Lawson
IT
Yard Planning
130. Card Sorting is as common as Lab based Usability
Testing
Source: 2011 UxPA Salary Survey
131. Terms & Concepts
• Open Sort: Users sort items into groups and give the
groups a name.
Closed Sort: Users sort items into previously defined
category names.
• Reverse Card Sort (Tree Test) : Users are asked to locate
items in a hierarchy (no design)
• Most Users Start Browsing vs Searching: Across 9
websites and 25 tasks we found on average 86% start
browsing
http://www.measuringusability.com/blog/card-sorting.php
http://www.measuringusability.com/blog/search-browse.php
133. Set-up of an eye tracking test
User tests are often run in 45 to 60
minute sessions with 6 to 15
participants:
1. Participants are give a number of
typical task to complete, using the
website, design or product you want
to test.
2. The user’s intuitive interaction is
observed, comments and reactions
are recorded.
3. The participant‟s impressions are
captured in an interview at the end
of the test.
132
134. Eye tracking results: Heatmaps
Heatmaps show what participants
focus on.
In this example, „hot spots‟ are the
picture of the shoes, the central entry
field and the two right-hand tiles
underneath.
The data of all participants is
averaged in this map.
133
135. Eye tracking results: Gazeplot
Gaze plots show the „visual path‟ of
individual participants. Each bubble
represents a fixation.
The bubble size denotes the length
or intensity of the fixation.
Additional results are available in
table format for more detailed
analysis.
134
136. The key visual and a box at the bottom
Note: Telstra Clear have since re-designed their homepage.
The key
visual got
lots of
attention.
Surprising: This box got
heaps of attention. It
reads:
“If you are having trouble
getting through to us on
the phone, please click
here to email us, we‟ll get
back to you within 2
business days”.
Participants got the
impression that Telstra Clear
has trouble with their
customer service.
The main
navigation and
its options got
almost no
attention.
135
137. The Face effect – an example
bunnyfoot
Yep, there’s
attention on
certain… areas, … the face,
however, is the
strongest point
of focus!
136
138. Using the Face effect
humanfactors.com
Eye tracking results for ad Version
A:
We see a face effect: The model‟s face
draws a lot of attention.
The slogan is the other hot spot of the
design. Participants will likely have read
it.
The product and its name get some,
but not a lot of attention.
137
139. Using the Face effect
Eye tracking results for ad Version
B:
Again, we see a strong face effect. BUT:
In this version, the models gaze is in line
with the product and its name.
The product image and name get
considerably more attention!
Additionally, even the product name at
the bottom is noticed by a number of
participants.
humanfactors.com 138
140. Ways to focus attention
usableworld.com.au
Same effect: If the baby faces you, you‟ll look at the baby. But if the baby faces the ad
message, you pay attention to the message. You basically follow the baby‟s gaze.
139
141. Banner blindness
… or are they?
In this test, participants were
given a task: Find the nearest
ATM.
Participants focused on the
main navigation and the
footer navigation– this is
where they found the „ATM
locator‟.
So, when visiting a site with a
task in mind – as you
normally do – the central
banner can be ignored!
140
142. Compare the visual paths: Task versus browse
When browsing, the central banner gets lots of attention. But how often do you visit a bank
website just to browse?
Participant was asked just to look at the homepage Participant was given a task („Find the nearest ATM‟)
141
143. Main focus: Navigation options
Eye tracking results show:
When looking for
something on a
website, the main
focus of attention are
the navigation options.
Maybe users have learned
that they‟re unlikely to
find what they‟re looking
for in a central banner
image.
Task: „What concerts are happen in Auckland this month?‟ Task: „You want to send an email to customer service‟
142
144. Task: „You want to get in touch with customer service‟
When do users look at banners?
In this example, participants looked at the banner even though they were looking for
something specific. What‟s different?
Participant was asked just to look at the homepage
143
147. 1. Visibility of system status
2. Match between system and real world
3. User control and freedom
4. Consistency and standards
5. Error prevention
6. Recognition rather than recall
7. Flexibility and efficiency of use
8. Aesthetic and minimalist design
9. Help users recognize, diagnose, and recover from errors
10. Help and documentation
J. Nielsen and R. Mack, eds. Usability Inspection Methods, 1994
Nielsen’s 10 heuristics
Slide 146
149. HE output
Slide 148
• A list of usability problems
• Tied to a heuristic or rule of practice
• A ranking of findings by severity
• Recommendations for fixing problems
• Oh, and the positive findings, too
151. 150
Objectives/goals for
the modules
Reason content is being
presented
Conciseness of presentation
Definitions required to work
with the module/content
Evaluation criteria and
methods
Direct tie between content
and assessment measure
Sequence of presentation
follows logically from
introduction
Quizzes challenge users
Develop a consistent structure that
defines what’s noted in the
bulleted points, above.
Avoid generic statements that
don’t focus users on what they will
be accomplishing.
Advise that there is an assessment
used for evaluation and indicate if
it’s at the end or interspersed in
the module
Connect ideas in the goals and
objectives with outcomes in the
assessment
Follow the order of presentation
defined at the beginning
Develop interesting and
challenging questions
Re-frame goals/objectives at the
end of the module
3
Finding Description Recommendation H C S Severity Rating
Objectives/goals for the
modules
Reason content is being
presented
Conciseness of presentation
Definitions required to work
with the module/content
Evaluation criteria and
methods
Direct tie between content and
assessment measure
Sequence of presentation
follows logically from
introduction
Quizzes challenge users
Develop a consistent structure that
defines what’s noted in the bulleted
points, above.
Avoid generic statements that don’t
focus users on what they will be
accomplishing.
Advise that there is an assessment
used for evaluation and indicate if it’s
at the end or interspersed in the
module
Connect ideas in the goals and
objectives with outcomes in the
assessment
Follow the order of presentation
defined at the beginning
Develop interesting and challenging
questions
Re-frame goals/objectives at the end
of the module
3
Hyperspace, Shock, and Cardiac Arrest all require more clearly defined goals and objectives.
H = Hyperspace; C = Cardiac Arrest; S = Shock
Business question: Is anyone working on a major (large-scale) site launch or redesign that your company depends on for survival?
Audience question: “How many of you have a project at the point where it is ready for major commitment? (round A, new release, major new upgrade) I have a web site, software or product and I am about to commit major funding or resources to next phase of developmentDo I have usability problems with the user experience that are basically show stoppers Users cannot download the application Users cannot log in Users cannot set up a profile pageUsers cannot navigate to critical content 1-3 critical tasks in 60 min.
Business question: How are users actually viewing your content (in what order, for how long and in what specific pattern or pathways)?Audience question: Have you wondered if critical links, buttons or content messaging is being viewed on a critical page?Description: this methodology is very useful when trying to determine why certain homepage metrics from analytics programs are of concern (not clicking on value proposition element…etc.)The respondent sits at a specialized computer screen and undergoes a simple calibration sequence. Respondent is given a stimulus question or task (active or passive) (show homepage for set period of time 15 seconds)System tracks eye pathways and fixations and produces a data file from that task.Important things to know about eye-tracking Tobii not designed for web sites or changing visual stimulus)This makes actual testing of web navigation (changing from page to page) very complex to actually analyze and not accurateVery effective for single stimulus presentations of fixed durationsExcellent for detailed analysis of home pages or critical landing pages and forms Very insightful for assessing impact of advertizing on homepage visual scanning.
Business problem: How do I organize information like content, navigation, overall IA so that users understand it?Description: this is an automated version of the classic card sorting studies where you give users a pile of index cards with your content descriptions on them and ask them to sort the cards into groups according to how they relate to the content. Example: If I have a bunch of content categories how do I determine what the groupings are and the high level navigation labels? Lets say you have a site selling women’s underwear and you what to create a navigation structure that matches the users mental model. So do you organize the site by type of underwear on top level and styles, colors, or do you organize the site navigation by life style like (athletic, everyday, intimate) and they by type of article color, and price. Respondents are invited to an online study via email.When they agree they encounter a screen with a list of labels or terms in one column and are asked to sort the terms into groups they find organizationally relevant. When they are finished you can give them another card sort of just finish the study. When the required number of respondents are finished with the card sort you can view the dataCard sorting data is analyzed through the application of cluster analysis (not that easy to understand but very useful)
Business question: Do any of you have new development team that has minimal UX / Usability experience? Is your team employing best practices and are they aware of the key UX and Usability performance issues that an effective solution must meet.Description: A highly experienced usability / UI design expert conducts a structured audit of your system or product and rates the system on best practices and estimated performanceInterview and select an expert who has direct experience in your product category and sectorExpert gathers information from your development team and conducts structured audit based on predetermined best practices. Expert presents findings to your team (sometimes not a happy experience for UX design teams without knowledge of formal UCD methods.Very effective early in development and can be repeated with updates at less cost.
Pattern Name : A/B TestingClassification: Continuous ImprovementIntent: Can be valuable in refining elements on a web page. Altering the size, placement, or color of a single element, or the wording of a single phrase can have dramatic effects. A / B Testing measures the results of these changes. Also Known As:Other names for the pattern.Motivation (Forces):A scenario consisting of a problem and a context in which this pattern can be used.Applicability:Situations in which this pattern is usable; the context for the pattern.Structure:A graphical representation of the pattern. Class diagrams and Interaction diagrams may be used for this purpose.Participants:A listing of the classes and objects used in the pattern and their roles in the design.Collaboration:A description of how classes and objects used in the pattern interact with each other.Consequences:A description of the results, side effects, and trade offs caused by using the pattern.Implementation:A description of an implementation of the pattern; the solution part of the pattern.Sample Code:An illustration of how the pattern can be used in a programming languageKnown Uses:Examples of real usages of the pattern.Related Patterns:Other patterns that have some relationship with the pattern; discussion of the differences between the pattern and similar patterns.
Pattern Name : Kano AnalysisClassification: Business Requirements ManagementIntent: Allows quantitative analysis of feature priority to guide development efforts and specifications. Ensures that organization understands what is valued by users. Less effective for new product categories.Also Known As: Kano ModelMotivation (Forces): You have a need to categorize features by basic must-haves, which features create user satisfaction, and which features delight. Applicability: You have a list of business requirements, however you know that in the current phase of the project, you will not be able to get everything done. You are going to use a Cycle methodology, and you need to know which features the users will want as basic must have’s, which features will excite them, and which are low impact features. In any given release, you will want to include at least one delightful / exciting features. Additionally on your first release you will probably want to include as many basic / must have features. Use Kano Analysis to identify which features are which.Structure:A graphical representation of the pattern. Class diagrams and Interaction diagrams may be used for this purpose.Participants: Potential Users, SurveyorCollaboration:A description of how classes and objects used in the pattern interact with each other.Consequences: This tool tells you about user perceptions. Remember this limitation, you might want to measure something else. Implementation: Survey method that determines how people value features and attributes in a known product domain. Shows what features are basic must-haves, which features create user satisfaction, and which features delight.Sample Code:An illustration of how the pattern can be used in a programming languageKnown Uses:Examples of real usages of the pattern.Related Patterns:Other patterns that have some relationship with the pattern; discussion of the differences between the pattern and similar patterns.
Pattern Name : Six Thinking HatsClassification: Business Requirements ManagementIntent: Can enable better decisions by encouraging individuals or teams to abandon old habits and think in new or unfamiliar ways. Can provide insight into the full complexity of a decision, and highlight issues or opportunities which might otherwise go unnoticed.Also Known As:Other names for the pattern.Motivation (Forces):A scenario consisting of a problem and a context in which this pattern can be used.Applicability:Situations in which this pattern is usable; the context for the pattern.Structure:A graphical representation of the pattern. Class diagrams and Interaction diagrams may be used for this purpose.Participants:A listing of the classes and objects used in the pattern and their roles in the design.Collaboration:A description of how classes and objects used in the pattern interact with each other.Consequences:A description of the results, side effects, and trade offs caused by using the pattern.Implementation:A description of an implementation of the pattern; the solution part of the pattern.Sample Code:An illustration of how the pattern can be used in a programming languageKnown Uses:Examples of real usages of the pattern.Related Patterns:Other patterns that have some relationship with the pattern; discussion of the differences between the pattern and similar patterns.
Note: give an example here
Usability tests are really not such a big deal. Here’s a quick overview of the steps:Come up with a set of 3-5 different tasks that you’ll ask users to perform.Round up some 5-10 volunteers who will act as test participants and then bring them one at a time into a testing area where you’ll observe them as they perform the predetermined tasks.After you’ve observed all the test partipants, you’ll have a pretty good idea of some things that need to be fixed and what things seems to be working OK. After you make the easiest 2-3 fixes, go back and do another round of testing and tweaking, etc.
OK, so you now have an idea about what service or resource you’re going to test, next you’ll want to think about what actual tasks you want your test participants to do. You’lll want to pick pick tasks that are going to reveal some useful information to you.One obvious place to go looking for tasks are those pages or services that you and your colleagues already know need work, such as your interlibrary loan form or the way that library hours are displayed.Another strategy is to think about what are the most common activities among patrons in your library. Take a look at your site statistics to see what are the most popular pages. Maybe that’s where you want to do your testing.Or maybe you’re about to launch a new page or service. Those are great opportunities for testing.
OK. So the gear you need is not too complicated. You’ll need a computer….a desktop or a laptop will do. Last year, I had test participants use my smarthphone wen I was testing a mobile web site. If you really want to get serious about user-centered design, you may want to do usability testing on paper sketches that precede any actual website coding. This is perfect acceptable and commonly done. It’s a great way to run tests that will help you get a basic page layout and site architecture problems.You’ll also want to install some screen recording software on the computer that your test participants use. That way, you can capture as a movie all the mouse movements, page clicks, and characters typed; this is really rich data to return to when the tests are done and you are trying to write up your report. I’ll talk in a minute about software options.Another option that has worked for me is to simply have a second person on hand helping you with the test. That person’s sole responsibility is to closely observe the test participant and take detailed notes.Finally, if you have screen recording software, you might as well get a USB microphone that can capture the conversation between the test participant and the test facilitator. You’ll want to encourage the participant to think aloud as much as possible as they perform tasks.
Here are five options for screen recording software. I’ve used CamStudio a lot mostly because it is free and can be installed on any machine. With the others, you’ll get a much richer feature set but will limited by the number of machines you can install it on.
OK, so if you are doing the tests all by your lonesome (not the best situation but certainly still doable), you’ll be in charge of recruiting test participants, running the test, recording the test (you’ll definitely need screen recording software and a mic), and for prepping the test environment.
If you can get another person to help you out with the testing, you can break up the tasks in rational ways.
It’s essential that you ask the participant to speak aloud so you can hear them express any frustrations or surprises they’ve had.
Saves time – Very fast, thousands on panels, Money – essence of quick and dirty. Techniques for dealing with noise, unrealistic to be in the lab that long. Combines both qual/quant and attitudes and behavior.
All the flexibility you need to set up a study and analyzing the dataSignificant support in designing study and analysis. Pricing is all project based – typically very expensive – good choice for a large benchmark study
- Sort into groups
OPEN SORT: good for getting ideas on groups of contentCLOSED: Useful to see where people would put the content.
Card sorting as a method in HCI largely took off during the internet boom of the late 1990’s with the proliferation of website navigation.
Today it’s one of the most popular methods UX professionals use. In fact, practitioners report using Card Sorting as frequently as task oriented lab-based usability testing.
This effect can be used to direct attention, for example on an ad. Here two different versions of an ad were eye-tracked. In this case, the model is looking directly at the viewer.
And in this version, the model looks at the product, forming a straight line between her eye and the product name on the package.
Using the cards post-task or post-test.Participant walks table, chooses. Returns to discuss meaning. Log comments for later analysis.