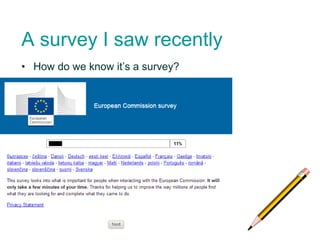
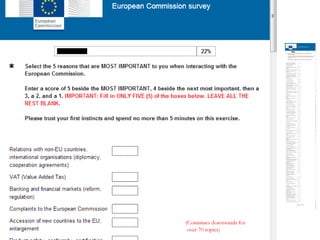
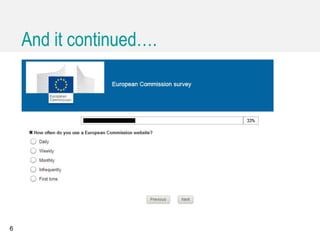
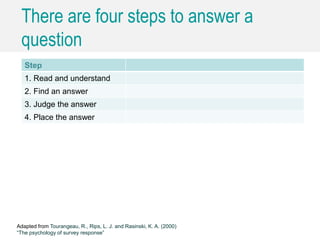
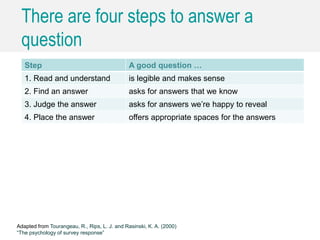
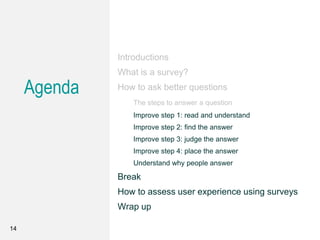
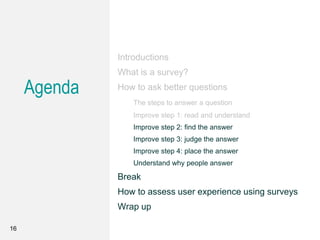
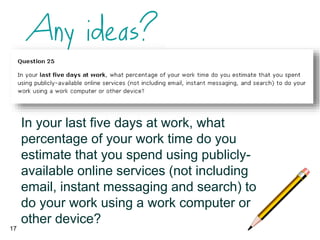
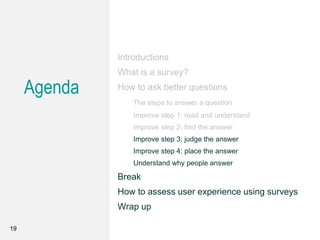
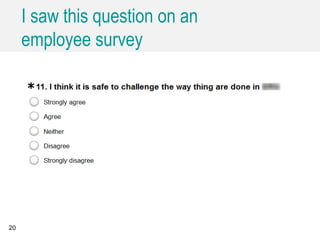
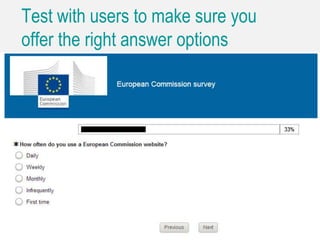
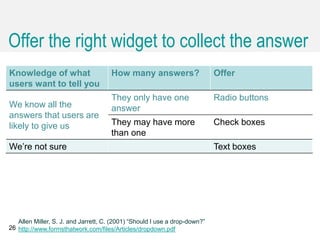
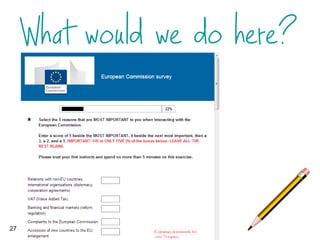
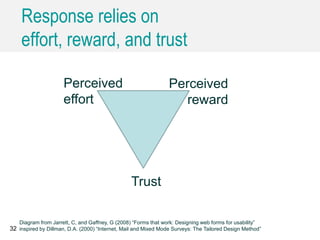
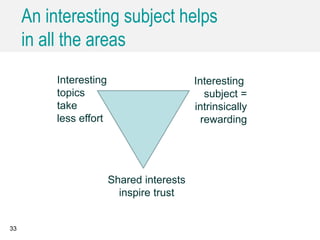
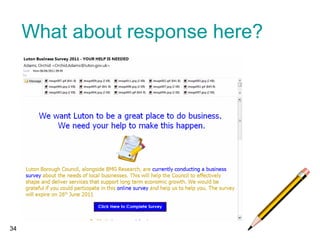
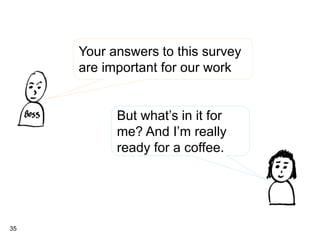
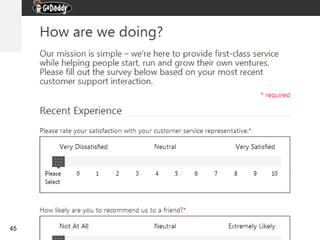
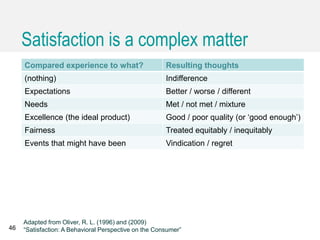
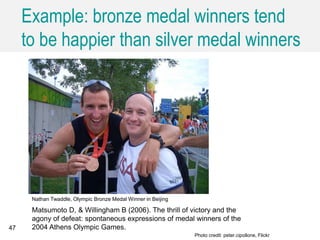
A deep dive
into questions
Workshop at UxLx 2014 led by Caroline Jarrett
How to ask better questions, and
how to assess user experience using surveys
Introductions
(I’m Caroline Jarrett - @cjforms)
Work with your neighbour
• Your name and role
• A random thing about yourself
2
Agenda Introductions
How to ask better questions
Break
How to assess user experience using surveys
Wrap up
3
A survey I saw recently
4
• How do we know it’s a survey?
5
And it continued….
6
• I’ll hand out an invitation I received recently by email
• Work in pairs
• Decide whether it is a survey or something else
7
Agenda
Introductions
What is a survey?
How to ask better questions
The steps to answer a question
Improve step 1: read and understand
Improve step 2: find the answer
Improve step 3: judge the answer
Improve step 4: place the answer
Understand why people answer
Break
How to assess user experience using surveys
Wrap up
8
There are four steps to answer a
question
Step
1. Read and understand
2. Find an answer
3. Judge the answer
4. Place the answer
Adapted from Tourangeau, R., Rips, L. J. and Rasinski, K. A. (2000)
“The psychology of survey response”
There are four steps to answer a
question
Step A good question …
1. Read and understand is legible and makes sense
2. Find an answer asks for answers that we know
3. Judge the answer asks for answers we’re happy to reveal
4. Place the answer offers appropriate spaces for the answers
Adapted from Tourangeau, R., Rips, L. J. and Rasinski, K. A. (2000)
“The psychology of survey response”
Are you …?
11
Let’s review a question
• There is a question coming up on the next slide
• I will ask you to think about ONE of these four steps
1. Read and understand
2. Find the answer
3. Judge the answer
4. Place the answer
• Please think about any problems in that particular step
12
13
Agenda
Introductions
What is a survey?
How to ask better questions
The steps to answer a question
Improve step 1: read and understand
Improve step 2: find the answer
Improve step 3: judge the answer
Improve step 4: place the answer
Understand why people answer
Break
How to assess user experience using surveys
Wrap up
14
Legibility is also important
15 Hermann grid illusion
Agenda
Introductions
What is a survey?
How to ask better questions
The steps to answer a question
Improve step 1: read and understand
Improve step 2: find the answer
Improve step 3: judge the answer
Improve step 4: place the answer
Understand why people answer
Break
How to assess user experience using surveys
Wrap up
16
17
In your last five days at work, what
percentage of your work time do you
estimate that you spend using publicly-
available online services (not including
email, instant messaging and search) to
do your work using a work computer or
other device?
The approximate curve of forgetting
Agenda
Introductions
What is a survey?
How to ask better questions
The steps to answer a question
Improve step 1: read and understand
Improve step 2: find the answer
Improve step 3: judge the answer
Improve step 4: place the answer
Understand why people answer
Break
How to assess user experience using surveys
Wrap up
19
I saw this question on an
employee survey
20
• Let’s create a list
21
Agenda
Introductions
What is a survey?
How to ask better questions
The steps to answer a question
Improve step 1: read and understand
Improve step 2: find the answer
Improve step 3: judge the answer
Improve step 4: place the answer
Understand why people answer
Break
How to assess user experience using surveys
Wrap up
22
Test with users to make sure you
offer the right answer options
23
24
25
Offer the right widget to collect the answer
Knowledge of what
users want to tell you
How many answers? Offer
We know all the
answers that users are
likely to give us
They only have one
answer
Radio buttons
They may have more
than one
Check boxes
We’re not sure Text boxes
26
Allen Miller, S. J. and Jarrett, C. (2001) “Should I use a drop-down?”
http://www.formsthatwork.com/files/Articles/dropdown.pdf
27
Grids are often full of problems
at all four steps
28
Grids are a major cause of
survey drop-out
29
35%
20%
20%
15%
5%
5%
Total incompletes across the 'main' section of the questionnaire
(after the introduction stage)
Subject Matter
Media Downloads
Survey Length
Large Grids
Open Questions
Other
Source: Database of 3 million+ web surveys conducted by Lightspeed Research/Kantar
Quoted in Coombe, R., Jarrett, C. and Johnson, A. (2010) “Usability testing of market research surveys” ESRA Lausanne
But it’s the topic that matters most
30
35%
20%
20%
15%
5%
5%
Total incompletes across the 'main' section of the questionnaire
(after the introduction stage)
Subject Matter
Media Downloads
Survey Length
Large Grids
Open Questions
Other
Source: Database of 3 million+ web surveys conducted by Lightspeed Research/Kantar
Quoted in Coombe, R., Jarrett, C. and Johnson, A. (2010) “Usability testing of market research surveys” ESRA Lausanne
Agenda
Introductions
What is a survey?
How to ask better questions
The steps to answer a question
Improve step 1: read and understand
Improve step 2: find the answer
Improve step 3: judge the answer
Improve step 4: place the answer
Understand why people answer
Break
How to assess user experience using surveys
Wrap up
31
Response relies on
effort, reward, and trust
32
Trust
Perceived
effort
Perceived
reward
Diagram from Jarrett, C, and Gaffney, G (2008) “Forms that work: Designing web forms for usability”
inspired by Dillman, D.A. (2000) “Internet, Mail and Mixed Mode Surveys: The Tailored Design Method”
An interesting subject helps
in all the areas
33
Shared interests
inspire trust
Interesting
topics
take
less effort
Interesting
subject =
intrinsically
rewarding
What about response here?
34
35
Your answers to this survey
are important for our work
But what’s in it for
me? And I’m really
ready for a coffee.
Agenda Introductions
What is a survey?
How to ask better questions
Break
How to assess user experience using surveys
Wrap up
36
Let’s start with a standard option: SUS
• The System Usability Scale
(SUS) was created in 1986
• It has been shown to be
valid and reliable
• You get a score between
0 and 100
• You can compare your SUS
score with other systems
37
Brooke, J. (1996). SUS: A "quick and dirty" usability scale. In
Usability Evaluation in Industry.
P. W. Jordan, B. Thomas, B. A. Weerdmeester and A. L.
McClelland. London:, Taylor and Francis.
Jeff Sauro (@measuringux) has done
a lot of work with SUS
38 http://www.measuringusability.com/sus.php.
• Jeff provides tools for
scoring SUS
• He has adapted it to
websites
• “SUS scores are not
percentages”
There are other commercial products
with wider concepts of UX
39
• SUPR-Q
– includes credibility and loyalty
– licenced product
– http://www.suprq.com
• WAMMI
– online service
– includes access to standard
databases (extra for SUPR-Q)
– http://www.wammi.com
• Your task: find an explanation of the difference between
the European Commission and the European Union
• Use this site: http://ec.europa.eu
• Decide whether you had a good or bad experience
40
• I will ask you to fill in SUS (original) or SUS (Sauro)
41
My journey into user experience
started a long time ago, with usability
The extent to which a product
can be used by specified users
to achieve specified goals with
effectiveness, efficiency and
satisfaction
in a specified context of use
(ISO 9241:11 1998)
42
Working mostly in government, we were
interested in effectiveness and efficiency
43
The extent to which a product
can be used by specified users
to achieve specified goals with
effectiveness, efficiency and
satisfaction
in a specified context of use
(ISO 9241:11 1998)
But what about user experience?
What about satisfaction?
44
The extent to which a product
can be used by specified users
to achieve specified goals with
effectiveness, efficiency and
satisfaction
in a specified context of use
(ISO 9241:11 1998)
Picture credit: Flickr jek in the box
45
Satisfaction is a complex matter
Compared experience to what? Resulting thoughts
(nothing) Indifference
Expectations Better / worse / different
Needs Met / not met / mixture
Excellence (the ideal product) Good / poor quality (or ‘good enough’)
Fairness Treated equitably / inequitably
Events that might have been Vindication / regret
46
Adapted from Oliver, R. L. (1996) and (2009)
“Satisfaction: A Behavioral Perspective on the Consumer”
Example: bronze medal winners tend
to be happier than silver medal winners
47
Nathan Twaddle, Olympic Bronze Medal Winner in Beijing
Photo credit: peter.cipollone, Flickr
Matsumoto D, & Willingham B (2006). The thrill of victory and the
agony of defeat: spontaneous expressions of medal winners of the
2004 Athens Olympic Games.
• The first question was about rating satisfaction
• What were they asking us to rate?
– Just a guess from what you recall
48
49
The challenge of UX and surveys:
which bit to measure?
The extent to which a product
can be used by specified users
to achieve specified goals with
effectiveness, efficiency and
satisfaction
in a specified context of use
(ISO 9241:11 1998)
???
Some ideas about what we could
measure
In the definition GoDaddy customer
support
GoDaddy as a provider of
domain names
Product This contact with help desk Overall experience of moving
a domain to GoDaddy
Users What proportion of
customers contact support
Demographics (example: type
of job)
Goals Reason for contacting help Reason for looking at
GoDaddy
Effectiveness Whether support fixed the
problem
Whether GoDaddy offers the
right products
Efficiency Whether it took a reasonable
time
Whether the product is priced
correctly
Satisfaction Helpfulness of support
person
Likely to purchase again /
recommend
Context of use Home/office; alone/helped Business / personal
51
52
In the definition Information to help the European Commission
design a better website
Product
Users
Goals
Effectiveness
Efficiency
Satisfaction
Context of use
• Write questions for each topic
• Then get another team to try your questionnaire
53
Find out about users’ goals
Tip
54
Ask about recent vivid
experienceTip
55
Image credit: Fraser Smith
Interview first
Tip
56
Test everything
Tip
57
Caroline Jarrett
Twitter @cjforms
http://www.slideshare.net/cjforms
carolinej@effortmark.co.uk
58
More resources on
http://www.slideshare.net/cjforms
59

A deep dive into questions by @cjforms at UxLx

  • 1.
    A deep dive intoquestions Workshop at UxLx 2014 led by Caroline Jarrett How to ask better questions, and how to assess user experience using surveys
  • 2.
    Introductions (I’m Caroline Jarrett- @cjforms) Work with your neighbour • Your name and role • A random thing about yourself 2
  • 3.
    Agenda Introductions How toask better questions Break How to assess user experience using surveys Wrap up 3
  • 4.
    A survey Isaw recently 4 • How do we know it’s a survey?
  • 5.
  • 6.
  • 7.
    • I’ll handout an invitation I received recently by email • Work in pairs • Decide whether it is a survey or something else 7
  • 8.
    Agenda Introductions What is asurvey? How to ask better questions The steps to answer a question Improve step 1: read and understand Improve step 2: find the answer Improve step 3: judge the answer Improve step 4: place the answer Understand why people answer Break How to assess user experience using surveys Wrap up 8
  • 9.
    There are foursteps to answer a question Step 1. Read and understand 2. Find an answer 3. Judge the answer 4. Place the answer Adapted from Tourangeau, R., Rips, L. J. and Rasinski, K. A. (2000) “The psychology of survey response”
  • 10.
    There are foursteps to answer a question Step A good question … 1. Read and understand is legible and makes sense 2. Find an answer asks for answers that we know 3. Judge the answer asks for answers we’re happy to reveal 4. Place the answer offers appropriate spaces for the answers Adapted from Tourangeau, R., Rips, L. J. and Rasinski, K. A. (2000) “The psychology of survey response”
  • 11.
  • 12.
    Let’s review aquestion • There is a question coming up on the next slide • I will ask you to think about ONE of these four steps 1. Read and understand 2. Find the answer 3. Judge the answer 4. Place the answer • Please think about any problems in that particular step 12
  • 13.
  • 14.
    Agenda Introductions What is asurvey? How to ask better questions The steps to answer a question Improve step 1: read and understand Improve step 2: find the answer Improve step 3: judge the answer Improve step 4: place the answer Understand why people answer Break How to assess user experience using surveys Wrap up 14
  • 15.
    Legibility is alsoimportant 15 Hermann grid illusion
  • 16.
    Agenda Introductions What is asurvey? How to ask better questions The steps to answer a question Improve step 1: read and understand Improve step 2: find the answer Improve step 3: judge the answer Improve step 4: place the answer Understand why people answer Break How to assess user experience using surveys Wrap up 16
  • 17.
    17 In your lastfive days at work, what percentage of your work time do you estimate that you spend using publicly- available online services (not including email, instant messaging and search) to do your work using a work computer or other device?
  • 18.
    The approximate curveof forgetting
  • 19.
    Agenda Introductions What is asurvey? How to ask better questions The steps to answer a question Improve step 1: read and understand Improve step 2: find the answer Improve step 3: judge the answer Improve step 4: place the answer Understand why people answer Break How to assess user experience using surveys Wrap up 19
  • 20.
    I saw thisquestion on an employee survey 20
  • 21.
  • 22.
    Agenda Introductions What is asurvey? How to ask better questions The steps to answer a question Improve step 1: read and understand Improve step 2: find the answer Improve step 3: judge the answer Improve step 4: place the answer Understand why people answer Break How to assess user experience using surveys Wrap up 22
  • 23.
    Test with usersto make sure you offer the right answer options 23
  • 24.
  • 25.
  • 26.
    Offer the rightwidget to collect the answer Knowledge of what users want to tell you How many answers? Offer We know all the answers that users are likely to give us They only have one answer Radio buttons They may have more than one Check boxes We’re not sure Text boxes 26 Allen Miller, S. J. and Jarrett, C. (2001) “Should I use a drop-down?” http://www.formsthatwork.com/files/Articles/dropdown.pdf
  • 27.
  • 28.
    Grids are oftenfull of problems at all four steps 28
  • 29.
    Grids are amajor cause of survey drop-out 29 35% 20% 20% 15% 5% 5% Total incompletes across the 'main' section of the questionnaire (after the introduction stage) Subject Matter Media Downloads Survey Length Large Grids Open Questions Other Source: Database of 3 million+ web surveys conducted by Lightspeed Research/Kantar Quoted in Coombe, R., Jarrett, C. and Johnson, A. (2010) “Usability testing of market research surveys” ESRA Lausanne
  • 30.
    But it’s thetopic that matters most 30 35% 20% 20% 15% 5% 5% Total incompletes across the 'main' section of the questionnaire (after the introduction stage) Subject Matter Media Downloads Survey Length Large Grids Open Questions Other Source: Database of 3 million+ web surveys conducted by Lightspeed Research/Kantar Quoted in Coombe, R., Jarrett, C. and Johnson, A. (2010) “Usability testing of market research surveys” ESRA Lausanne
  • 31.
    Agenda Introductions What is asurvey? How to ask better questions The steps to answer a question Improve step 1: read and understand Improve step 2: find the answer Improve step 3: judge the answer Improve step 4: place the answer Understand why people answer Break How to assess user experience using surveys Wrap up 31
  • 32.
    Response relies on effort,reward, and trust 32 Trust Perceived effort Perceived reward Diagram from Jarrett, C, and Gaffney, G (2008) “Forms that work: Designing web forms for usability” inspired by Dillman, D.A. (2000) “Internet, Mail and Mixed Mode Surveys: The Tailored Design Method”
  • 33.
    An interesting subjecthelps in all the areas 33 Shared interests inspire trust Interesting topics take less effort Interesting subject = intrinsically rewarding
  • 34.
  • 35.
    35 Your answers tothis survey are important for our work But what’s in it for me? And I’m really ready for a coffee.
  • 36.
    Agenda Introductions What isa survey? How to ask better questions Break How to assess user experience using surveys Wrap up 36
  • 37.
    Let’s start witha standard option: SUS • The System Usability Scale (SUS) was created in 1986 • It has been shown to be valid and reliable • You get a score between 0 and 100 • You can compare your SUS score with other systems 37 Brooke, J. (1996). SUS: A "quick and dirty" usability scale. In Usability Evaluation in Industry. P. W. Jordan, B. Thomas, B. A. Weerdmeester and A. L. McClelland. London:, Taylor and Francis.
  • 38.
    Jeff Sauro (@measuringux)has done a lot of work with SUS 38 http://www.measuringusability.com/sus.php. • Jeff provides tools for scoring SUS • He has adapted it to websites • “SUS scores are not percentages”
  • 39.
    There are othercommercial products with wider concepts of UX 39 • SUPR-Q – includes credibility and loyalty – licenced product – http://www.suprq.com • WAMMI – online service – includes access to standard databases (extra for SUPR-Q) – http://www.wammi.com
  • 40.
    • Your task:find an explanation of the difference between the European Commission and the European Union • Use this site: http://ec.europa.eu • Decide whether you had a good or bad experience 40
  • 41.
    • I willask you to fill in SUS (original) or SUS (Sauro) 41
  • 42.
    My journey intouser experience started a long time ago, with usability The extent to which a product can be used by specified users to achieve specified goals with effectiveness, efficiency and satisfaction in a specified context of use (ISO 9241:11 1998) 42
  • 43.
    Working mostly ingovernment, we were interested in effectiveness and efficiency 43 The extent to which a product can be used by specified users to achieve specified goals with effectiveness, efficiency and satisfaction in a specified context of use (ISO 9241:11 1998)
  • 44.
    But what aboutuser experience? What about satisfaction? 44 The extent to which a product can be used by specified users to achieve specified goals with effectiveness, efficiency and satisfaction in a specified context of use (ISO 9241:11 1998) Picture credit: Flickr jek in the box
  • 45.
  • 46.
    Satisfaction is acomplex matter Compared experience to what? Resulting thoughts (nothing) Indifference Expectations Better / worse / different Needs Met / not met / mixture Excellence (the ideal product) Good / poor quality (or ‘good enough’) Fairness Treated equitably / inequitably Events that might have been Vindication / regret 46 Adapted from Oliver, R. L. (1996) and (2009) “Satisfaction: A Behavioral Perspective on the Consumer”
  • 47.
    Example: bronze medalwinners tend to be happier than silver medal winners 47 Nathan Twaddle, Olympic Bronze Medal Winner in Beijing Photo credit: peter.cipollone, Flickr Matsumoto D, & Willingham B (2006). The thrill of victory and the agony of defeat: spontaneous expressions of medal winners of the 2004 Athens Olympic Games.
  • 48.
    • The firstquestion was about rating satisfaction • What were they asking us to rate? – Just a guess from what you recall 48
  • 49.
  • 50.
    The challenge ofUX and surveys: which bit to measure? The extent to which a product can be used by specified users to achieve specified goals with effectiveness, efficiency and satisfaction in a specified context of use (ISO 9241:11 1998) ???
  • 51.
    Some ideas aboutwhat we could measure In the definition GoDaddy customer support GoDaddy as a provider of domain names Product This contact with help desk Overall experience of moving a domain to GoDaddy Users What proportion of customers contact support Demographics (example: type of job) Goals Reason for contacting help Reason for looking at GoDaddy Effectiveness Whether support fixed the problem Whether GoDaddy offers the right products Efficiency Whether it took a reasonable time Whether the product is priced correctly Satisfaction Helpfulness of support person Likely to purchase again / recommend Context of use Home/office; alone/helped Business / personal 51
  • 52.
    52 In the definitionInformation to help the European Commission design a better website Product Users Goals Effectiveness Efficiency Satisfaction Context of use
  • 53.
    • Write questionsfor each topic • Then get another team to try your questionnaire 53
  • 54.
    Find out aboutusers’ goals Tip 54
  • 55.
    Ask about recentvivid experienceTip 55 Image credit: Fraser Smith
  • 56.
  • 57.
  • 58.
  • 59.

Editor's Notes

  • #8 In this exercise, participants reviewed an email from a journeal that said it was a survey, but seemed to us more like a form.
  • #43 (c) Effortmark Limited 2004