The document discusses various topics relating to air temperature, including:
1) How daily, monthly, and annual mean temperatures are calculated from temperature data readings.
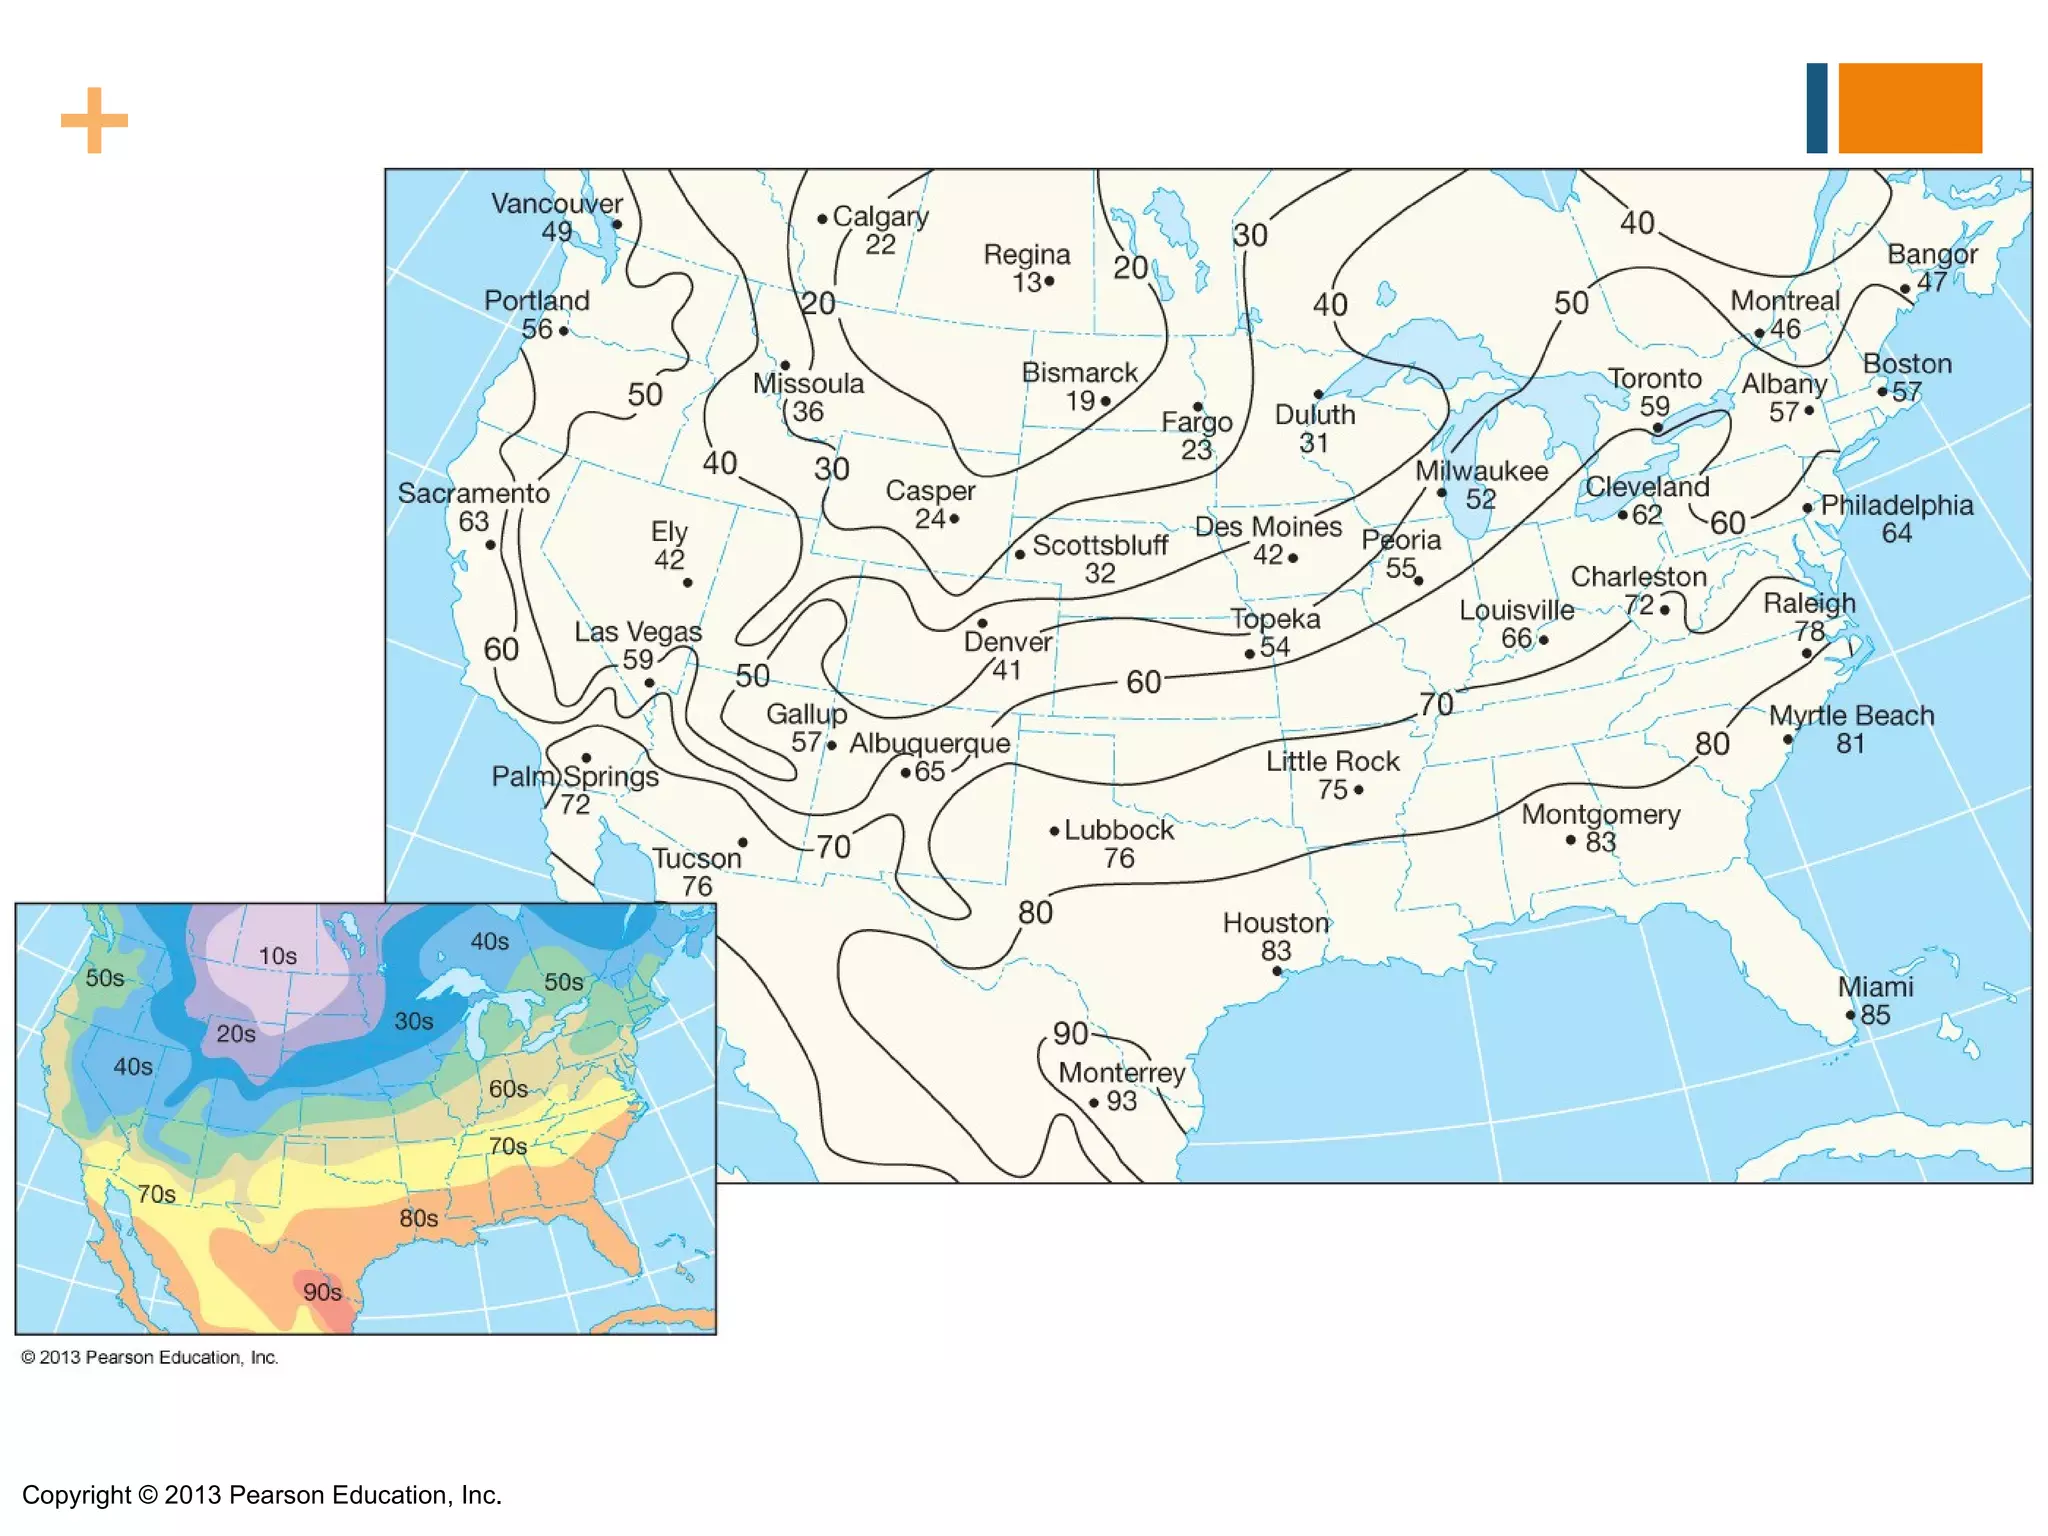
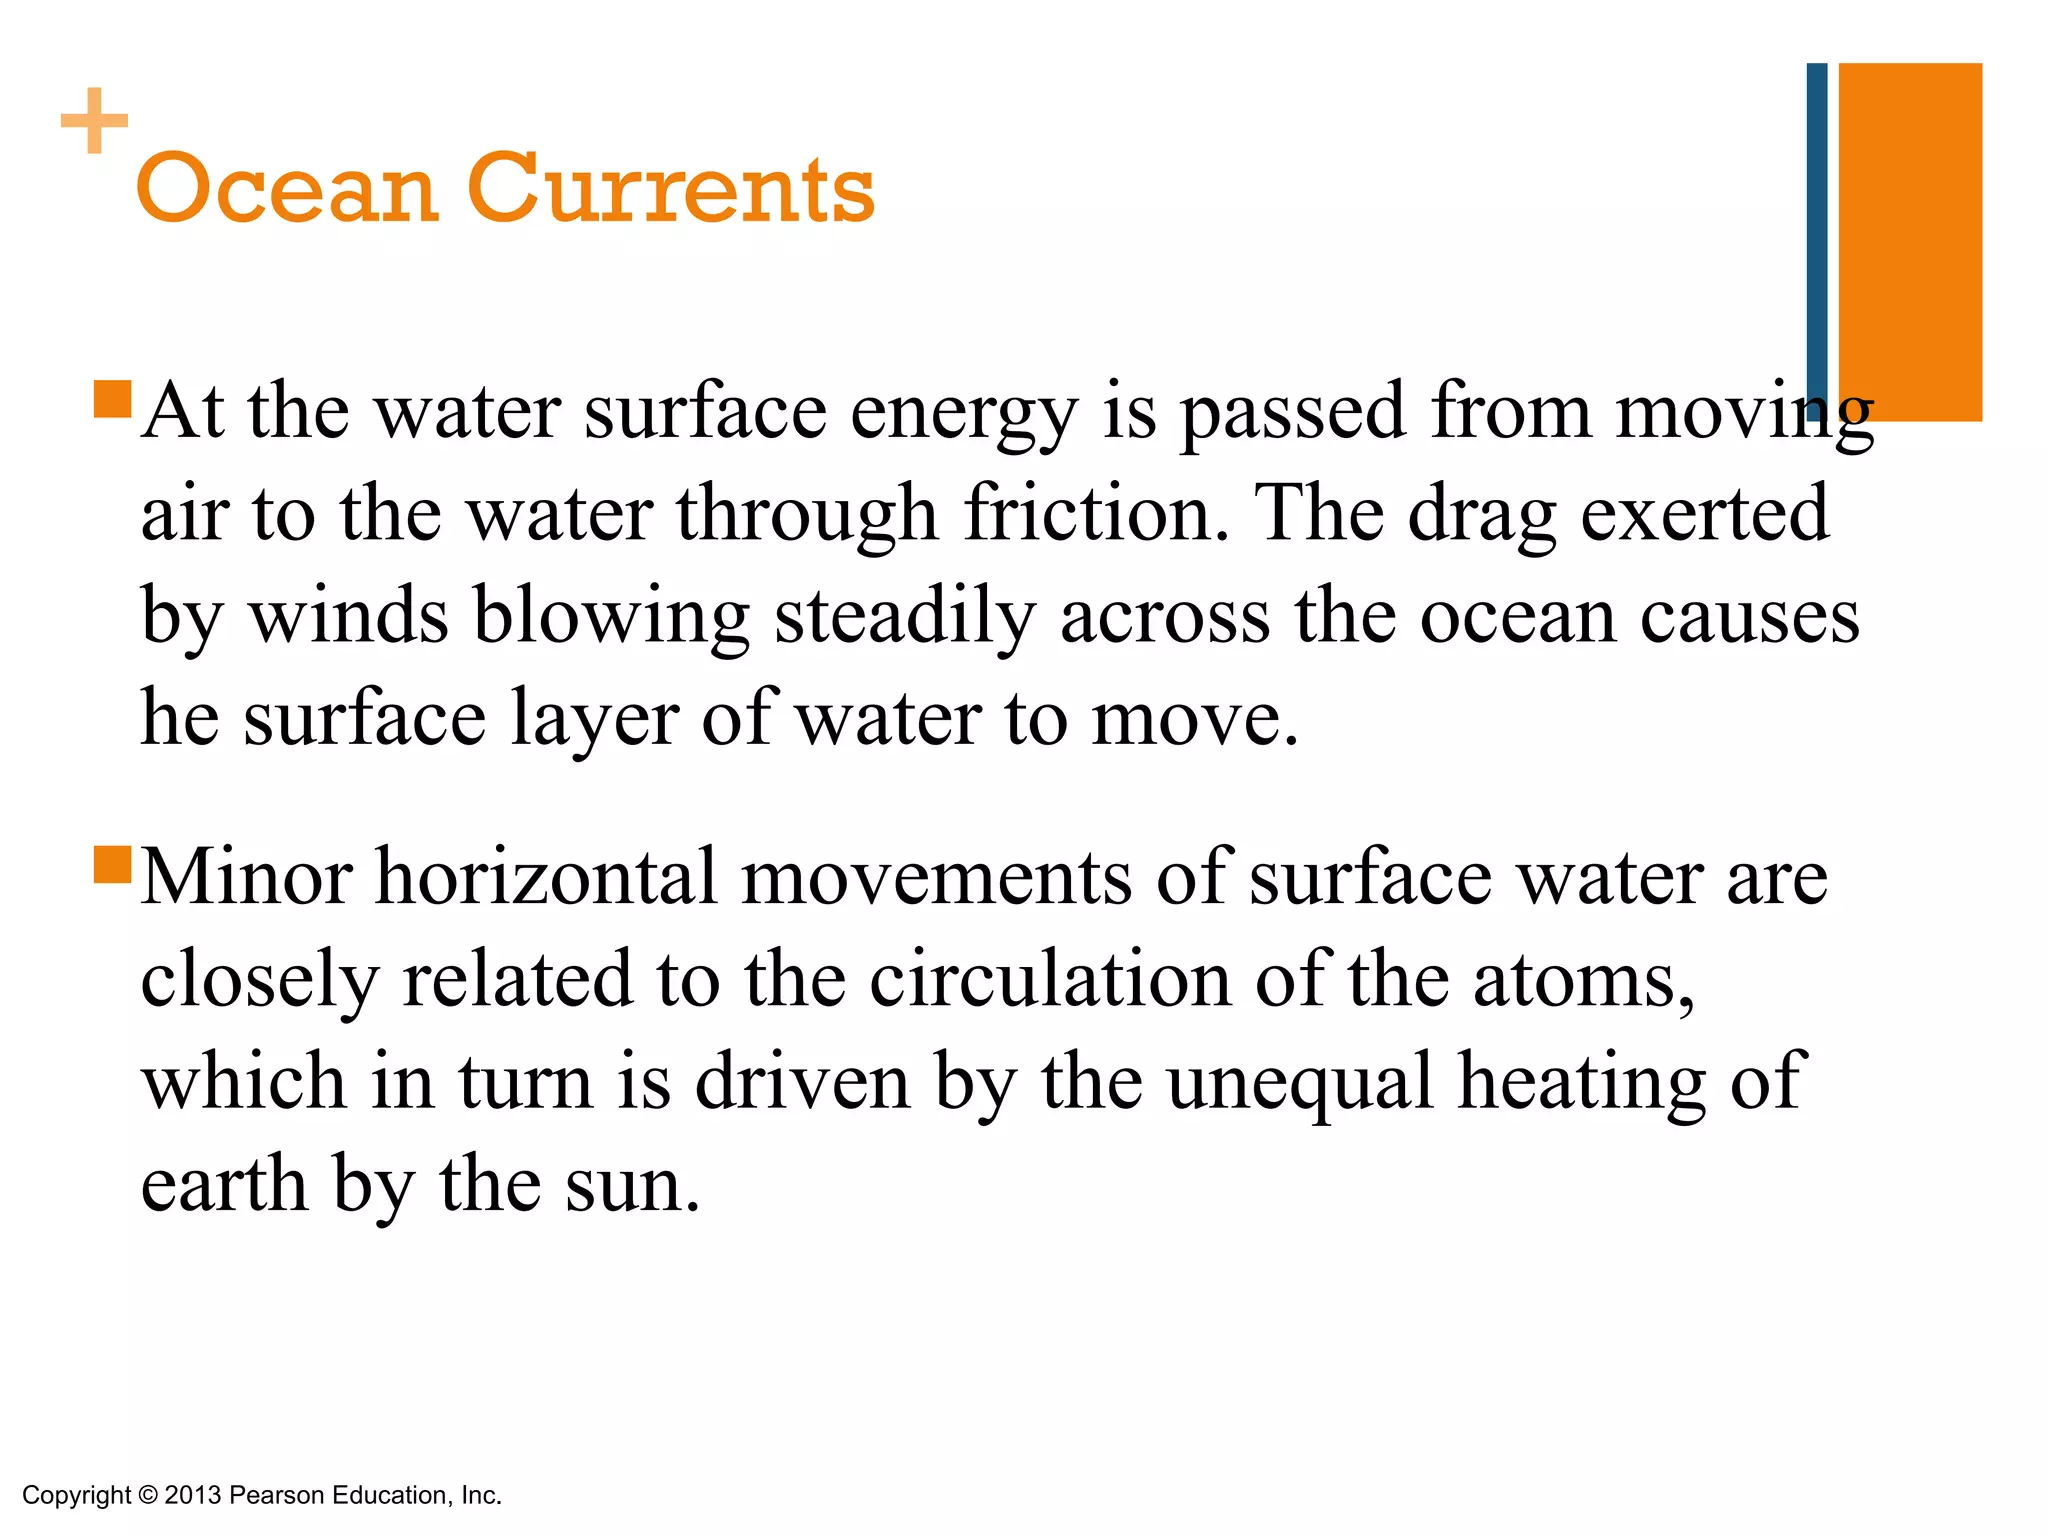
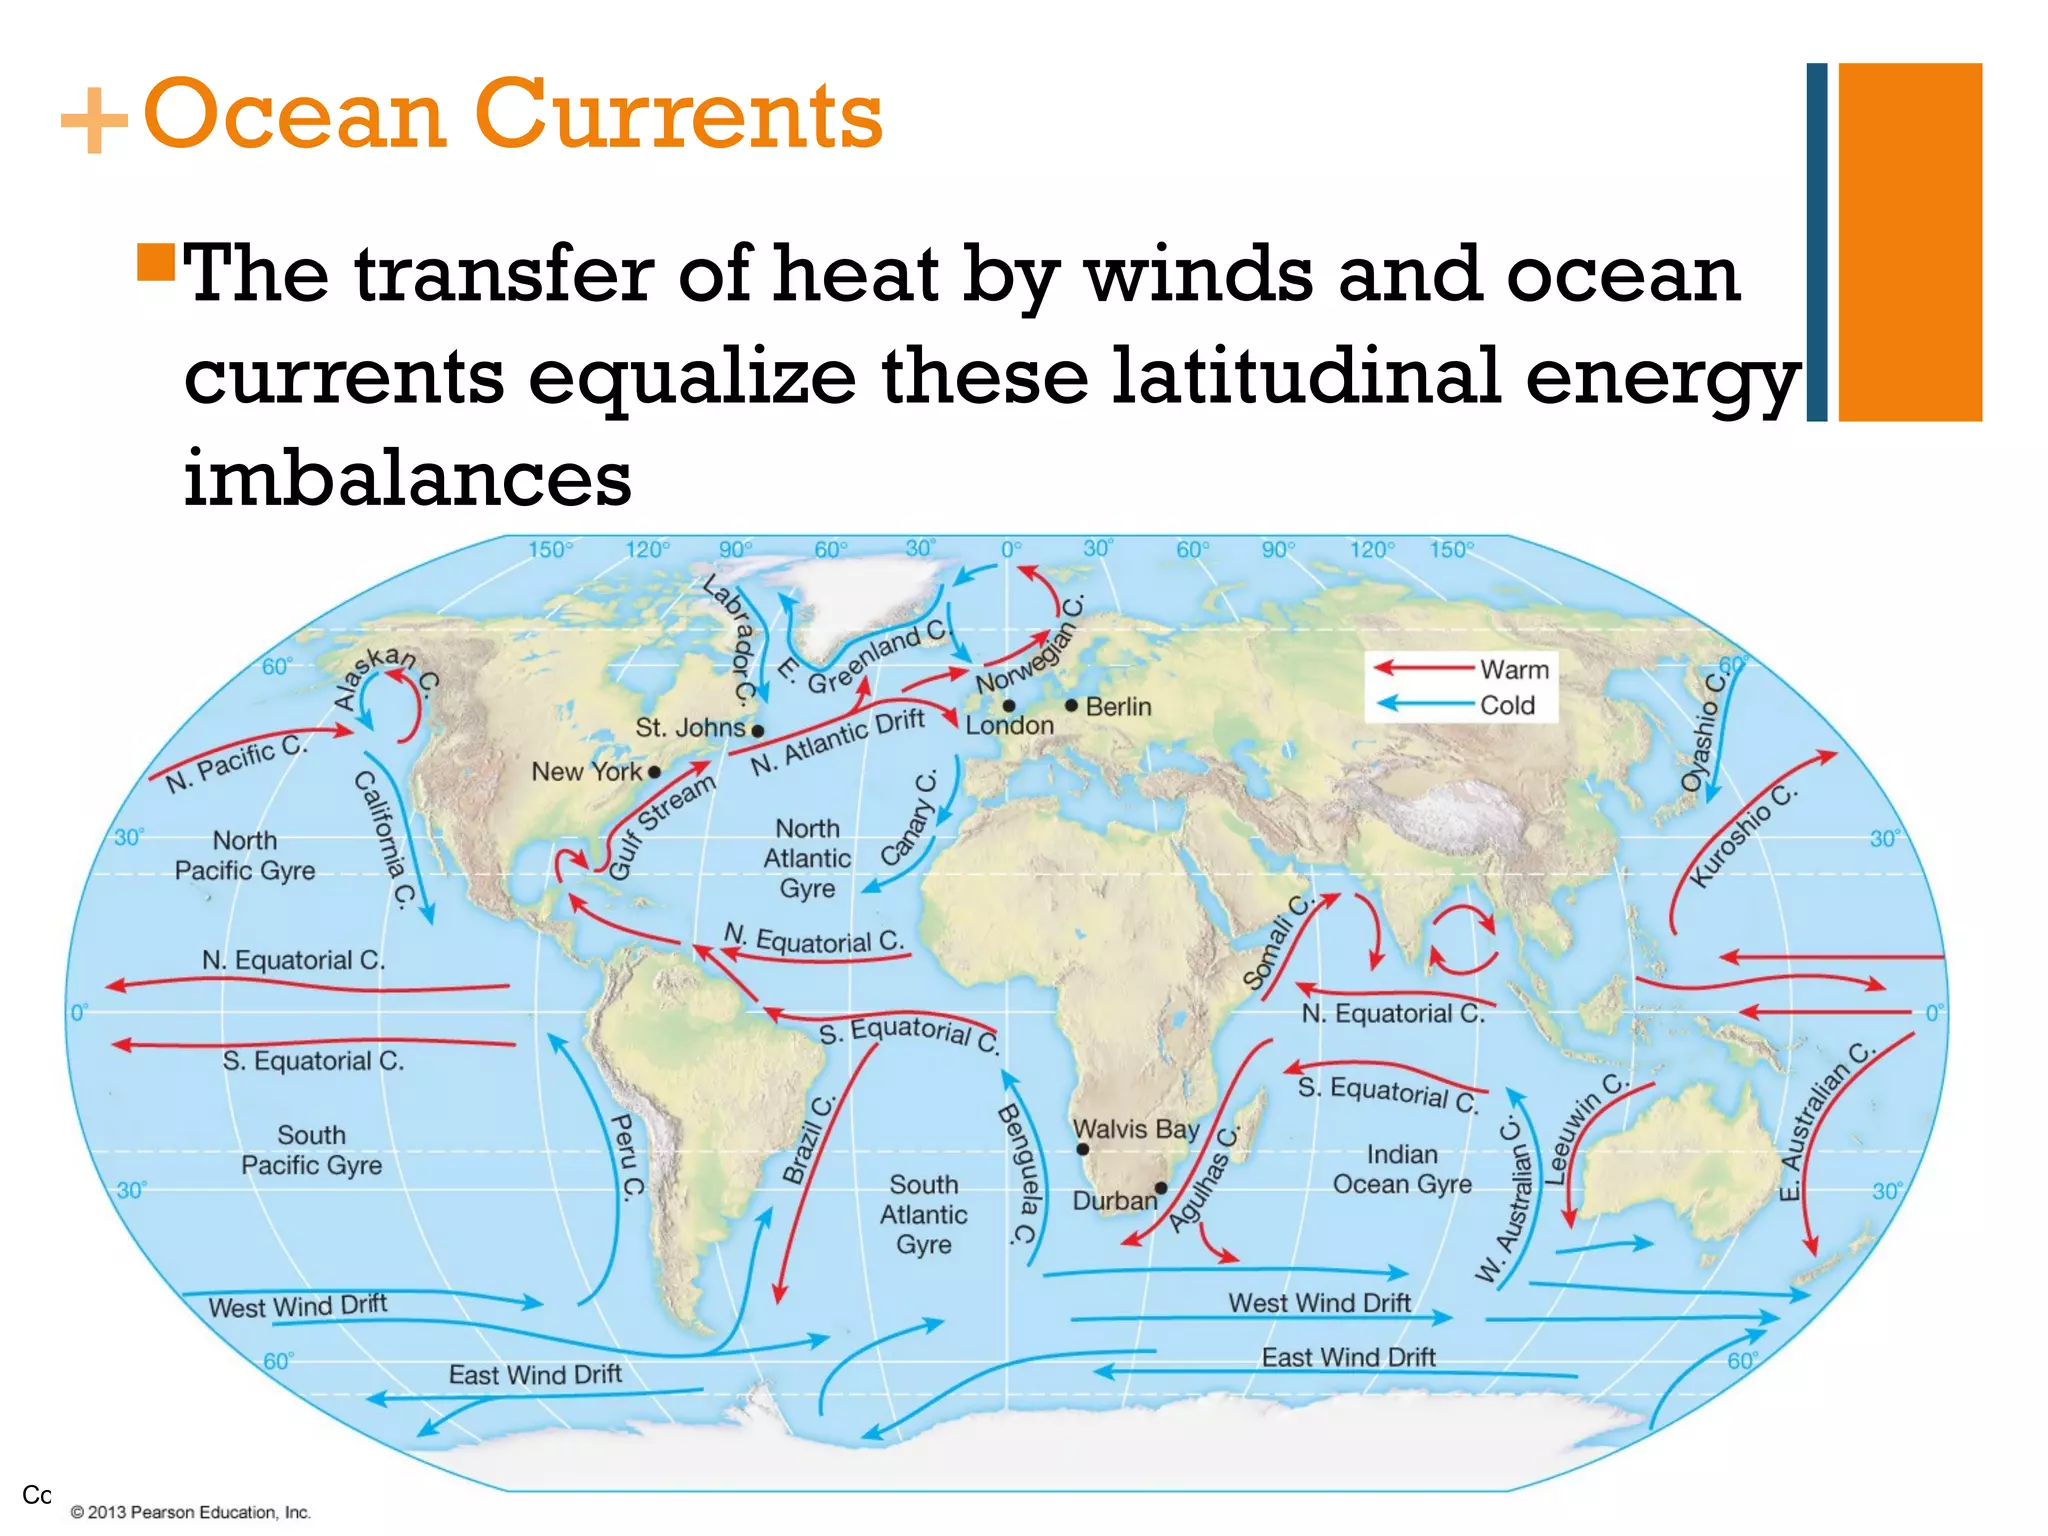
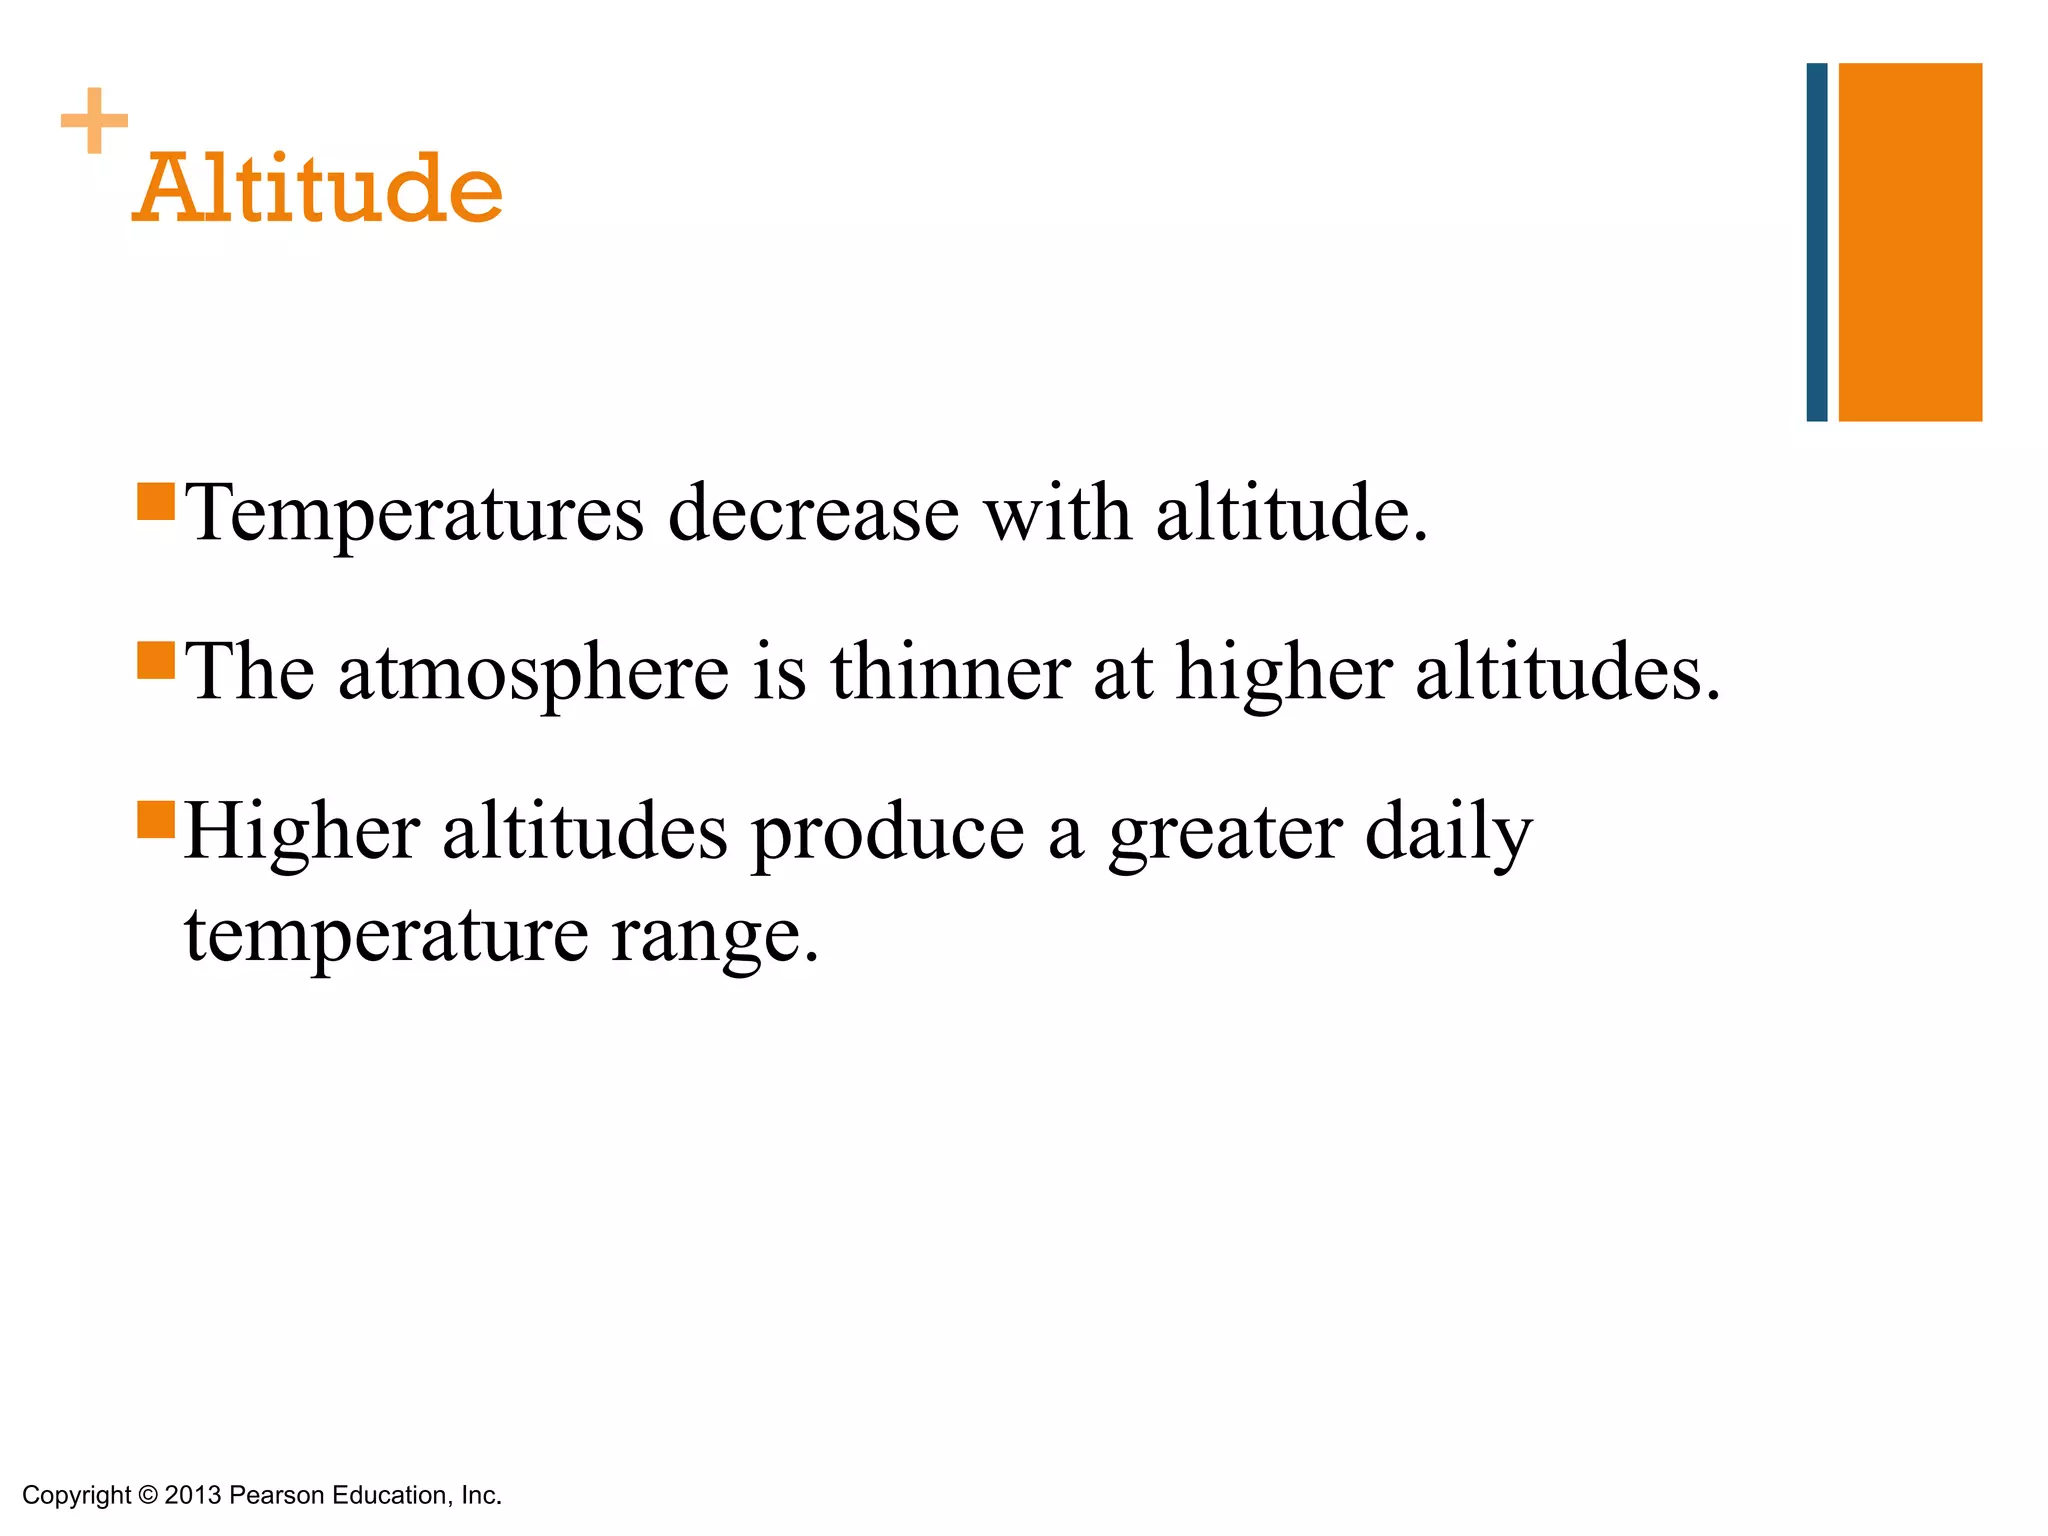
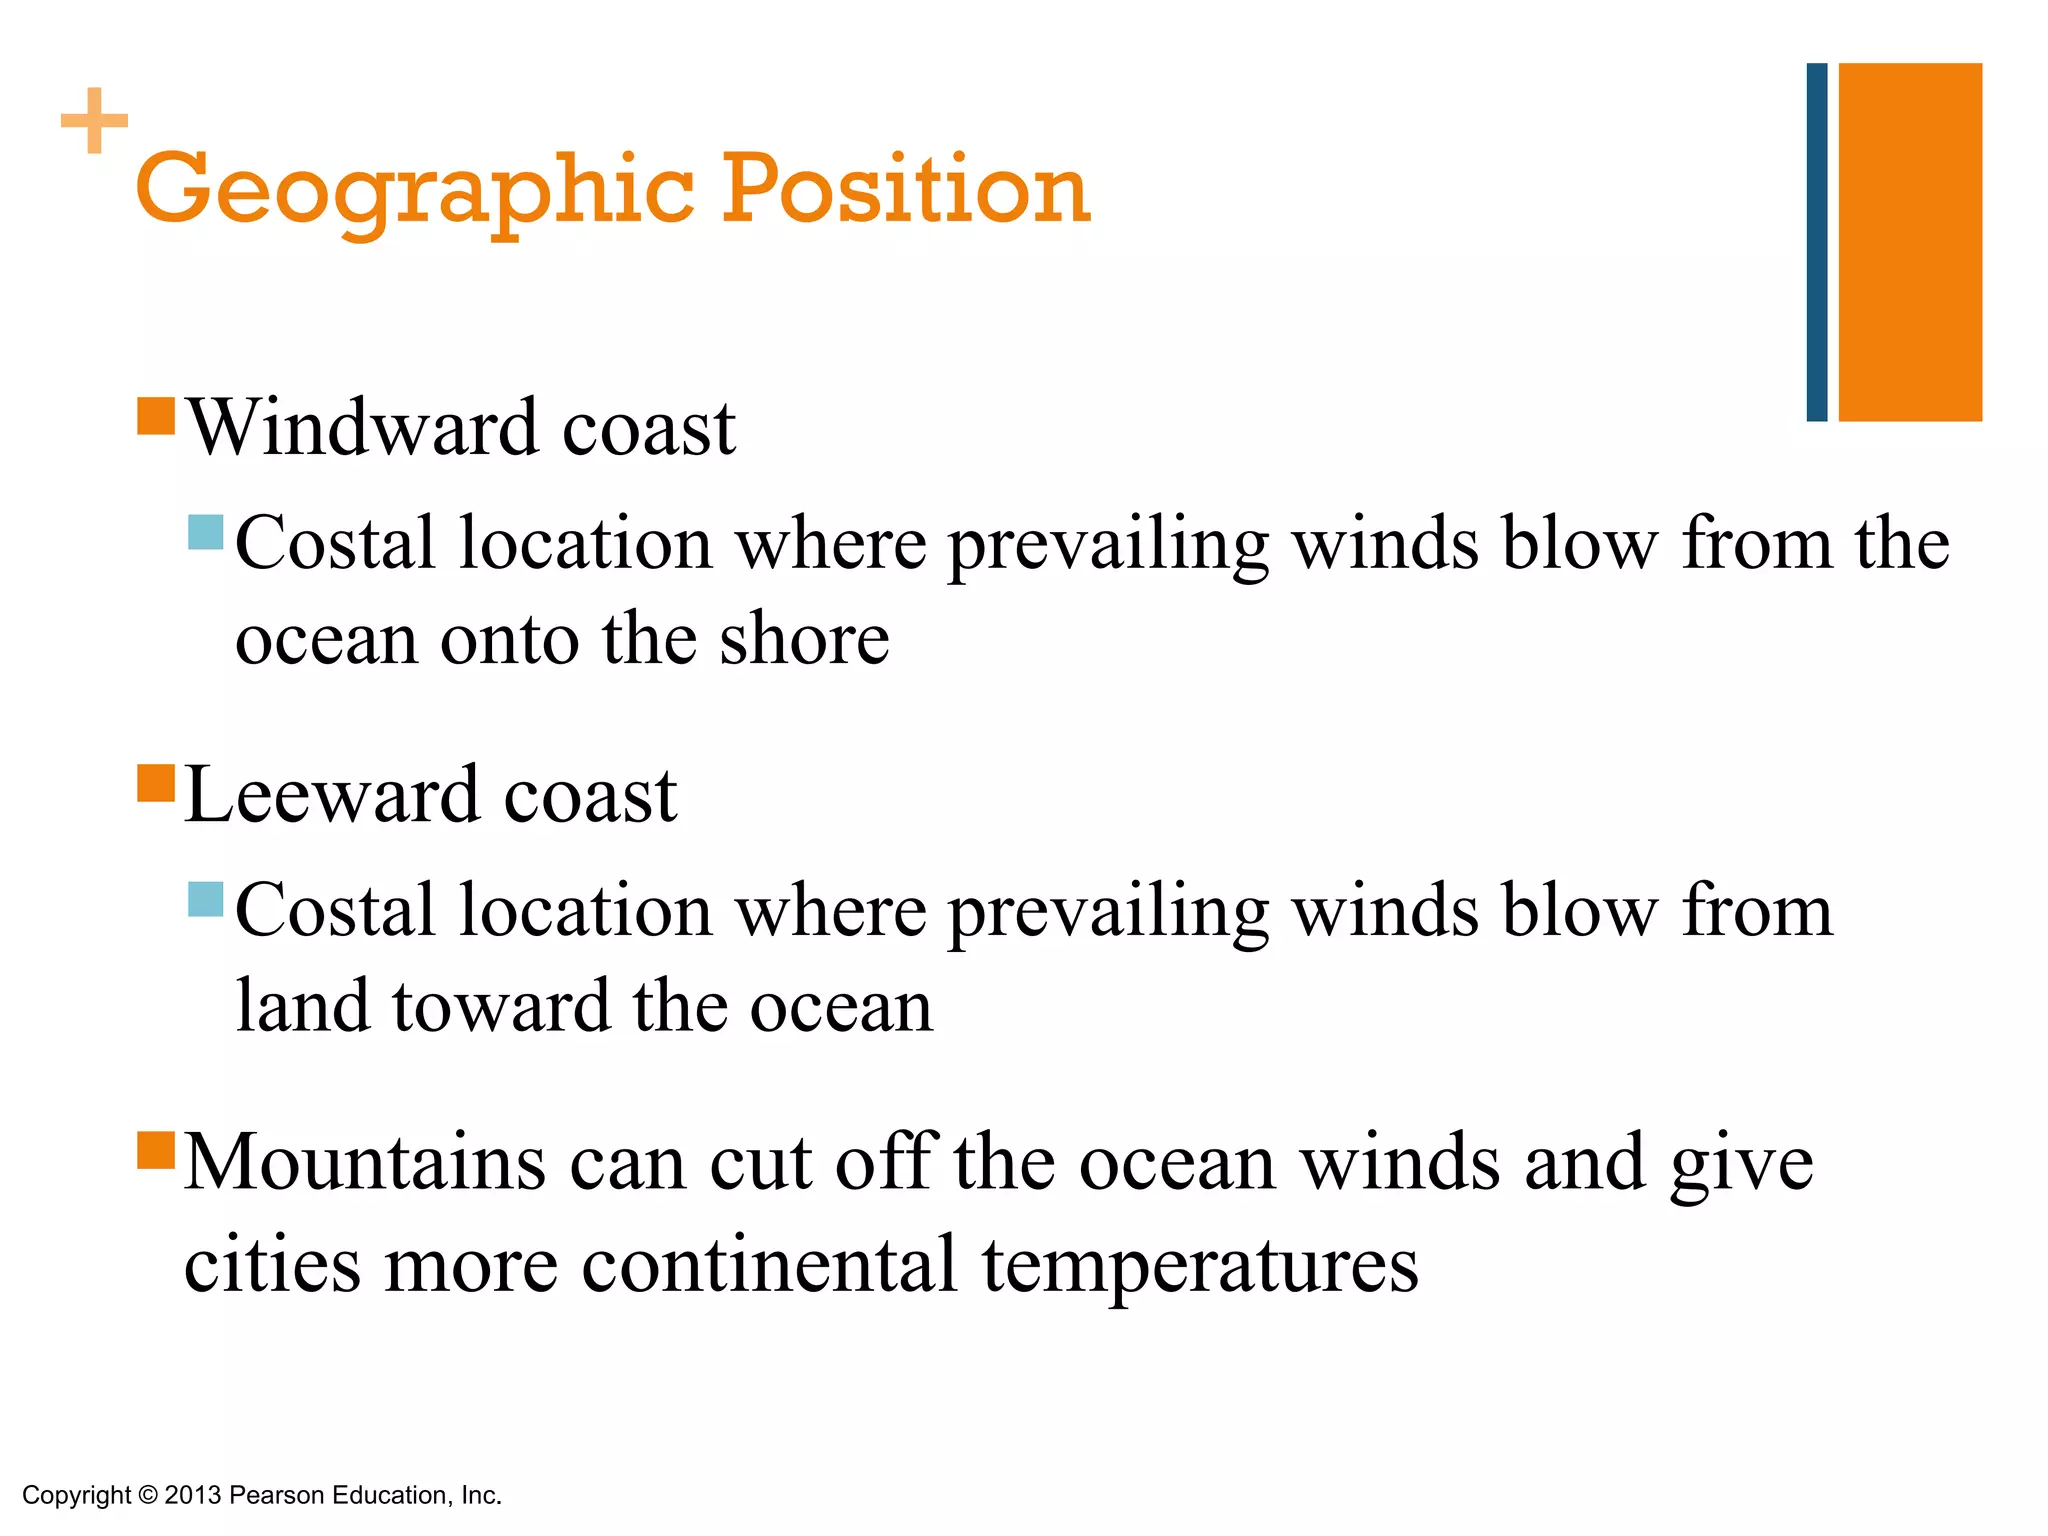
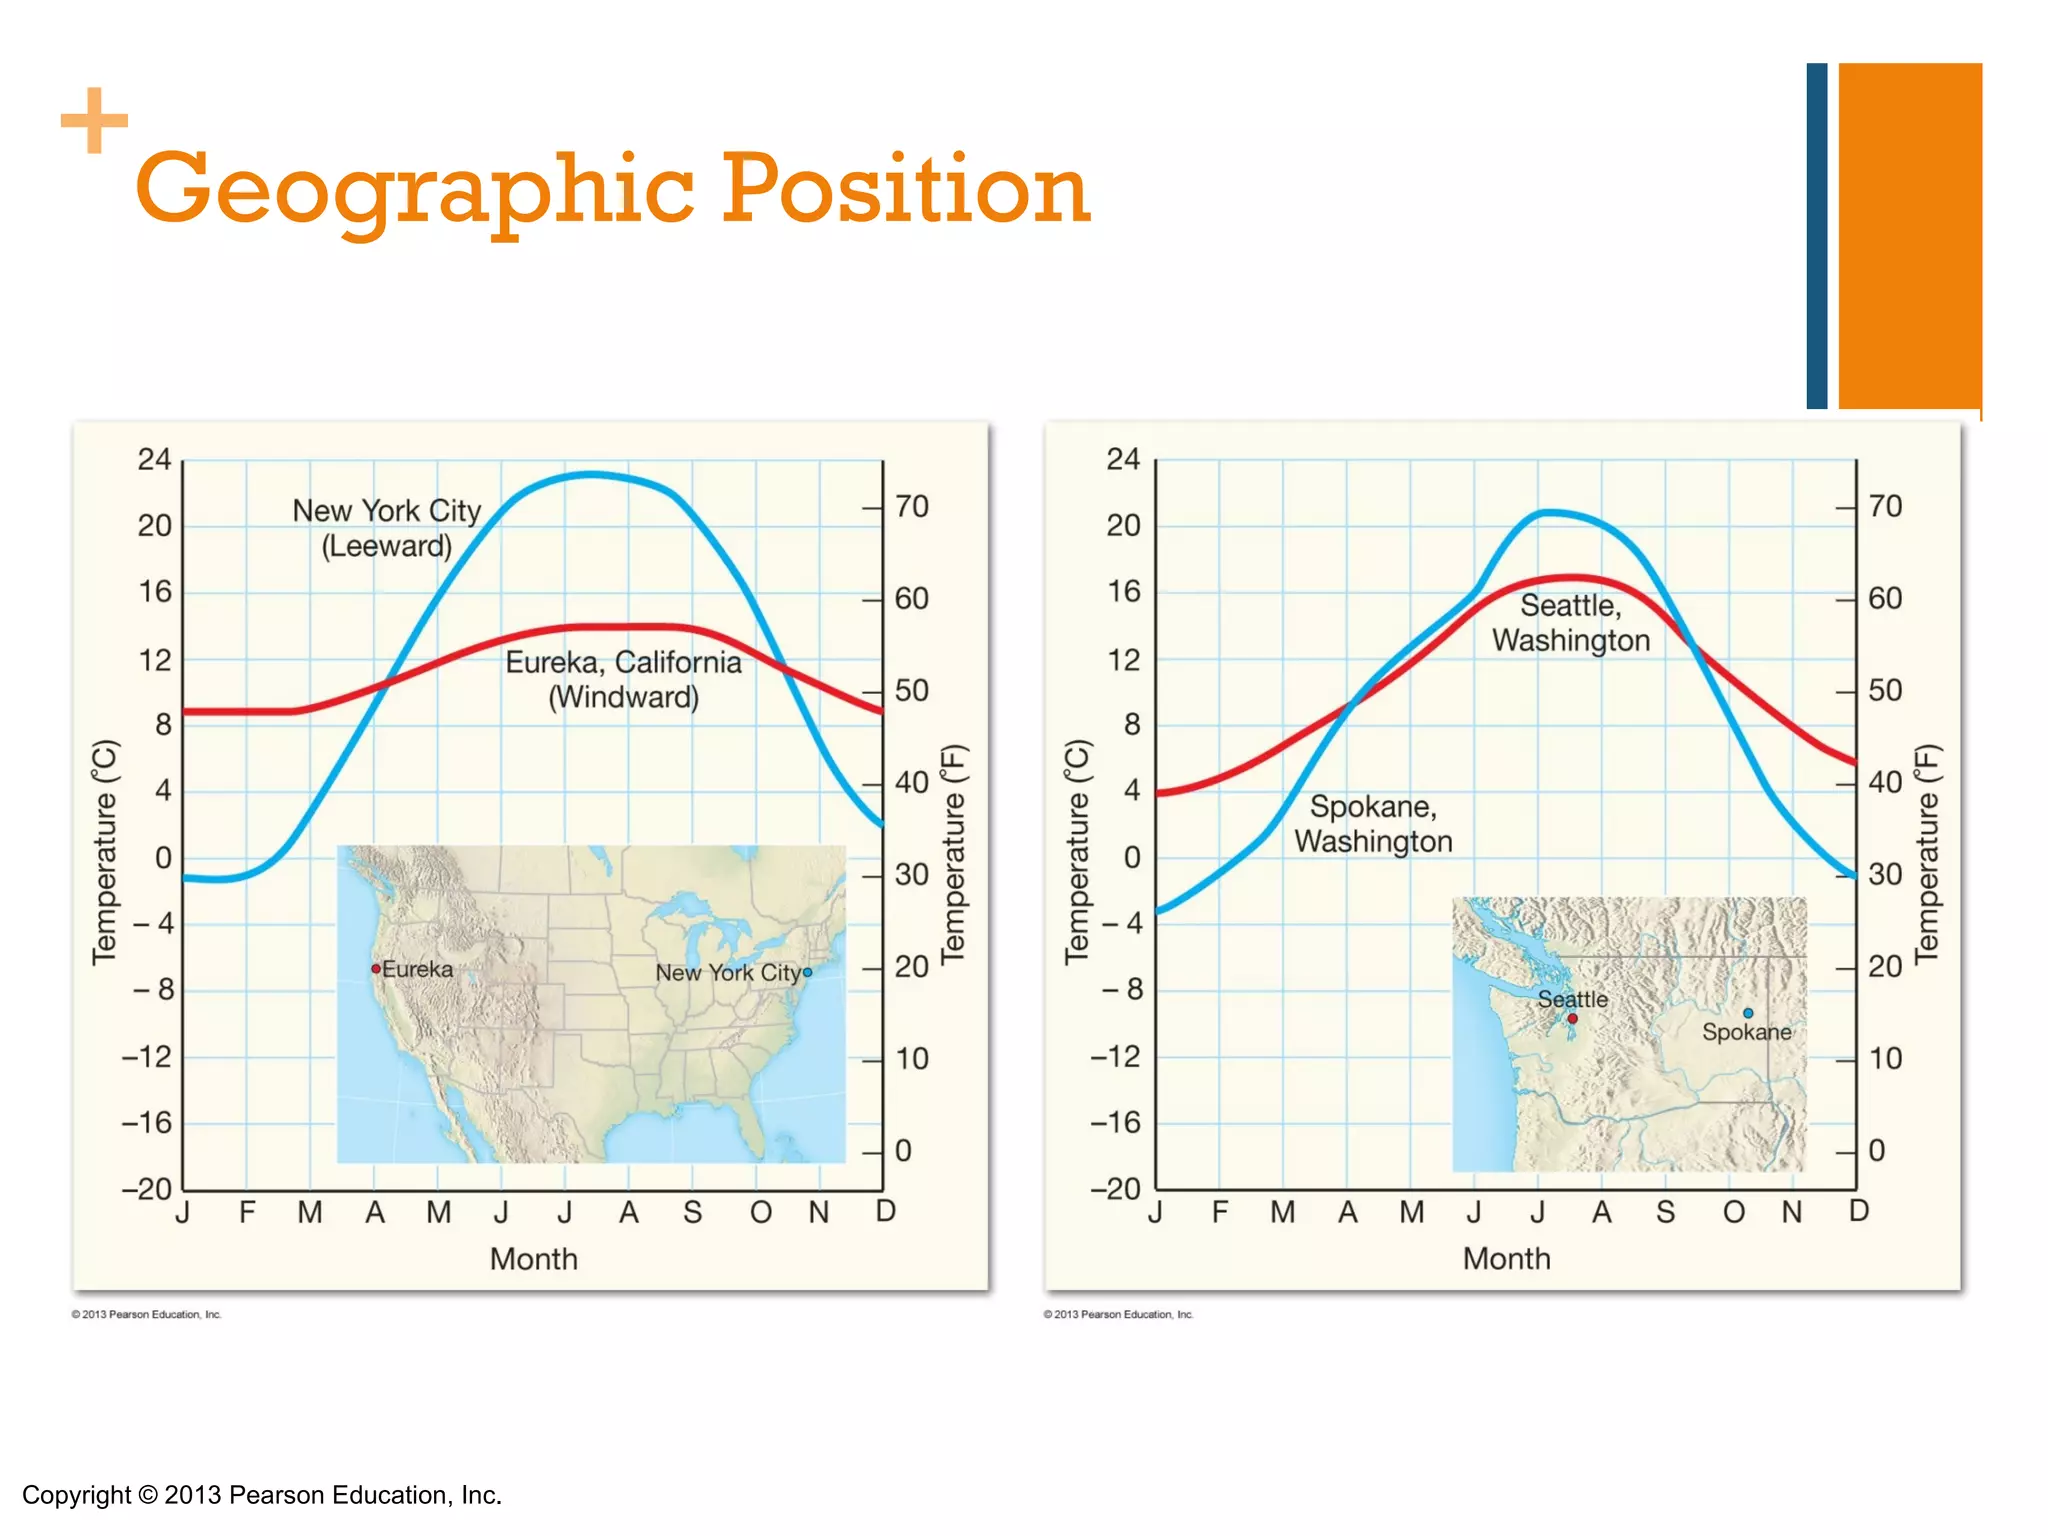
2) The main controls that cause temperatures to vary, such as differential heating of land and water, ocean currents, altitude, geographic position, and cloud cover/albedo.
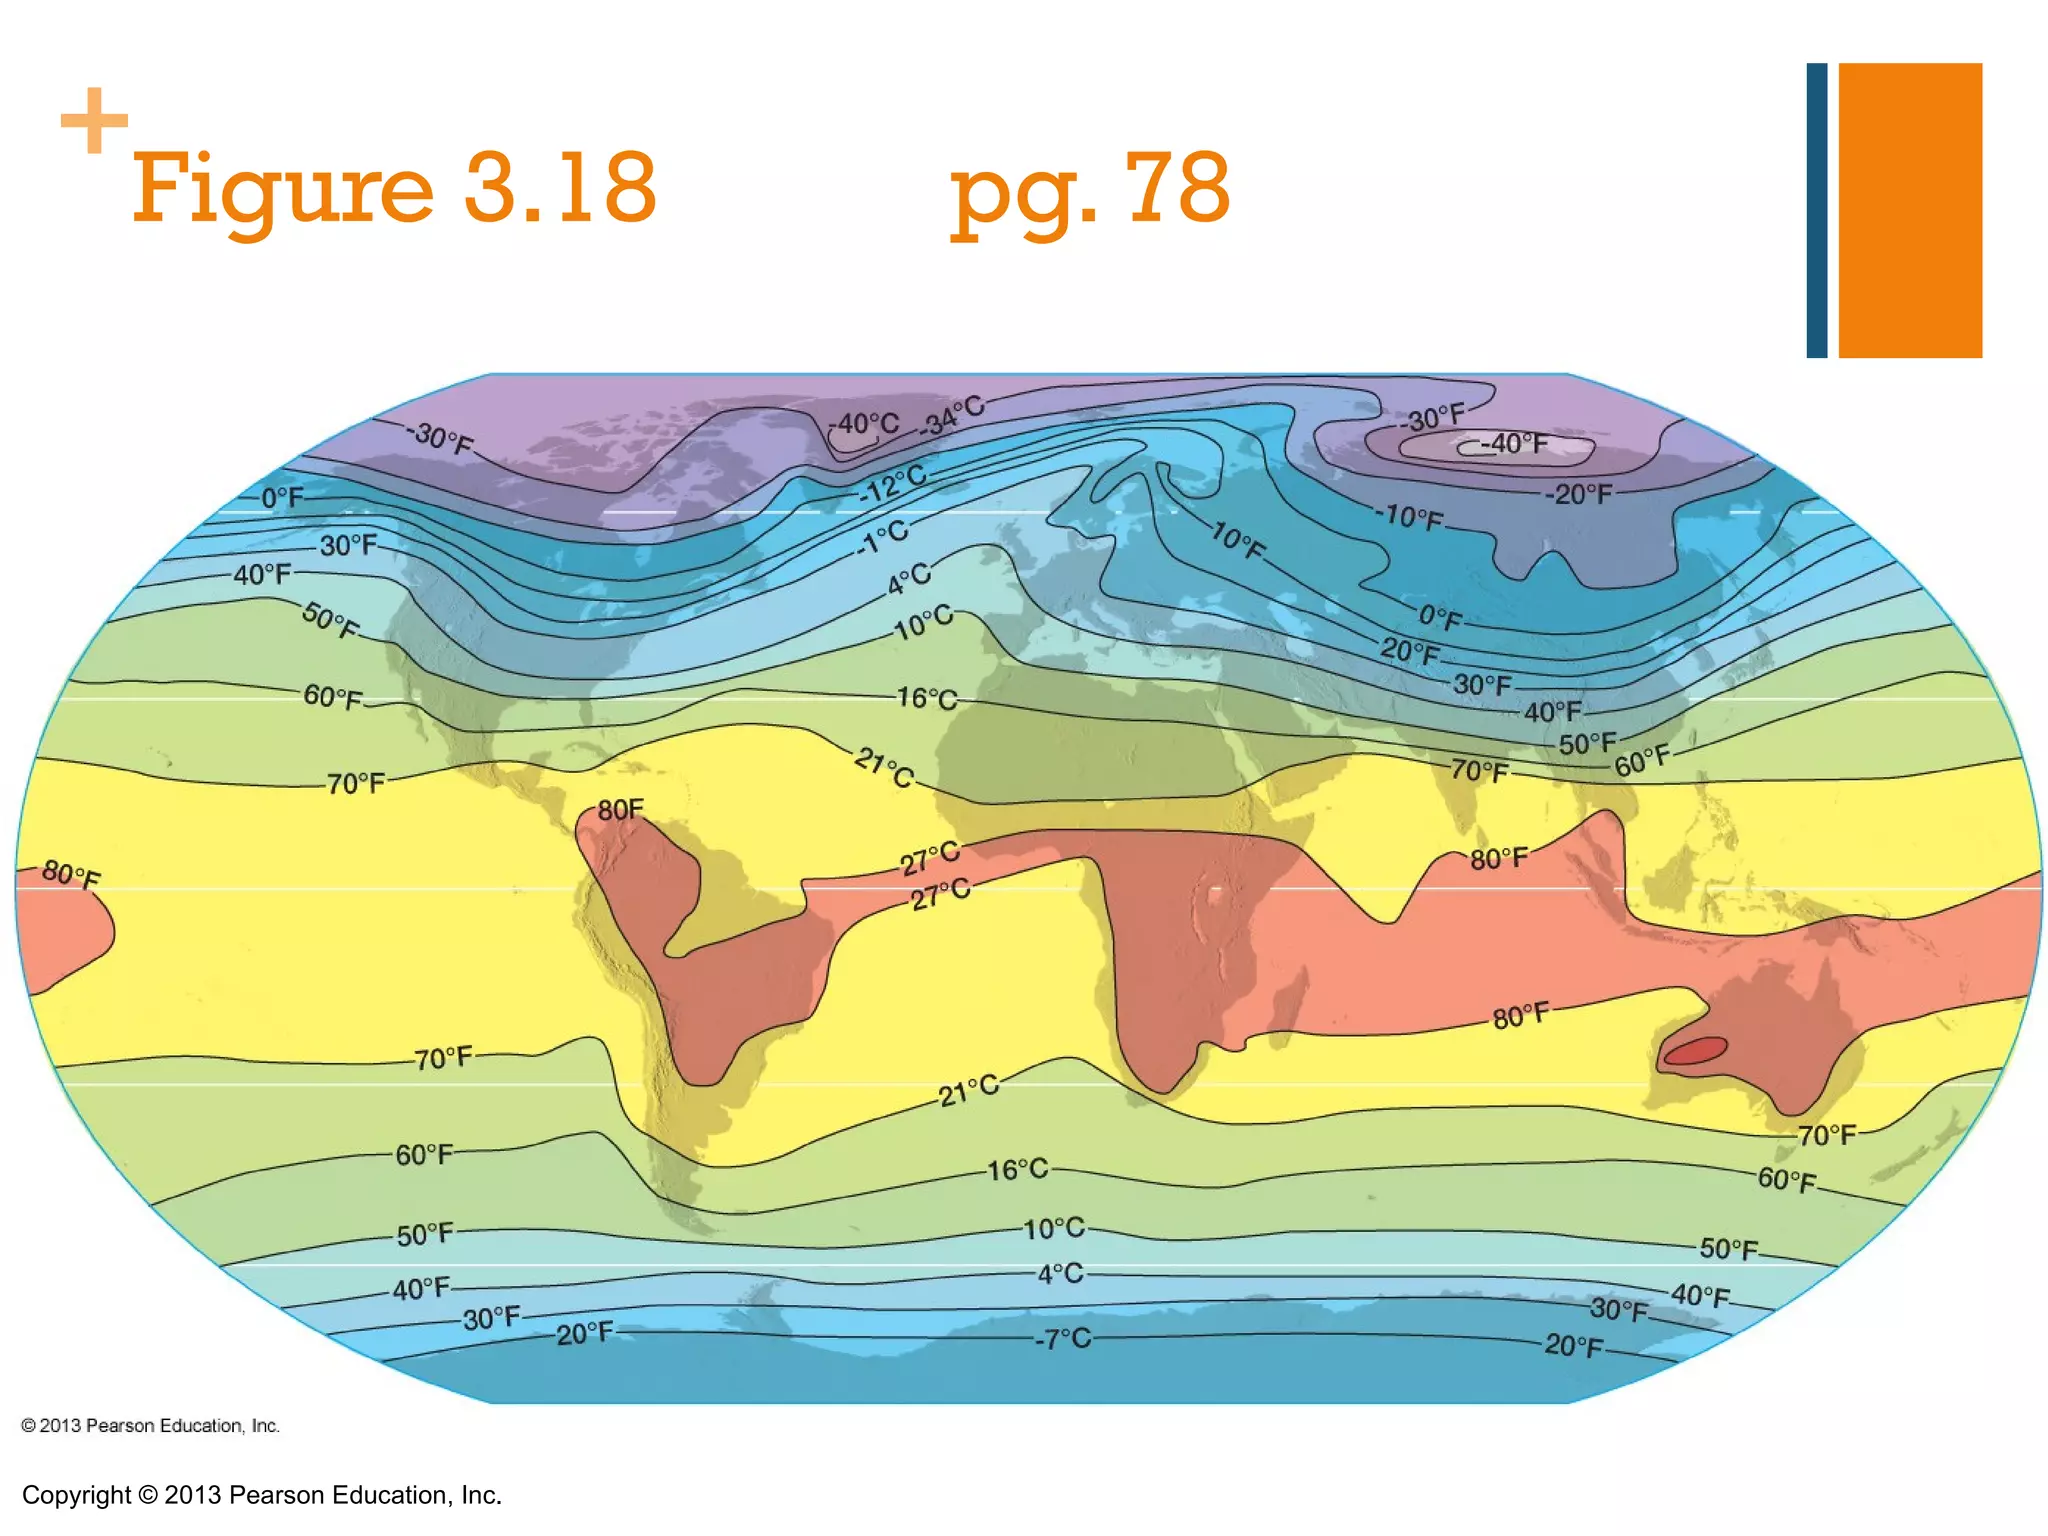
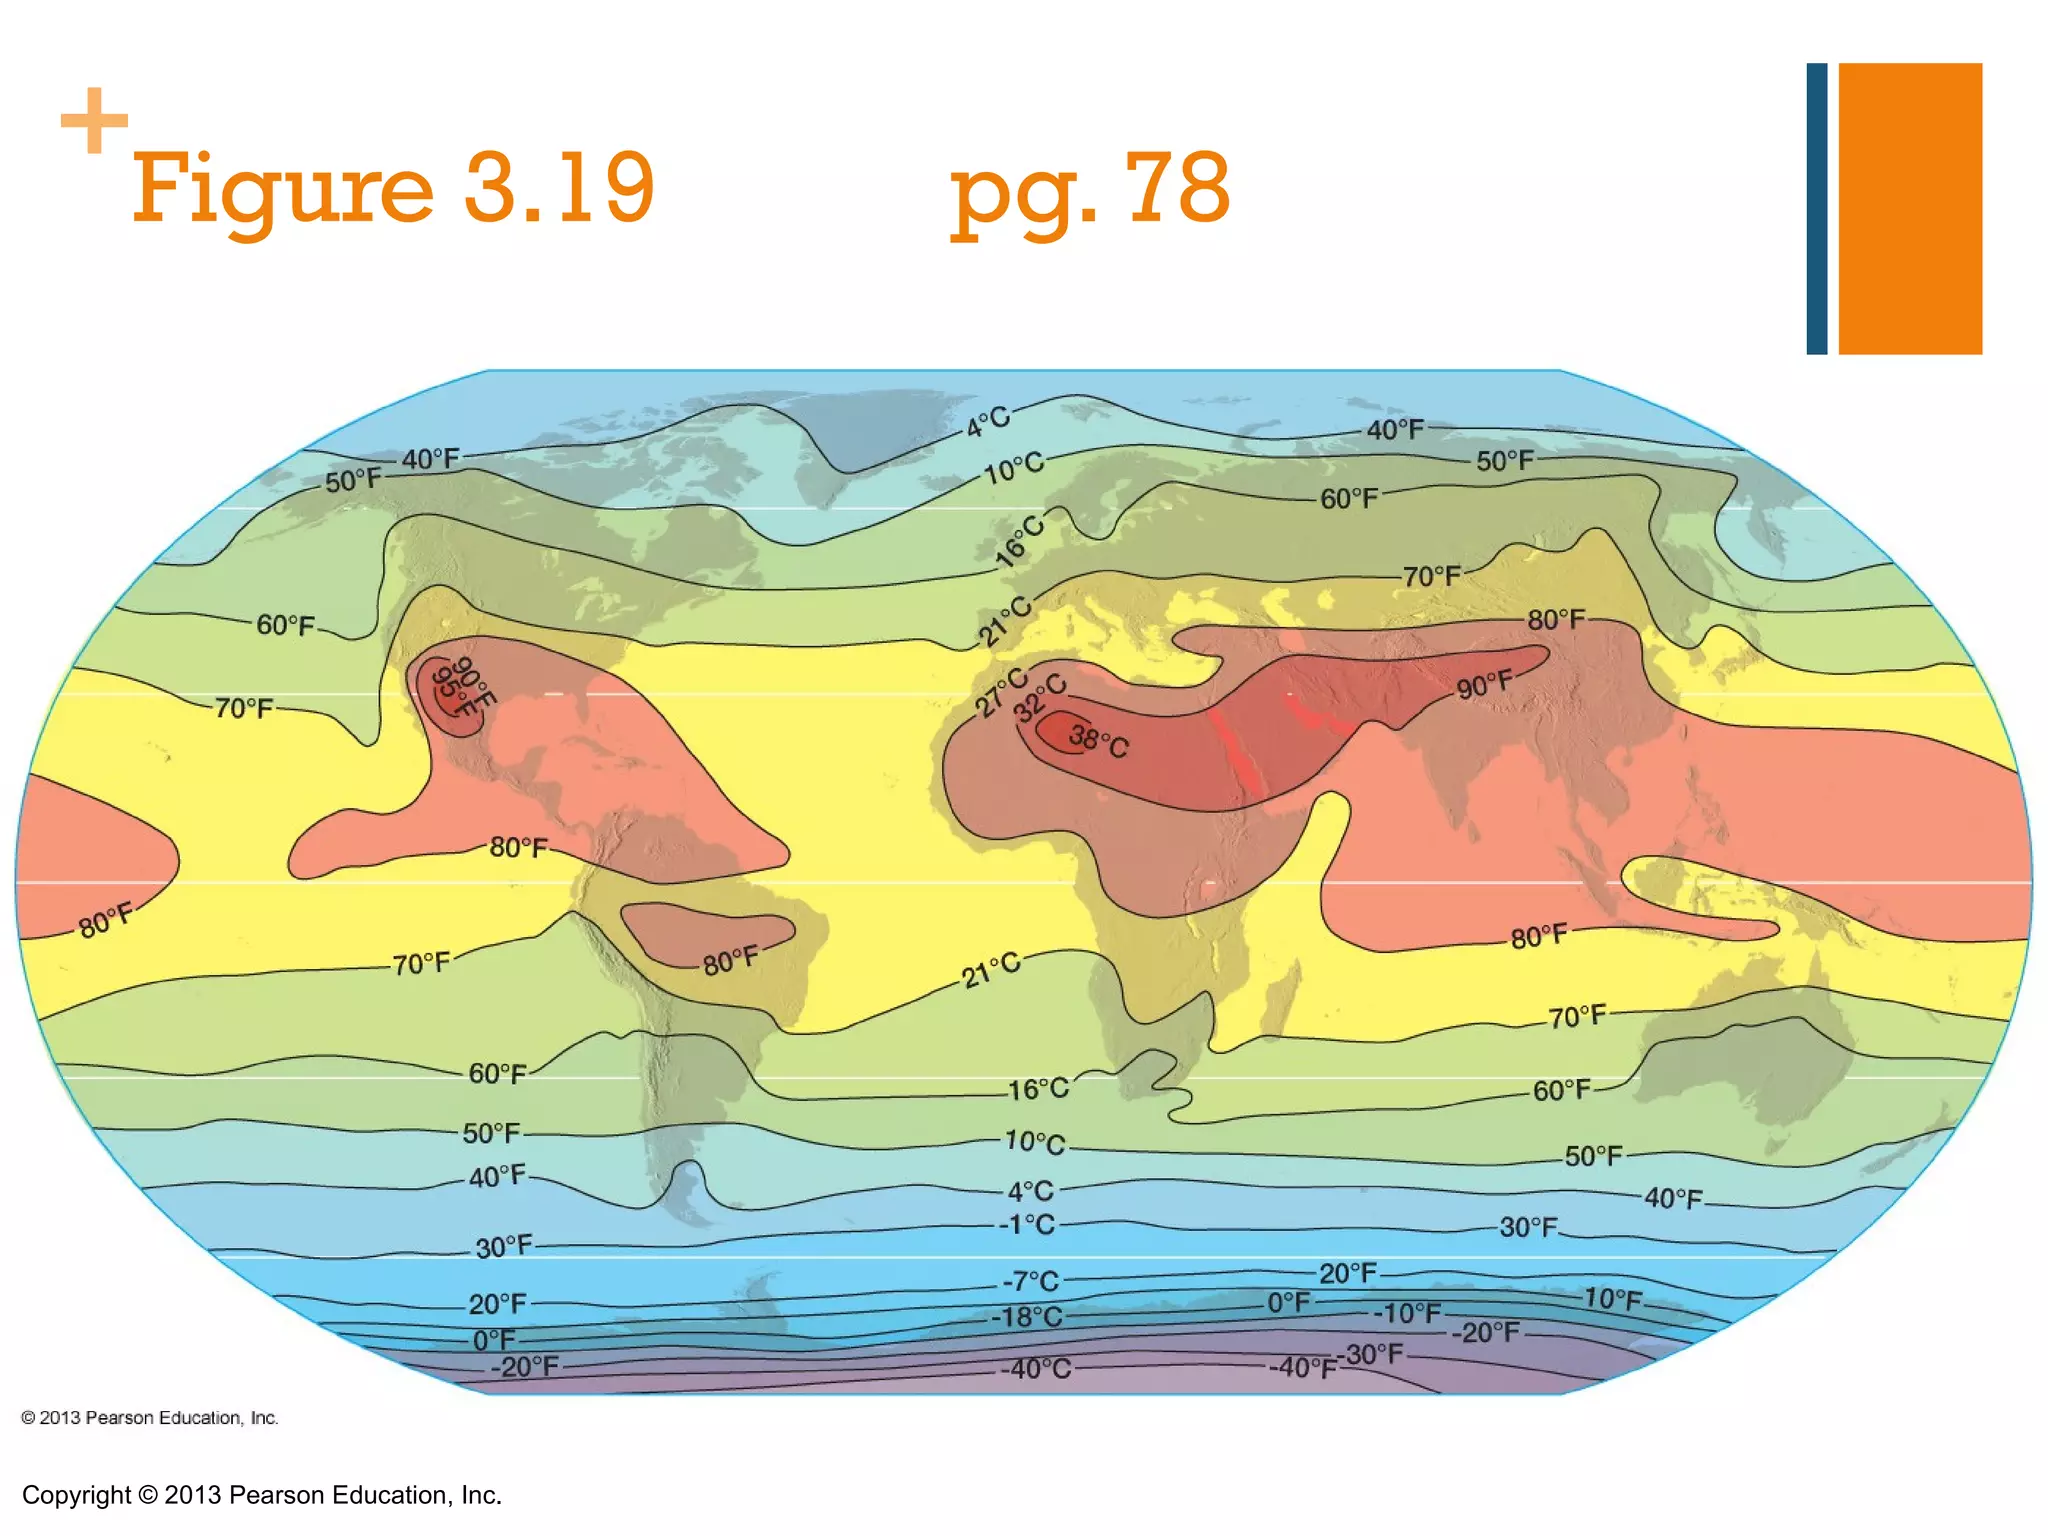
3) Additional factors like land/water differences, ocean currents, altitude, windward/leeward coasts, and the global distribution of temperatures.
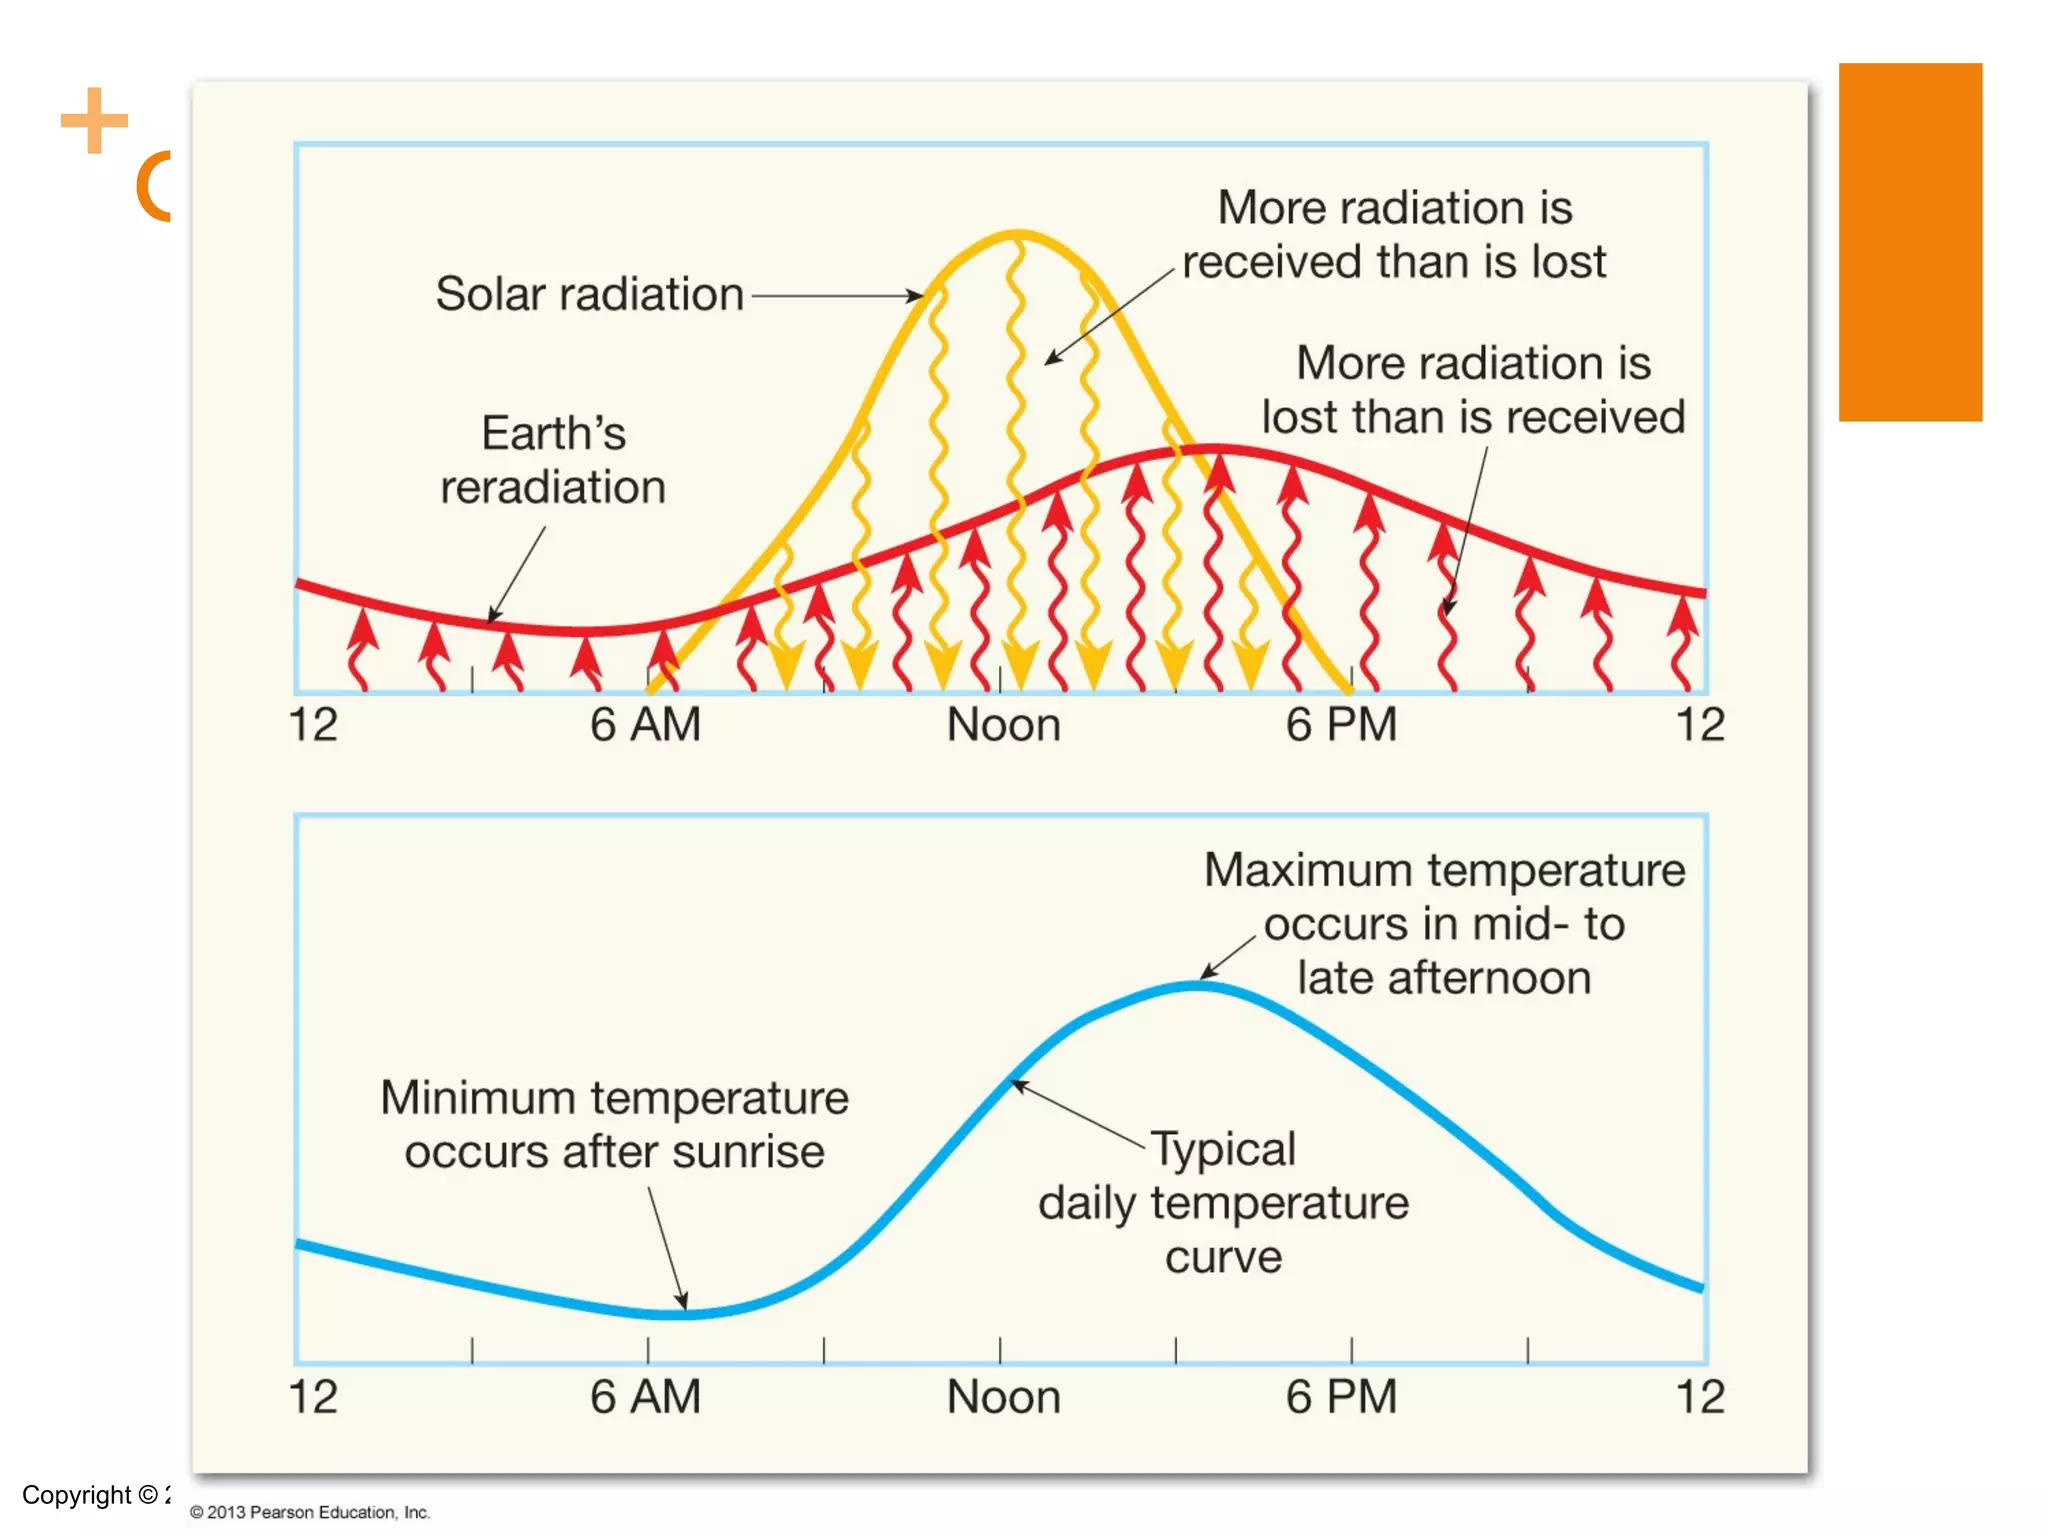
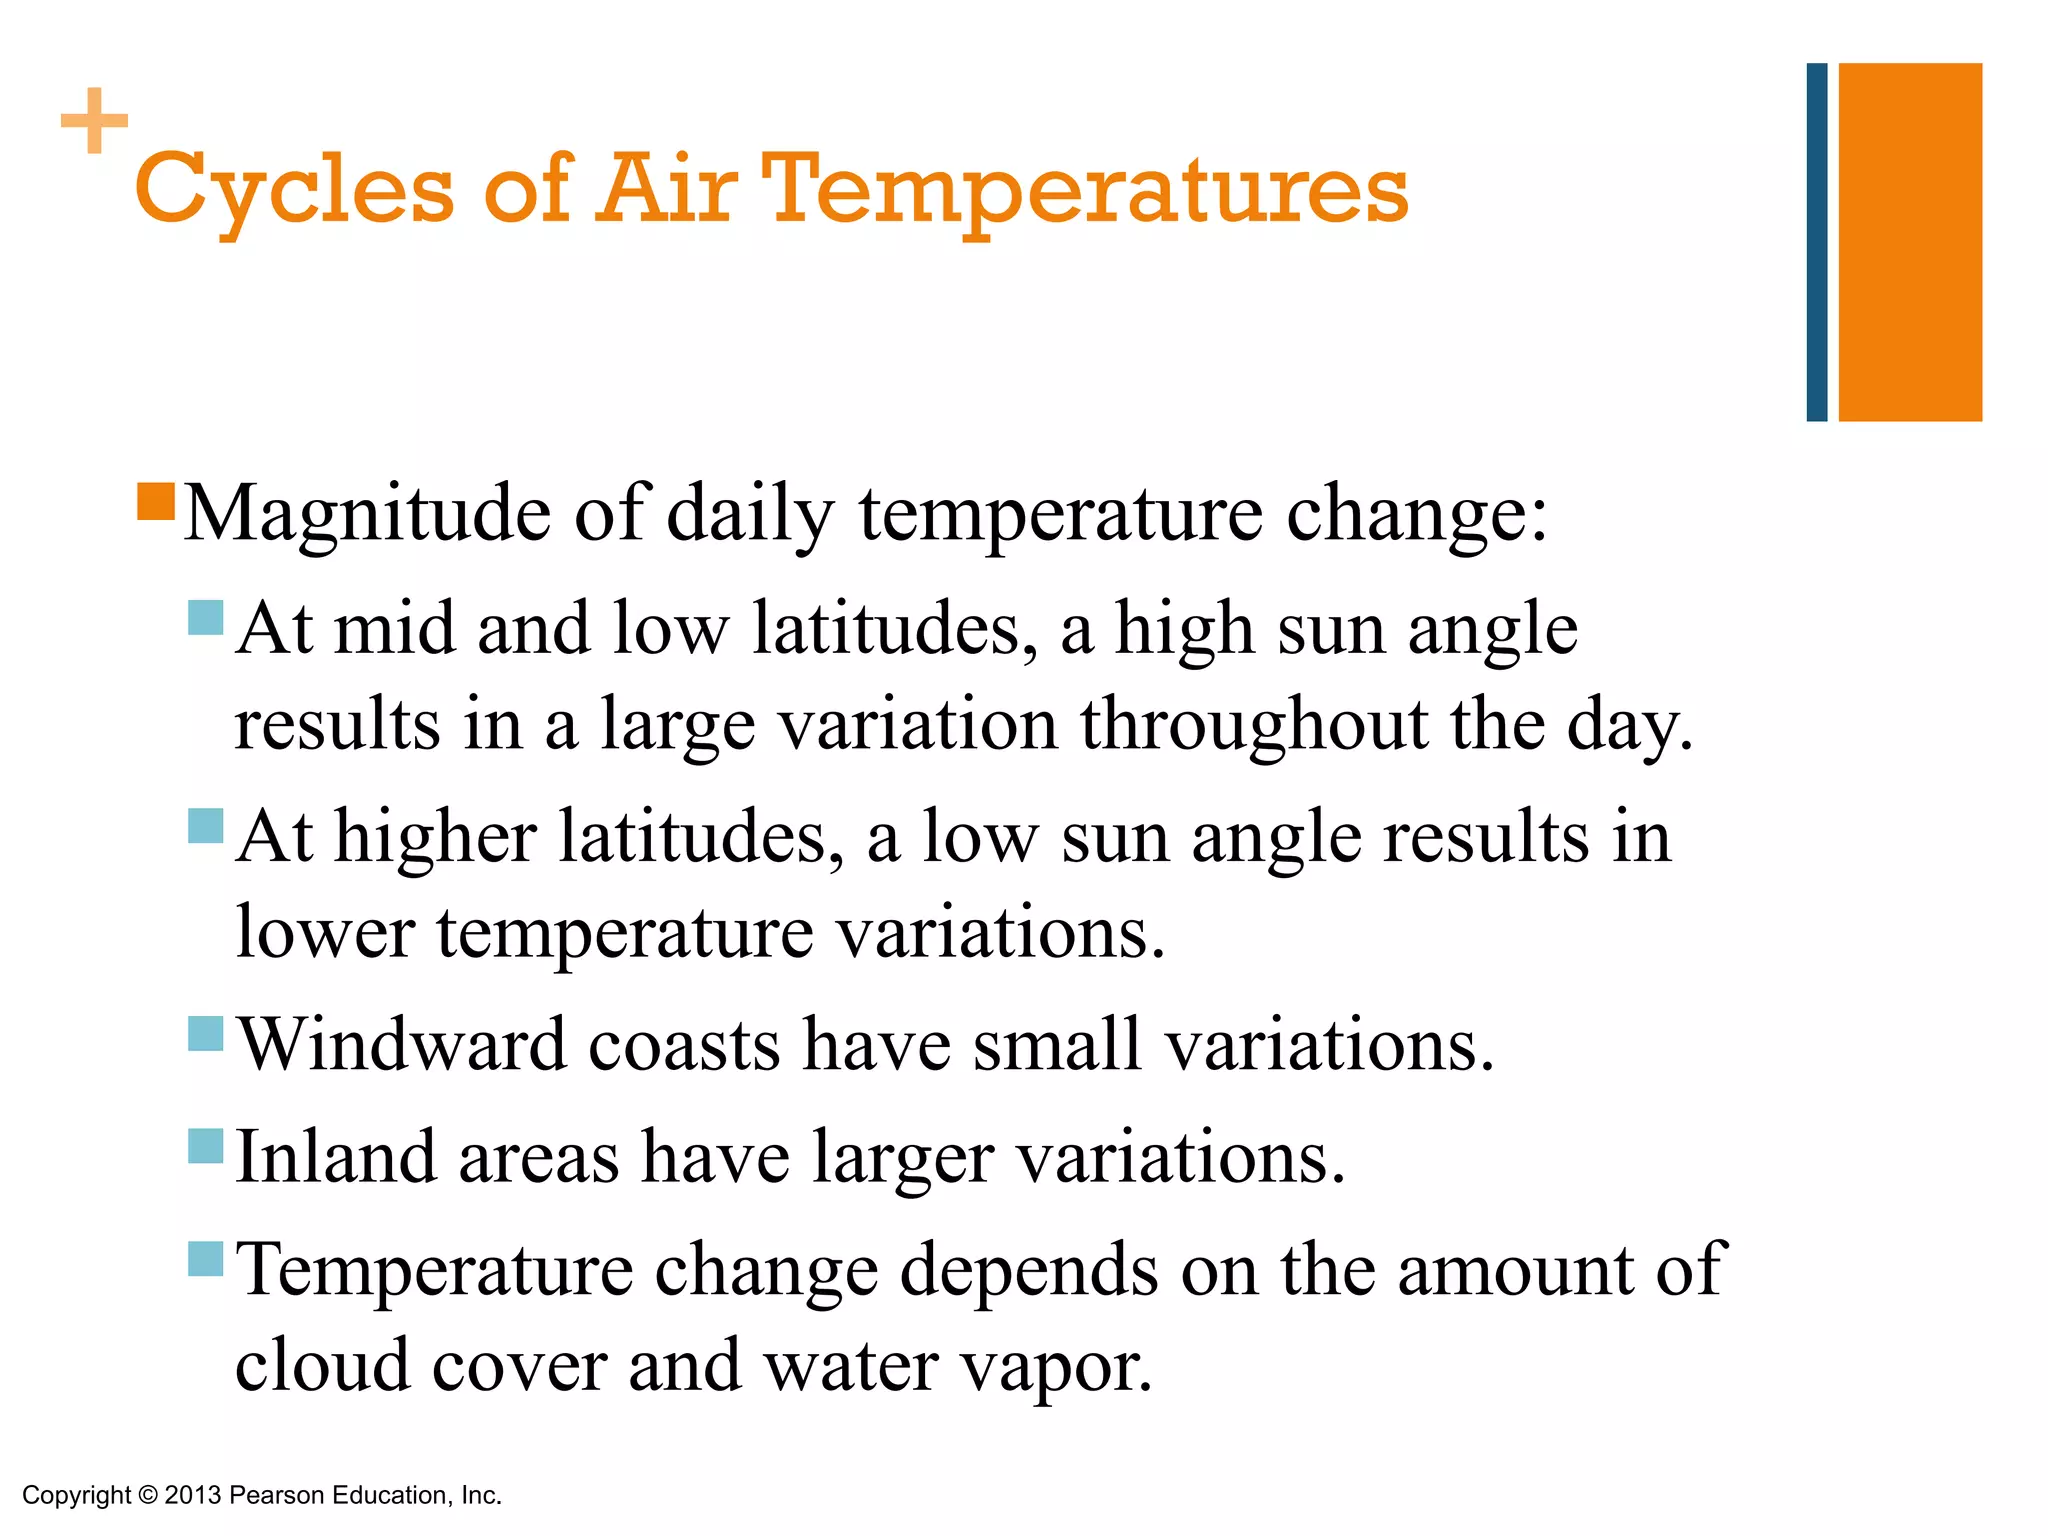
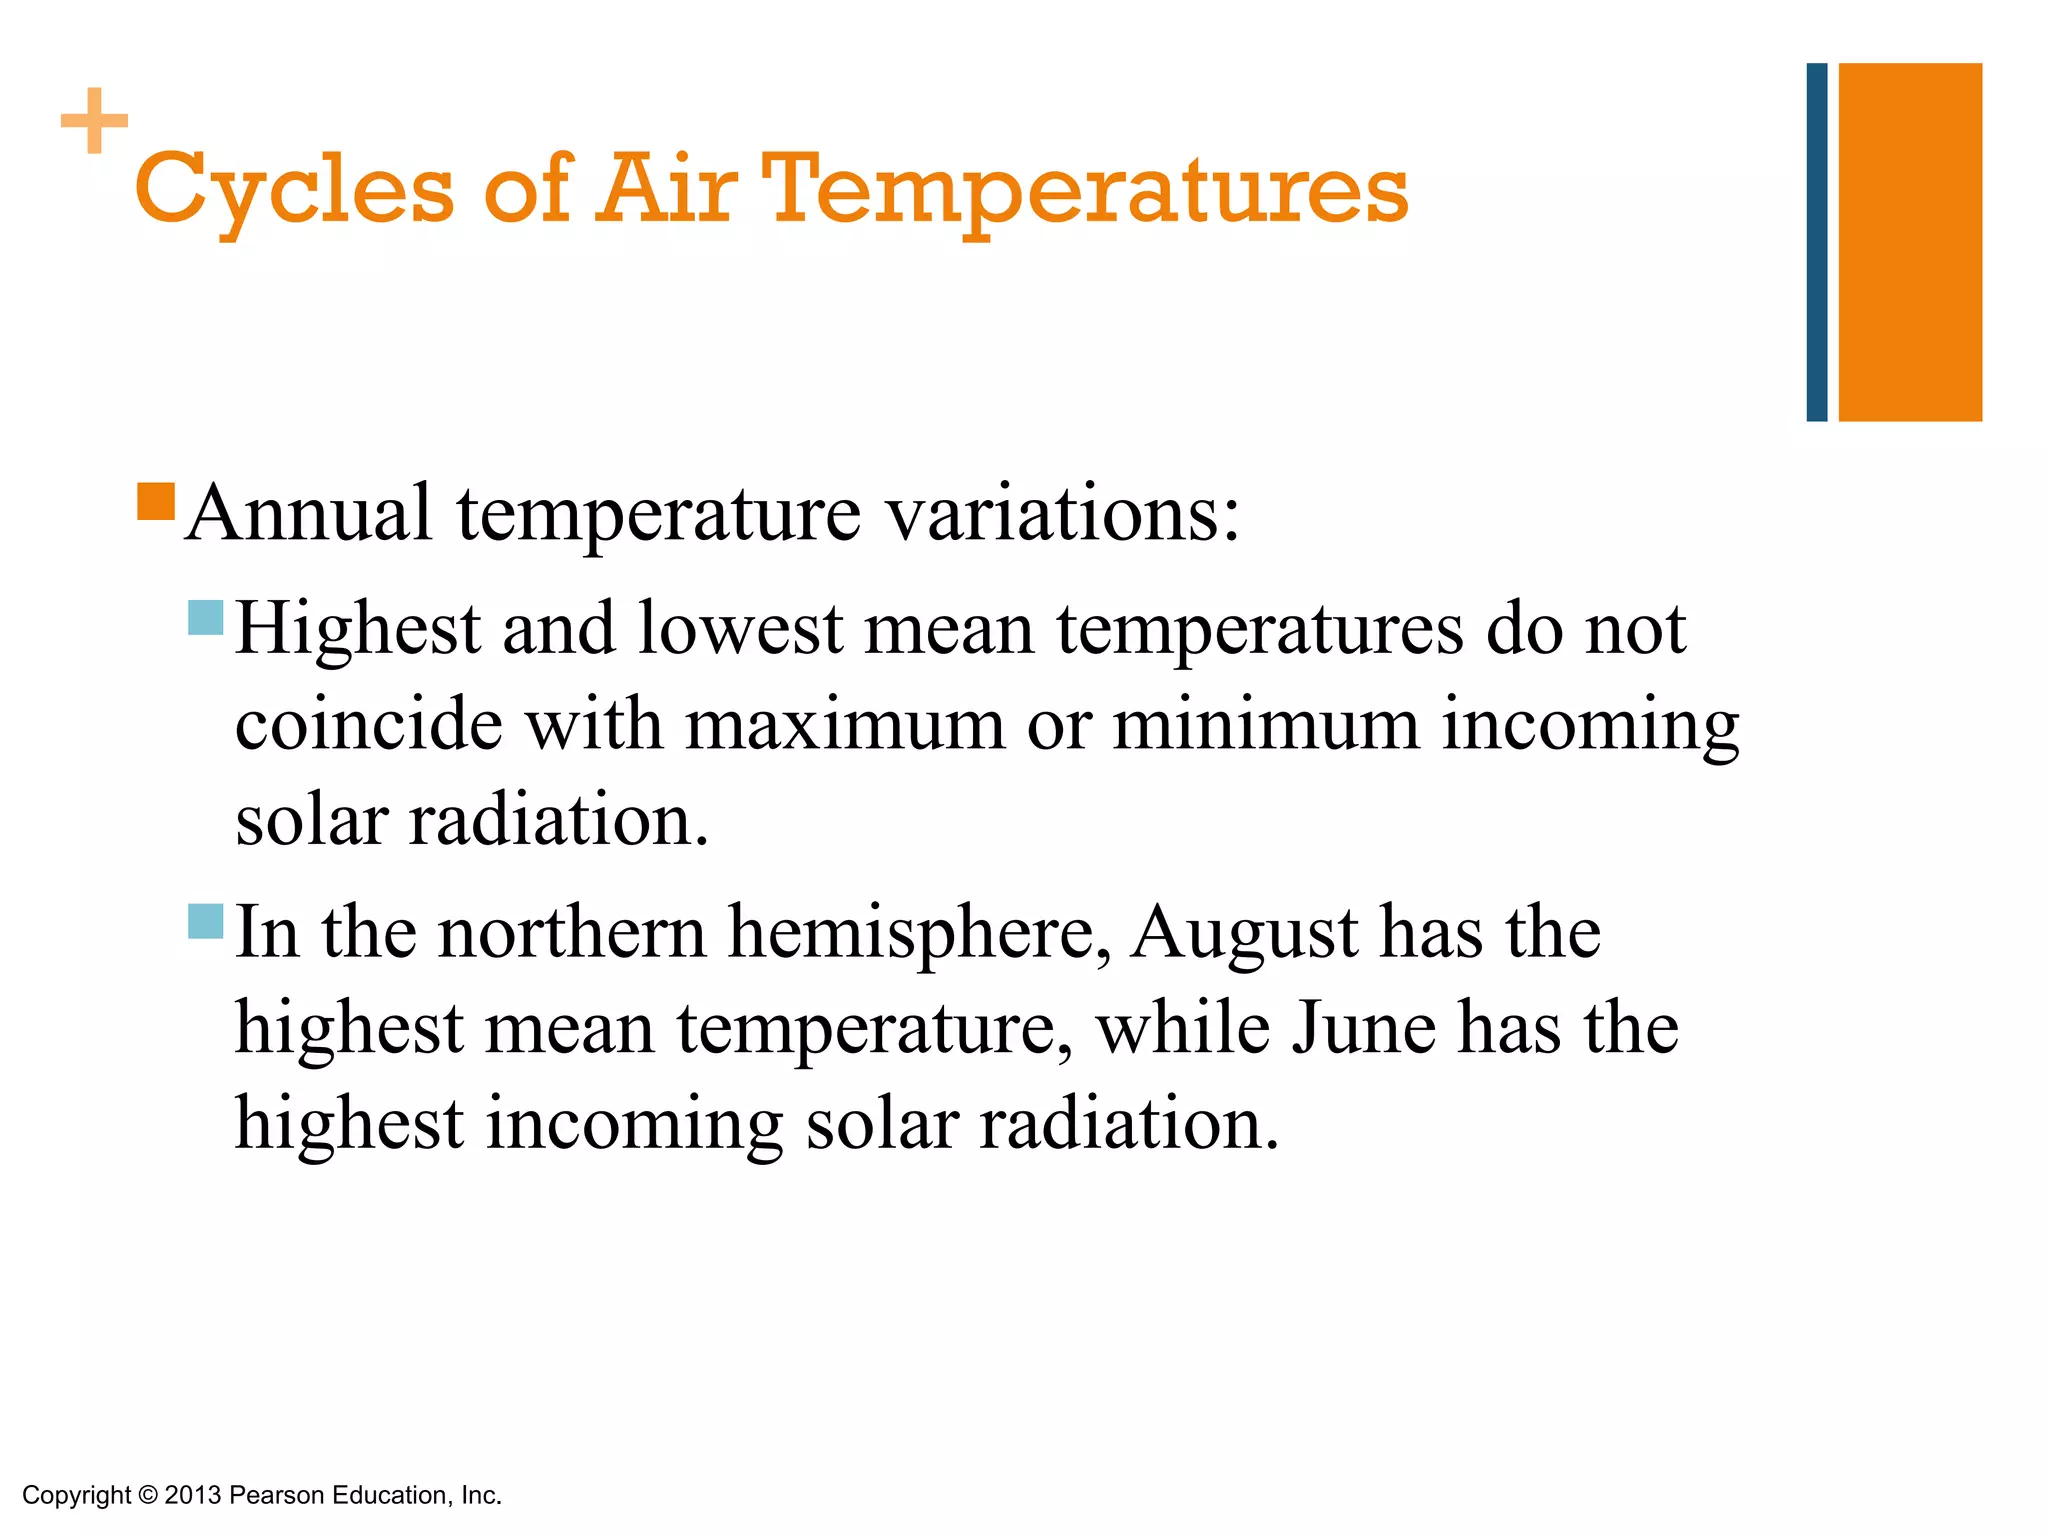
4) Cycles of air temperatures including daily and annual variations.
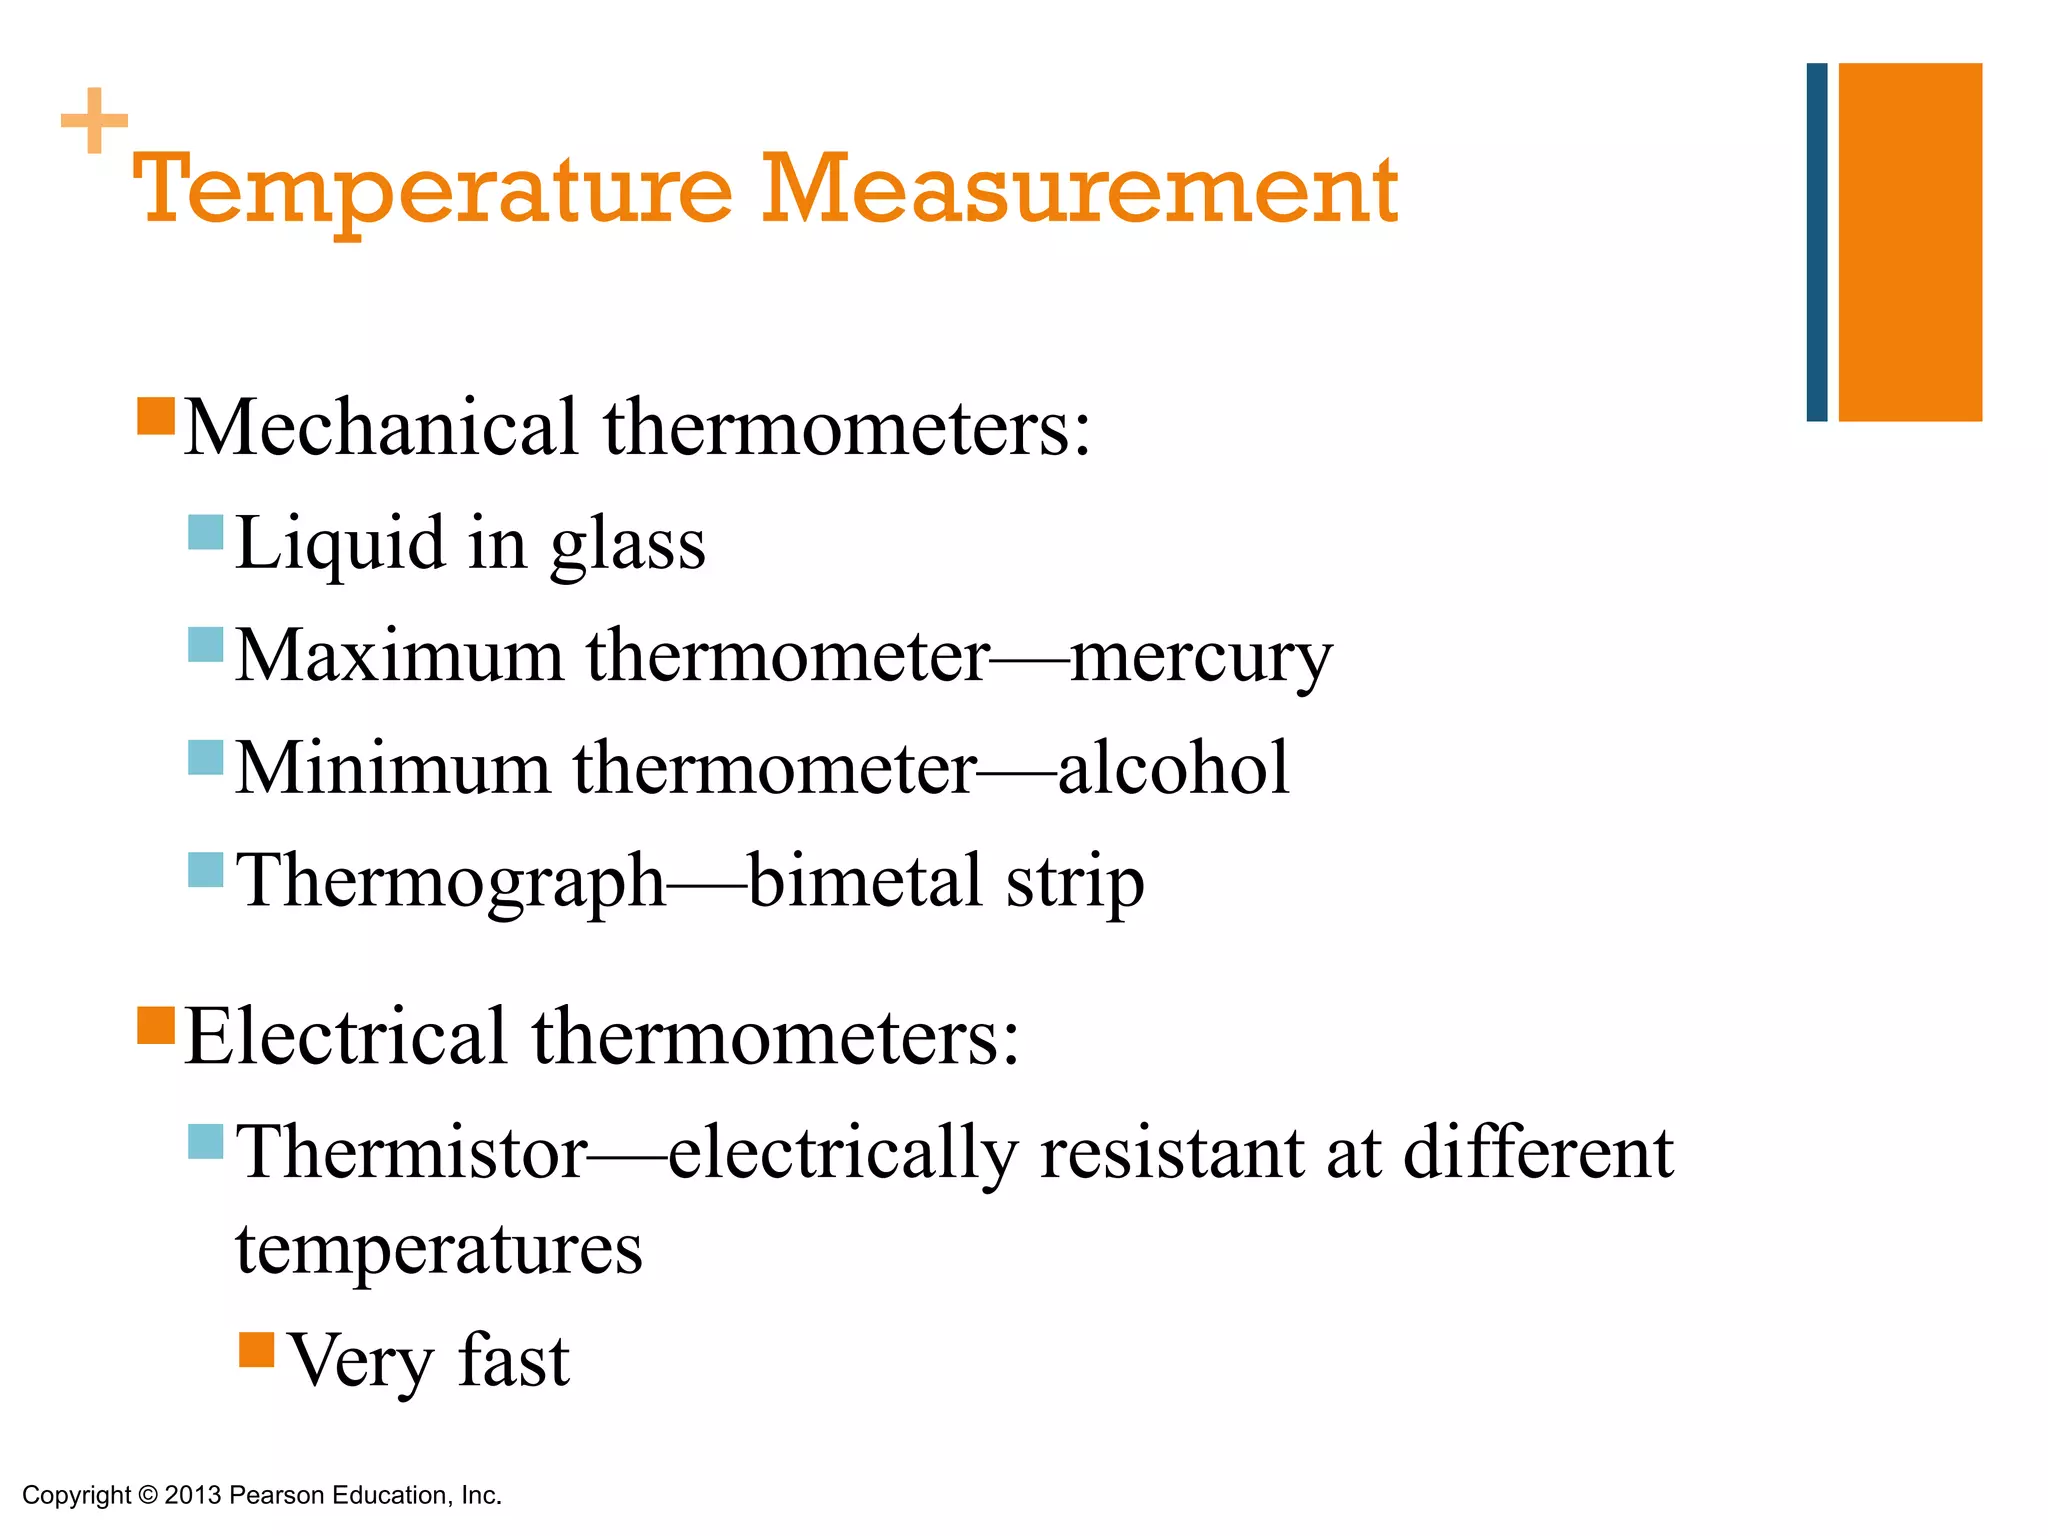
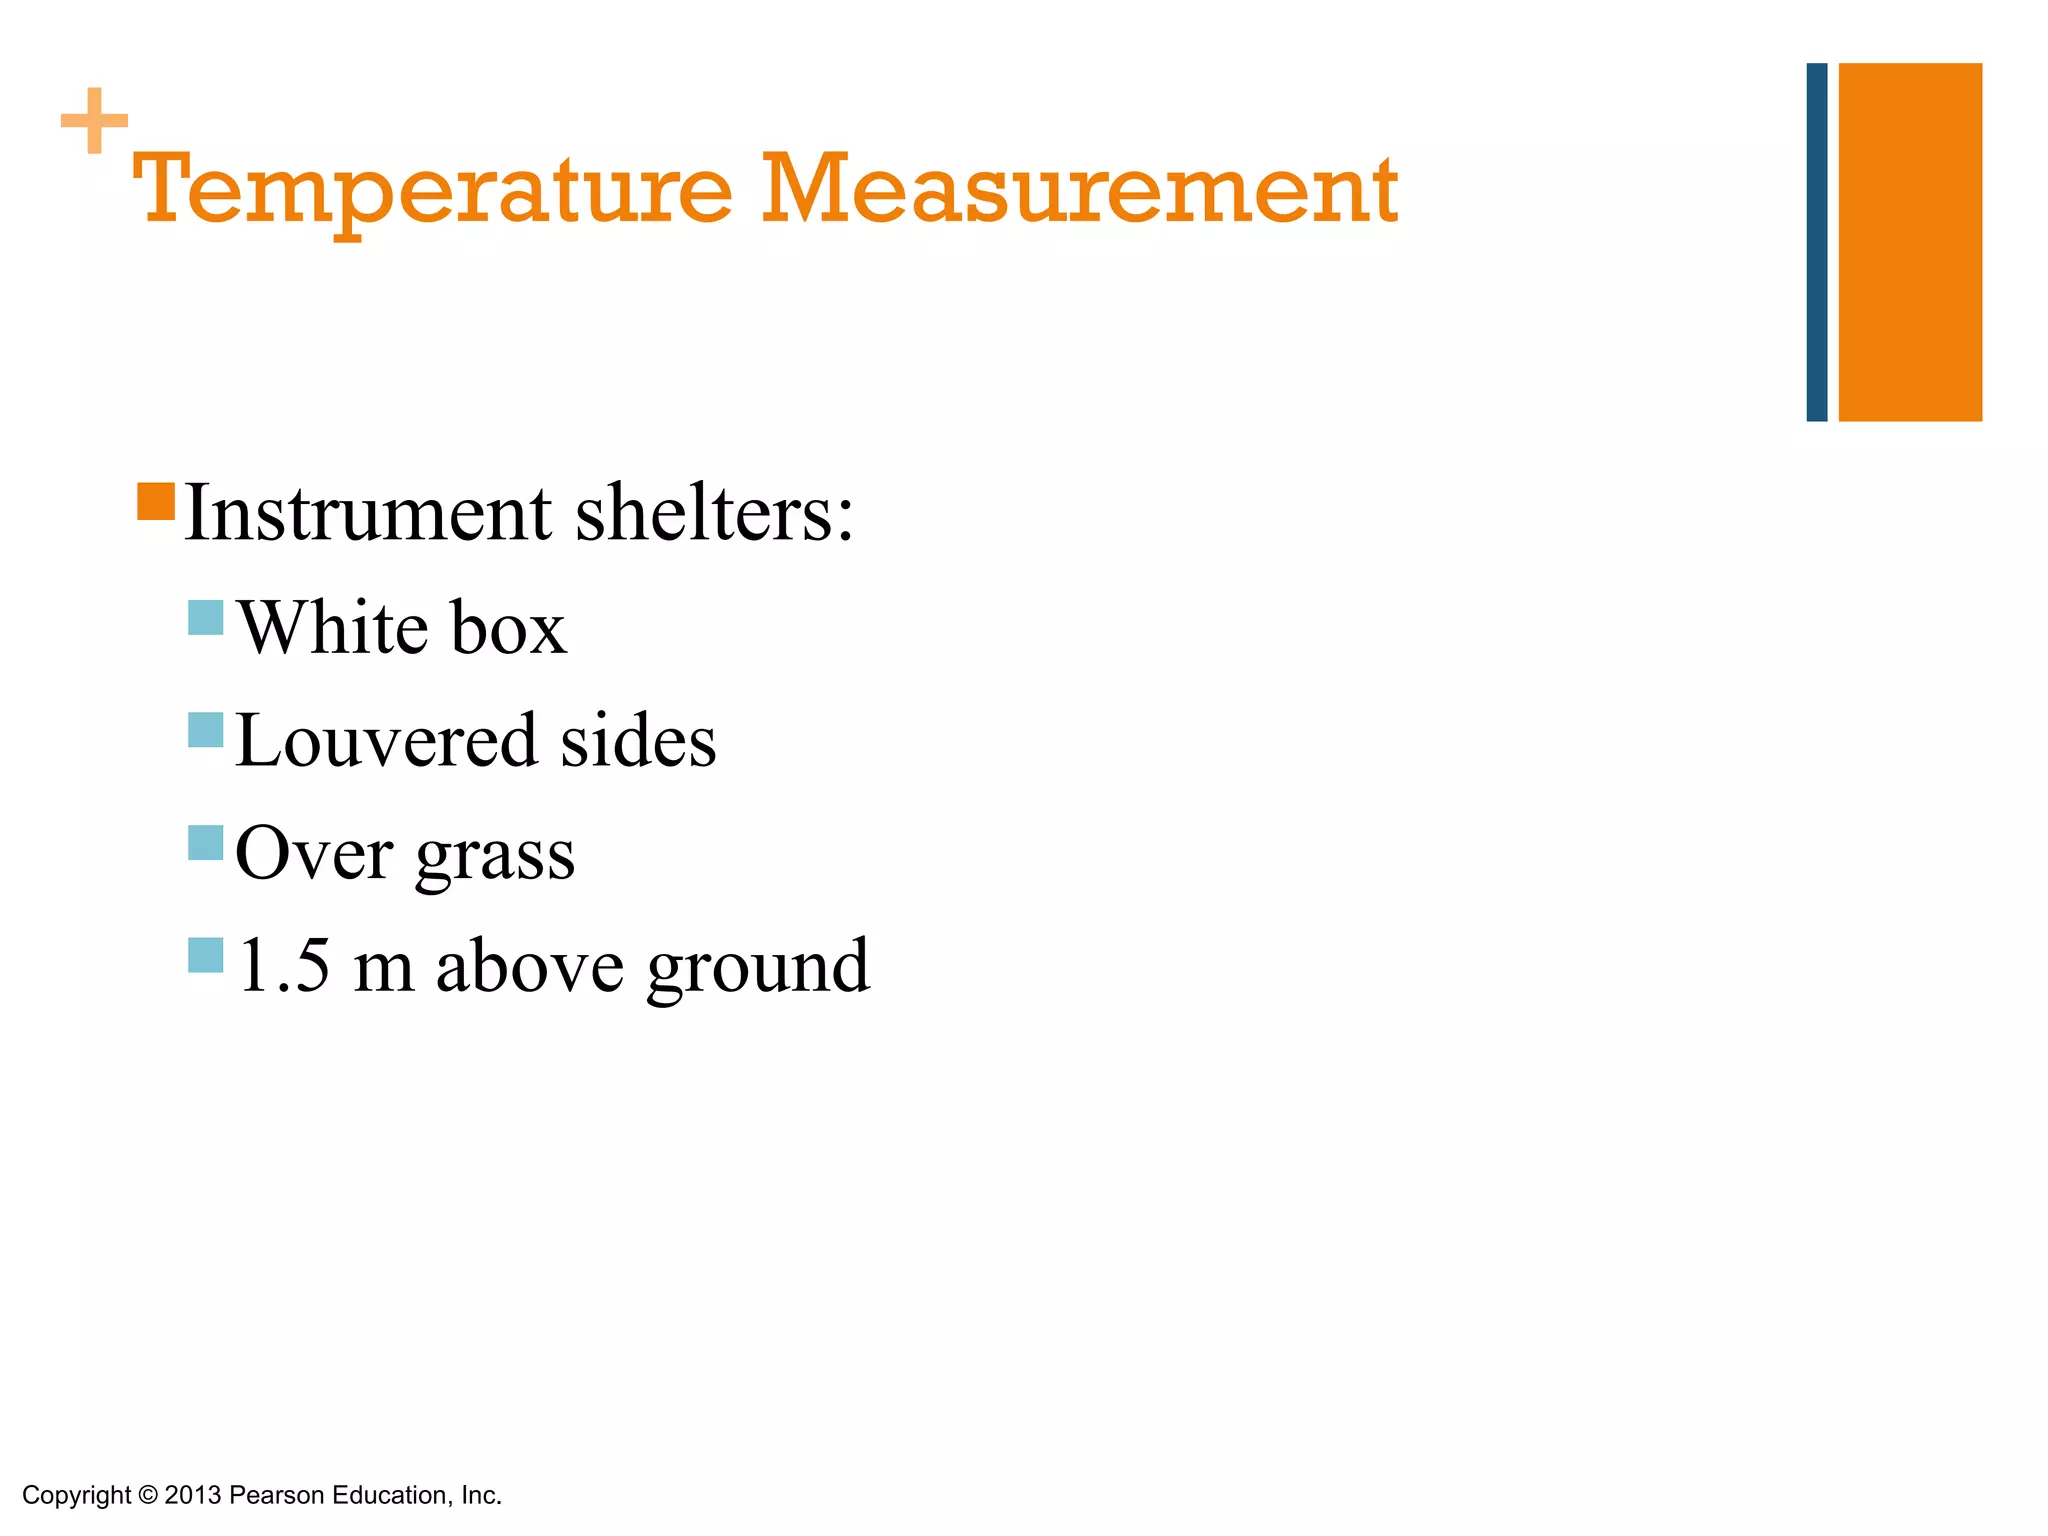
5) Instruments used to measure temperature and their shelters.
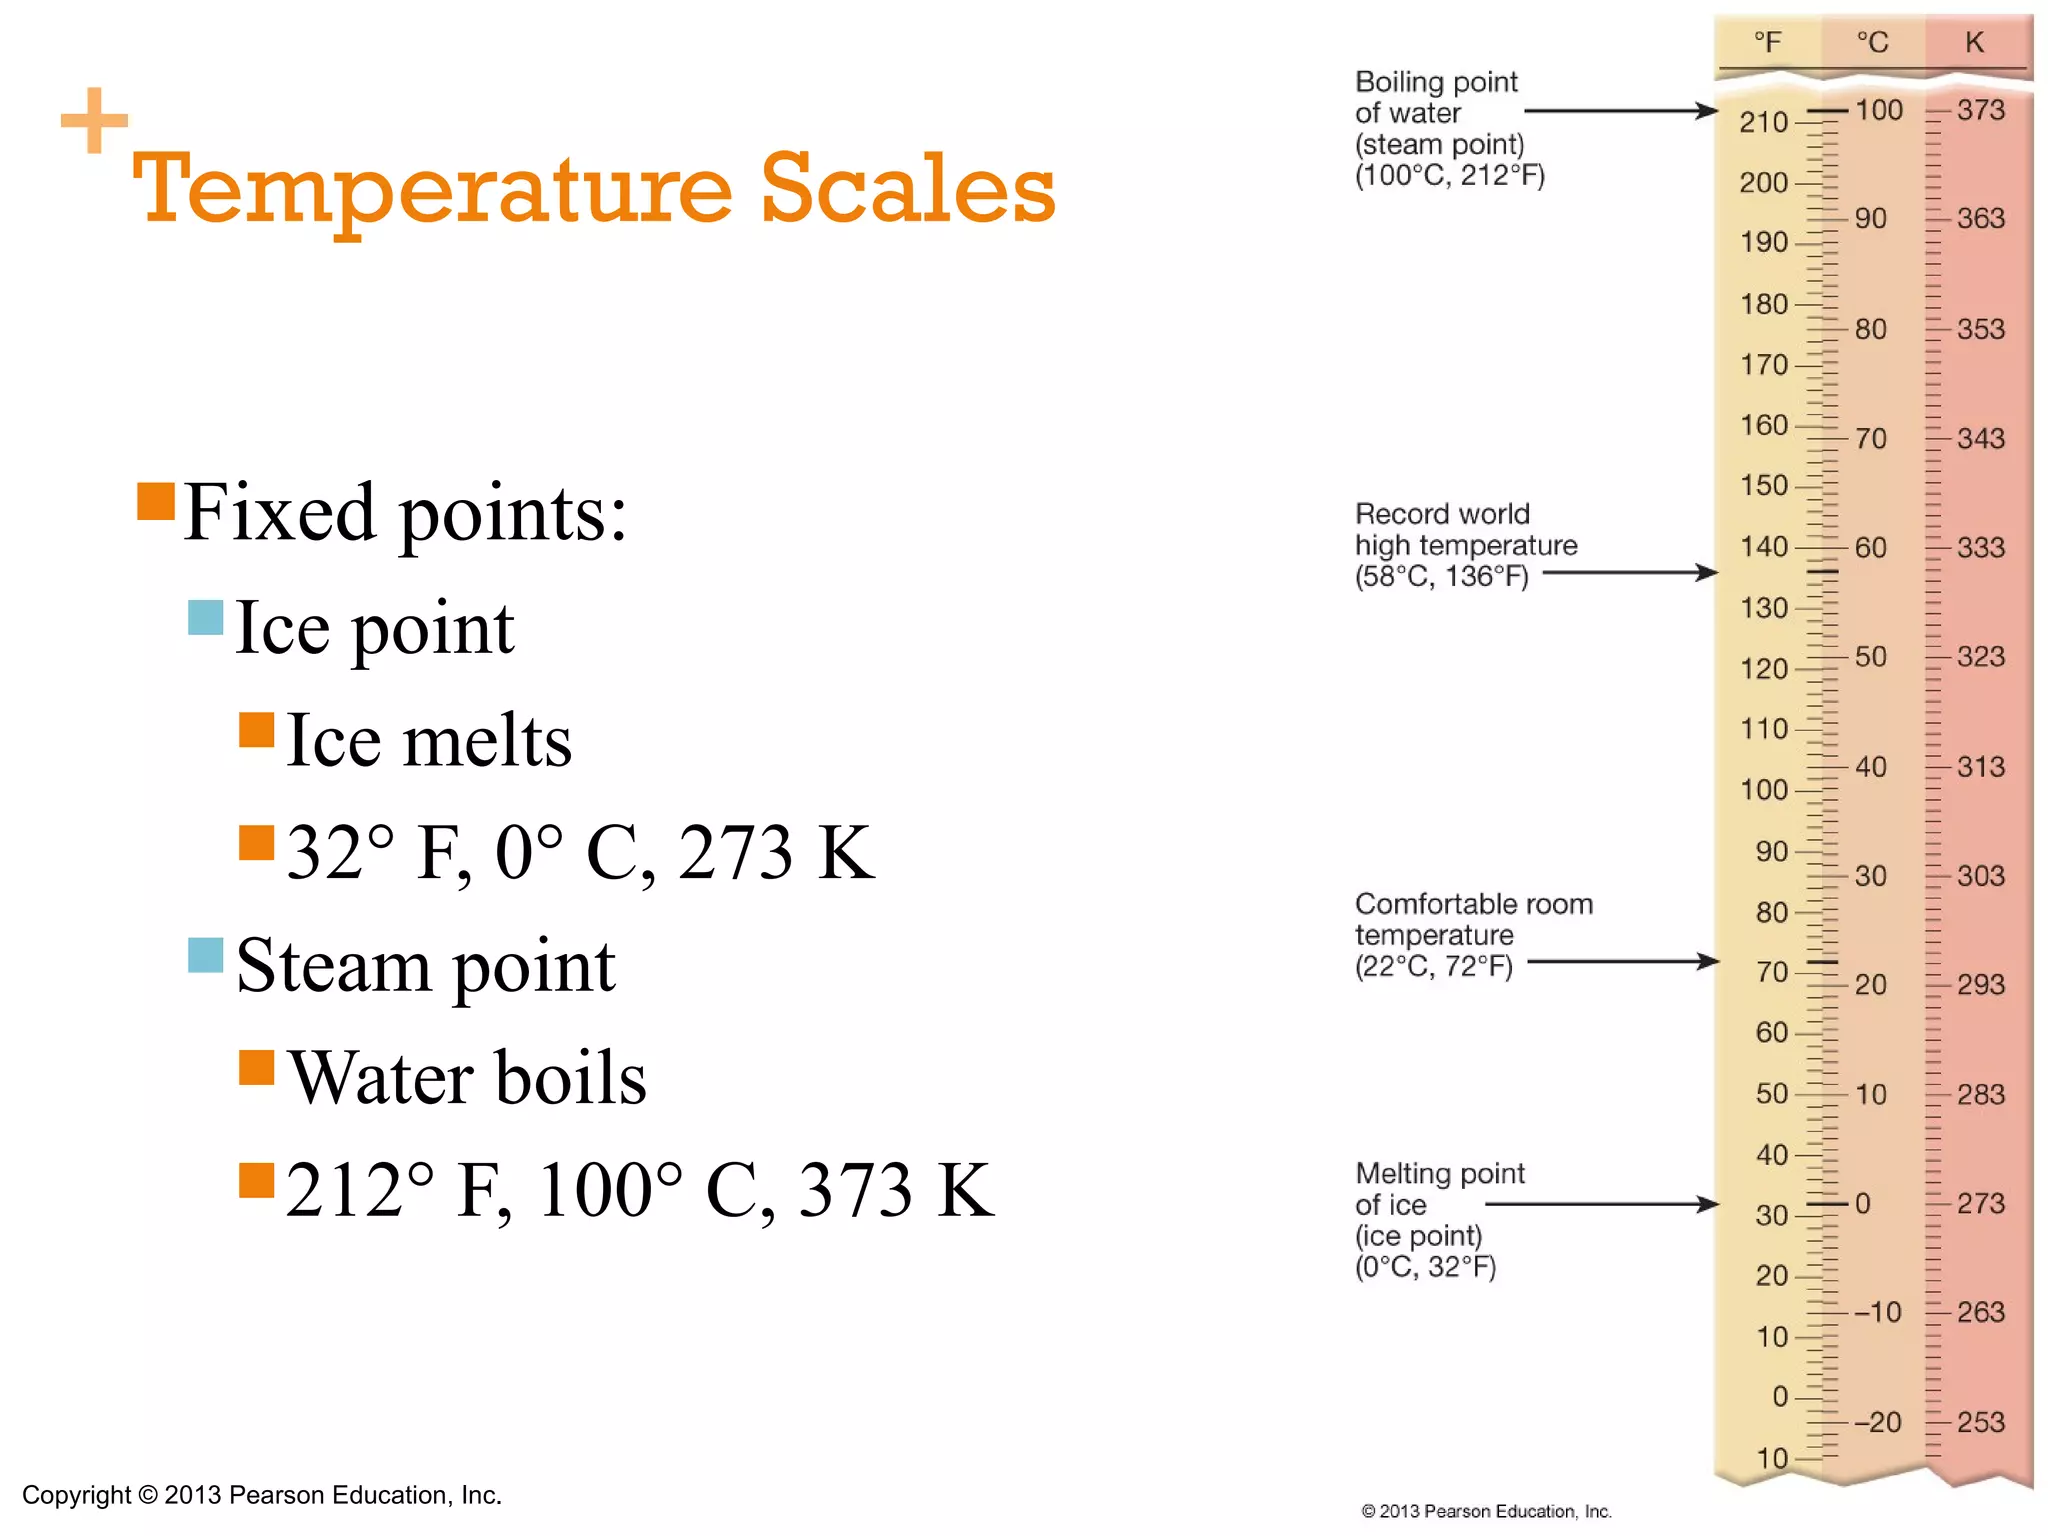
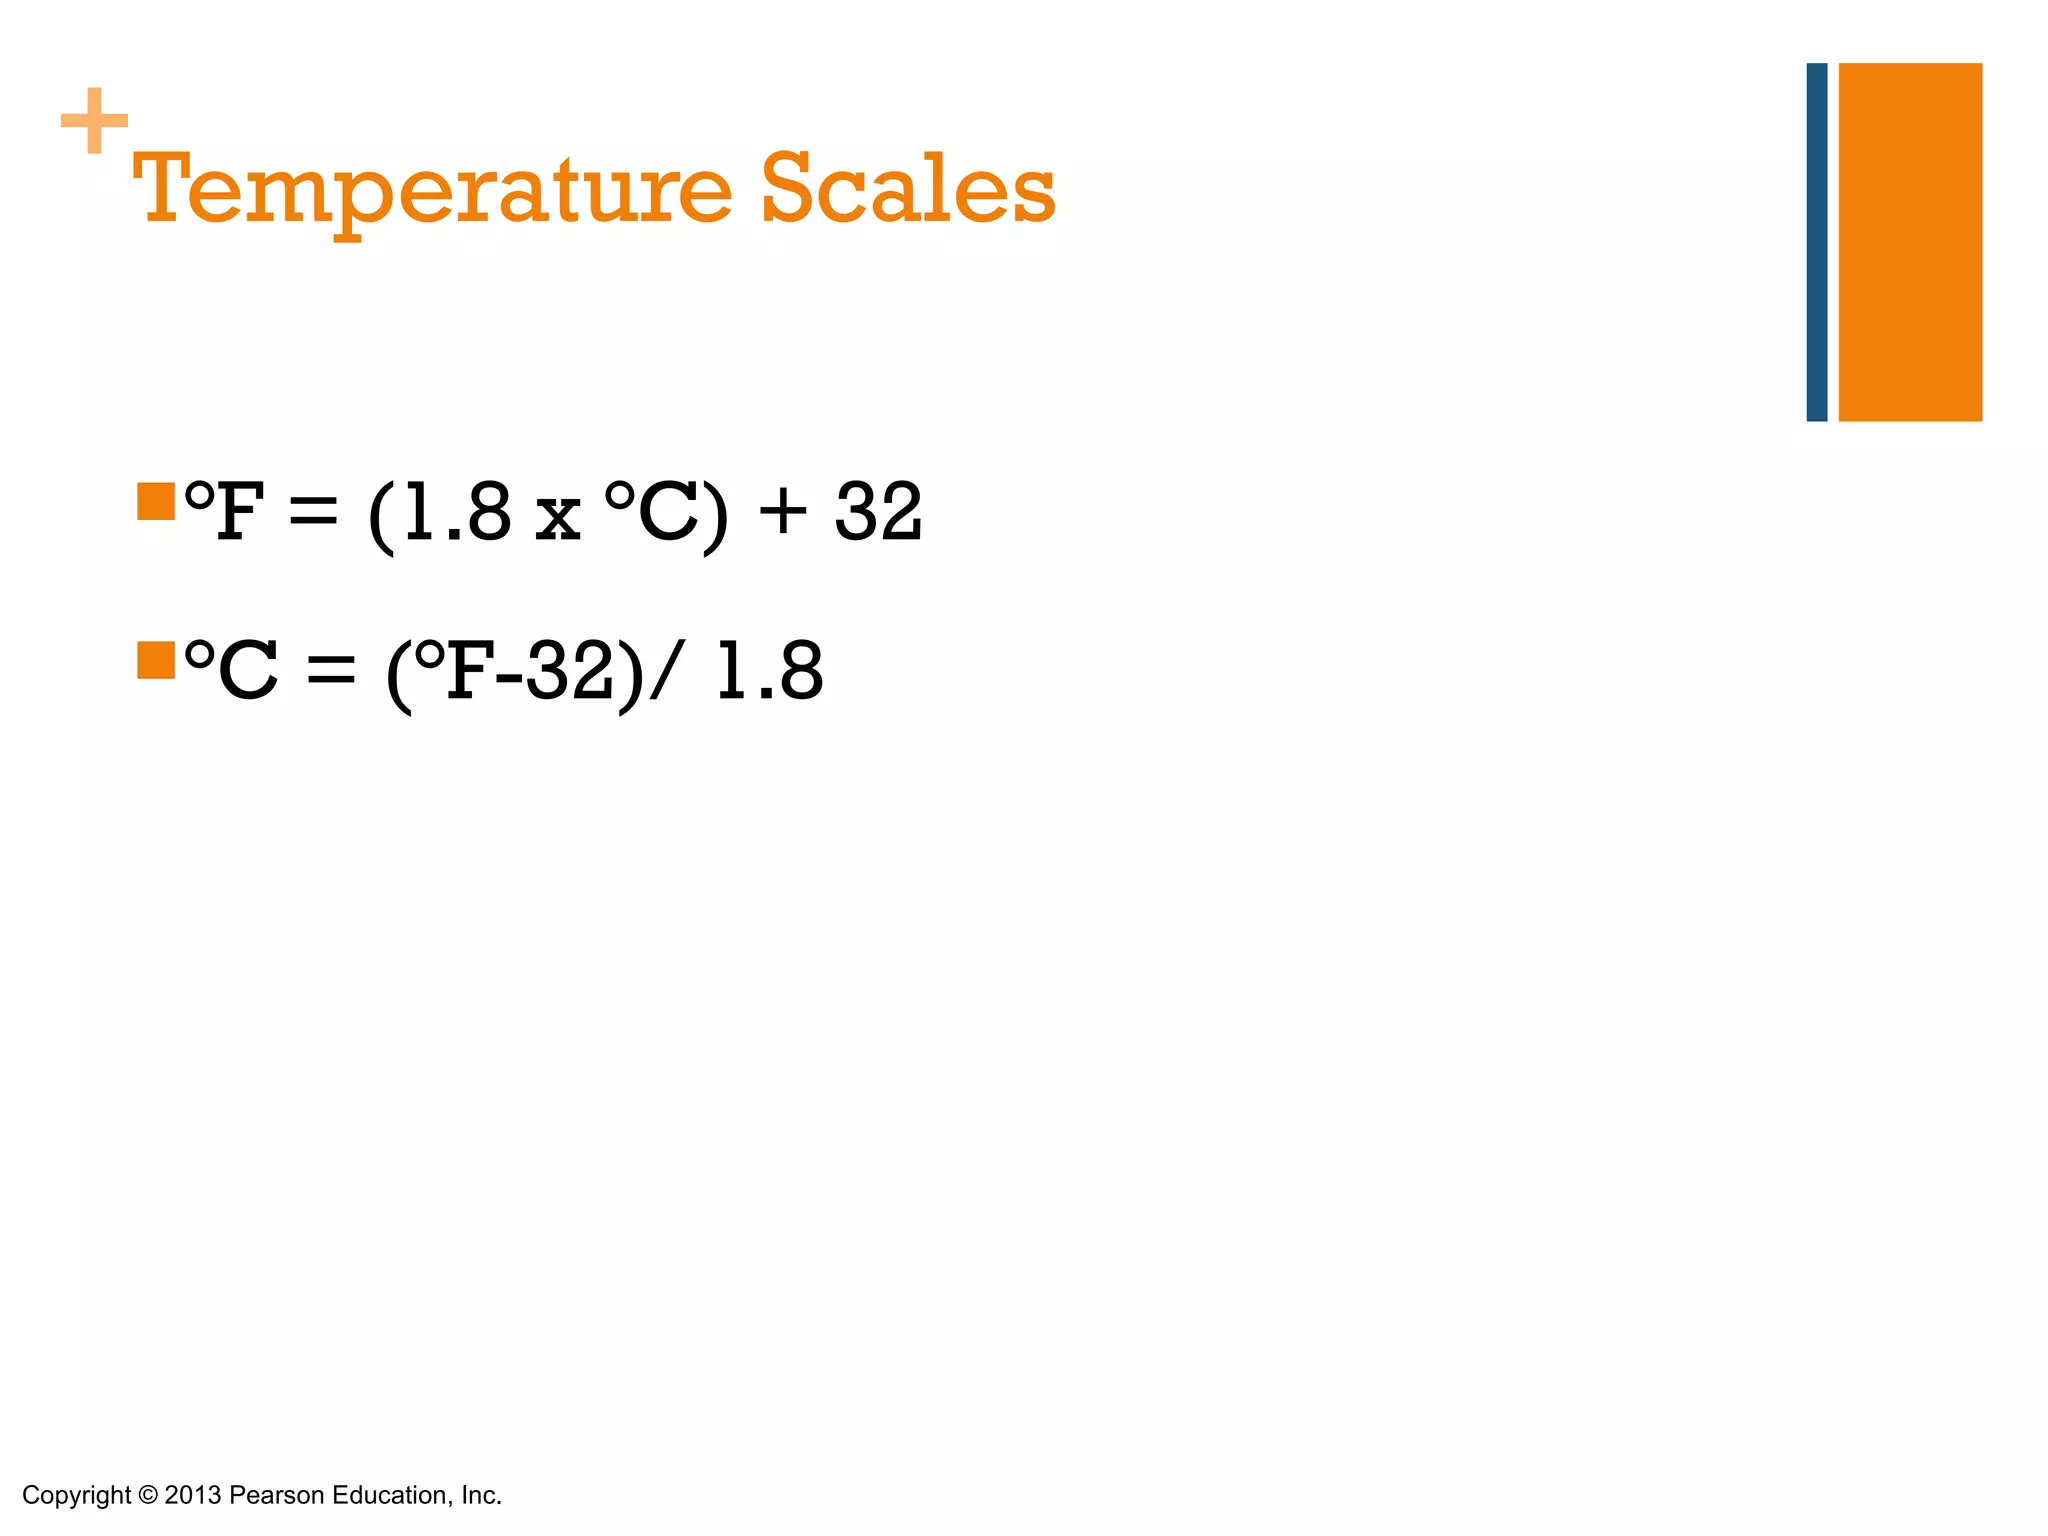
6) Common temperature scales and their reference points.
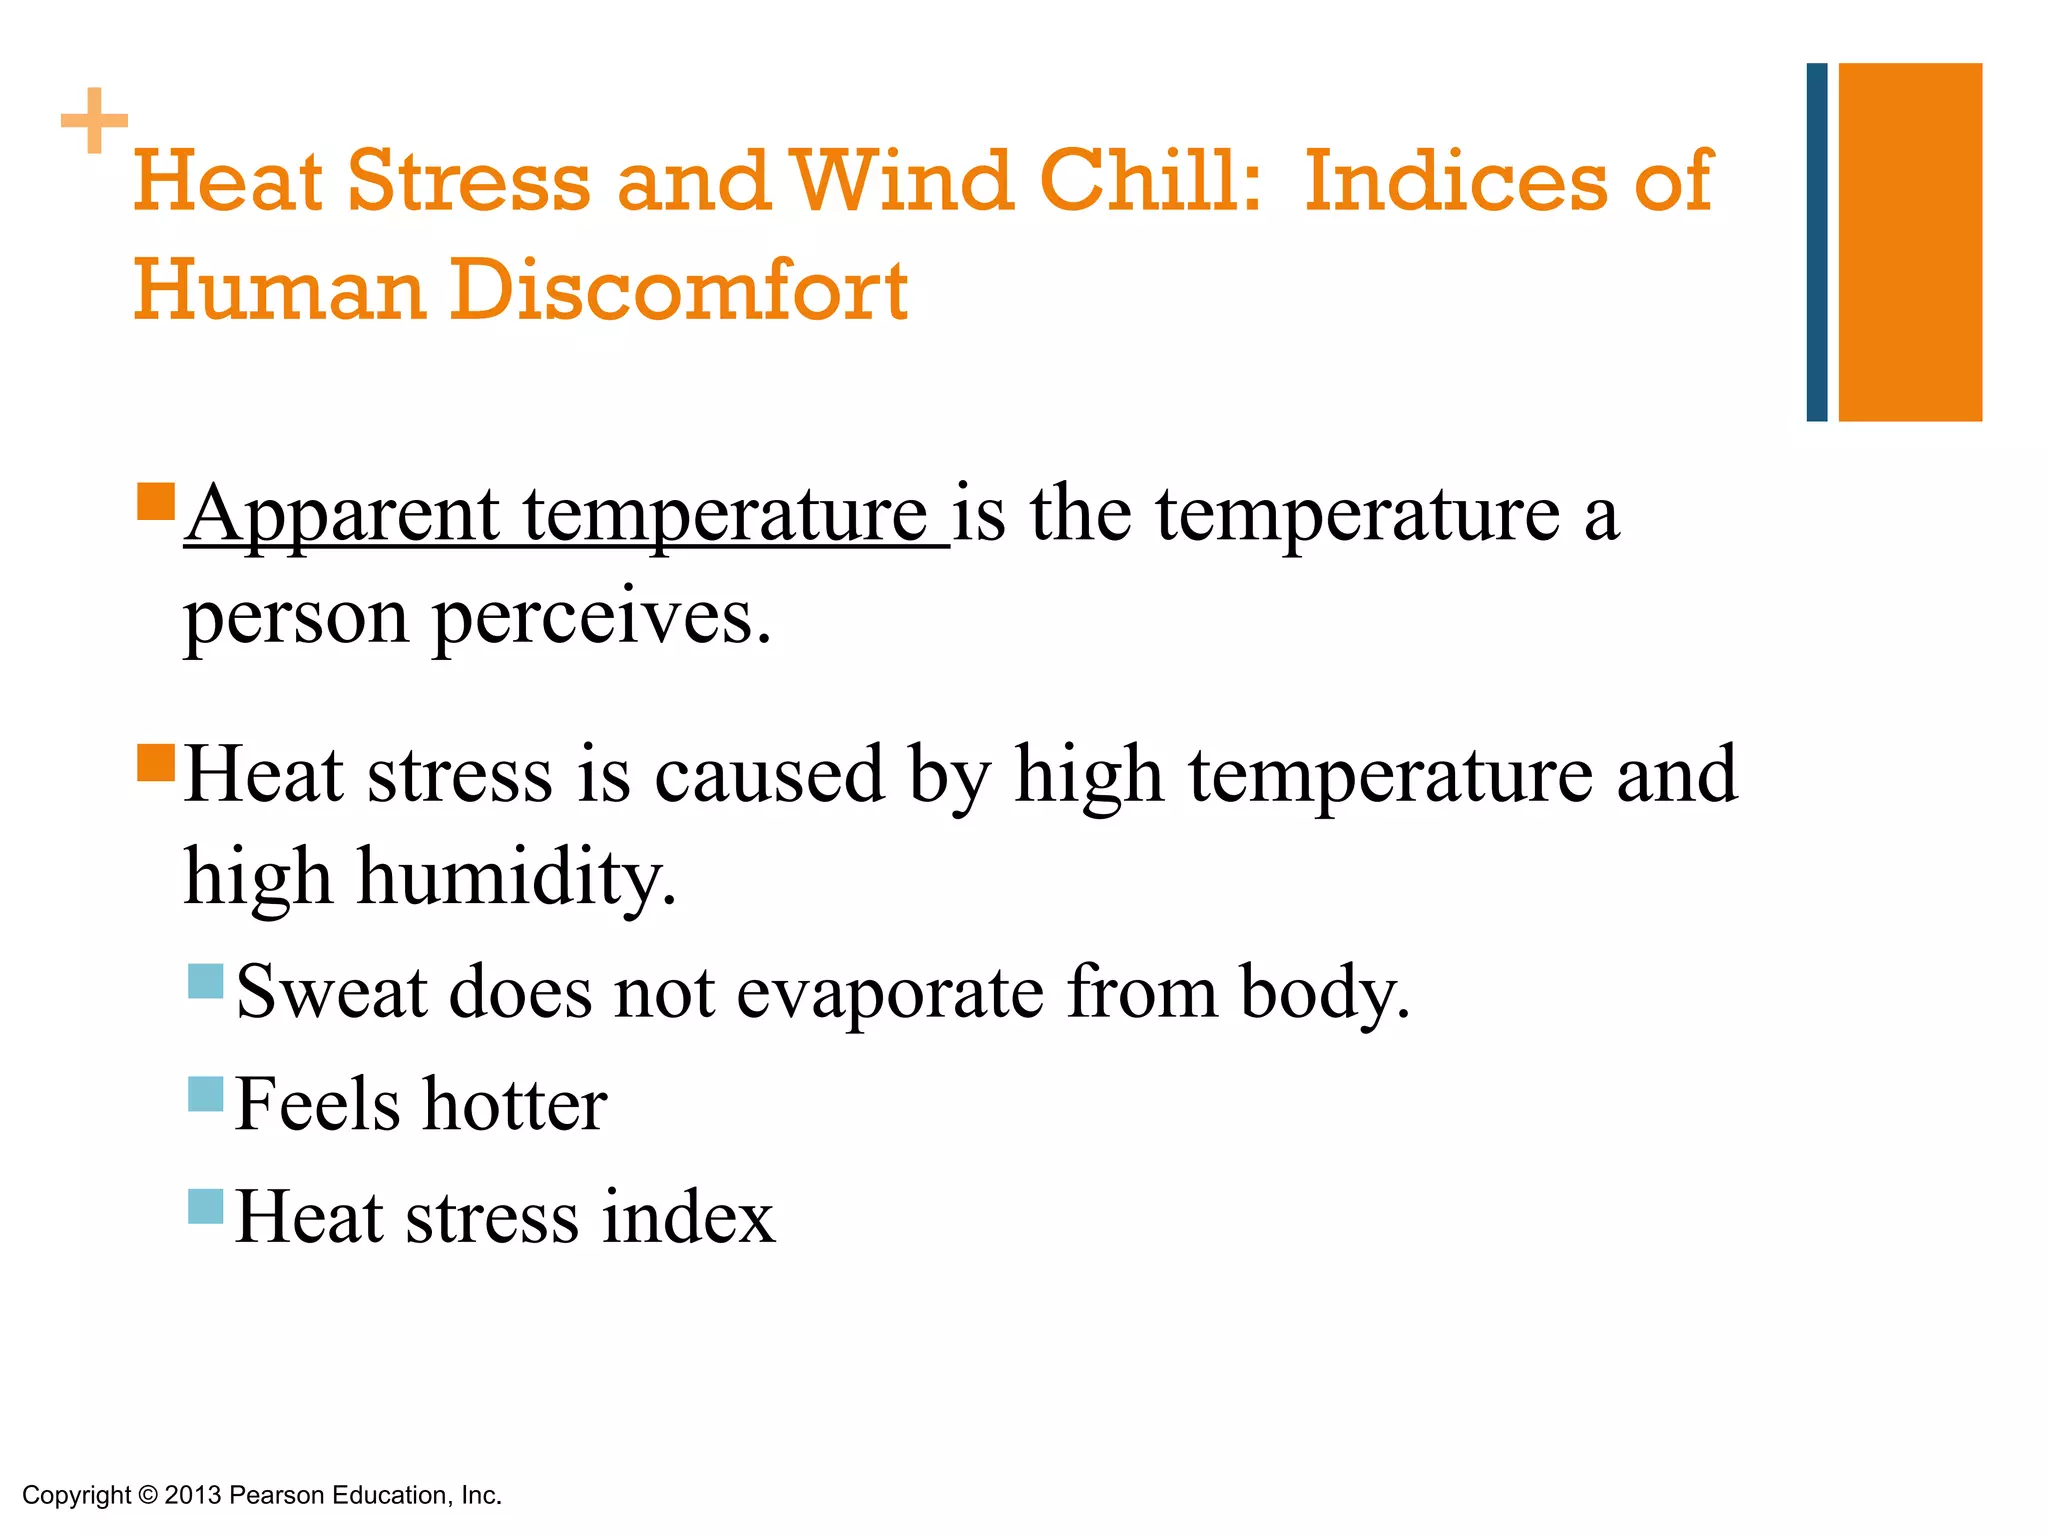
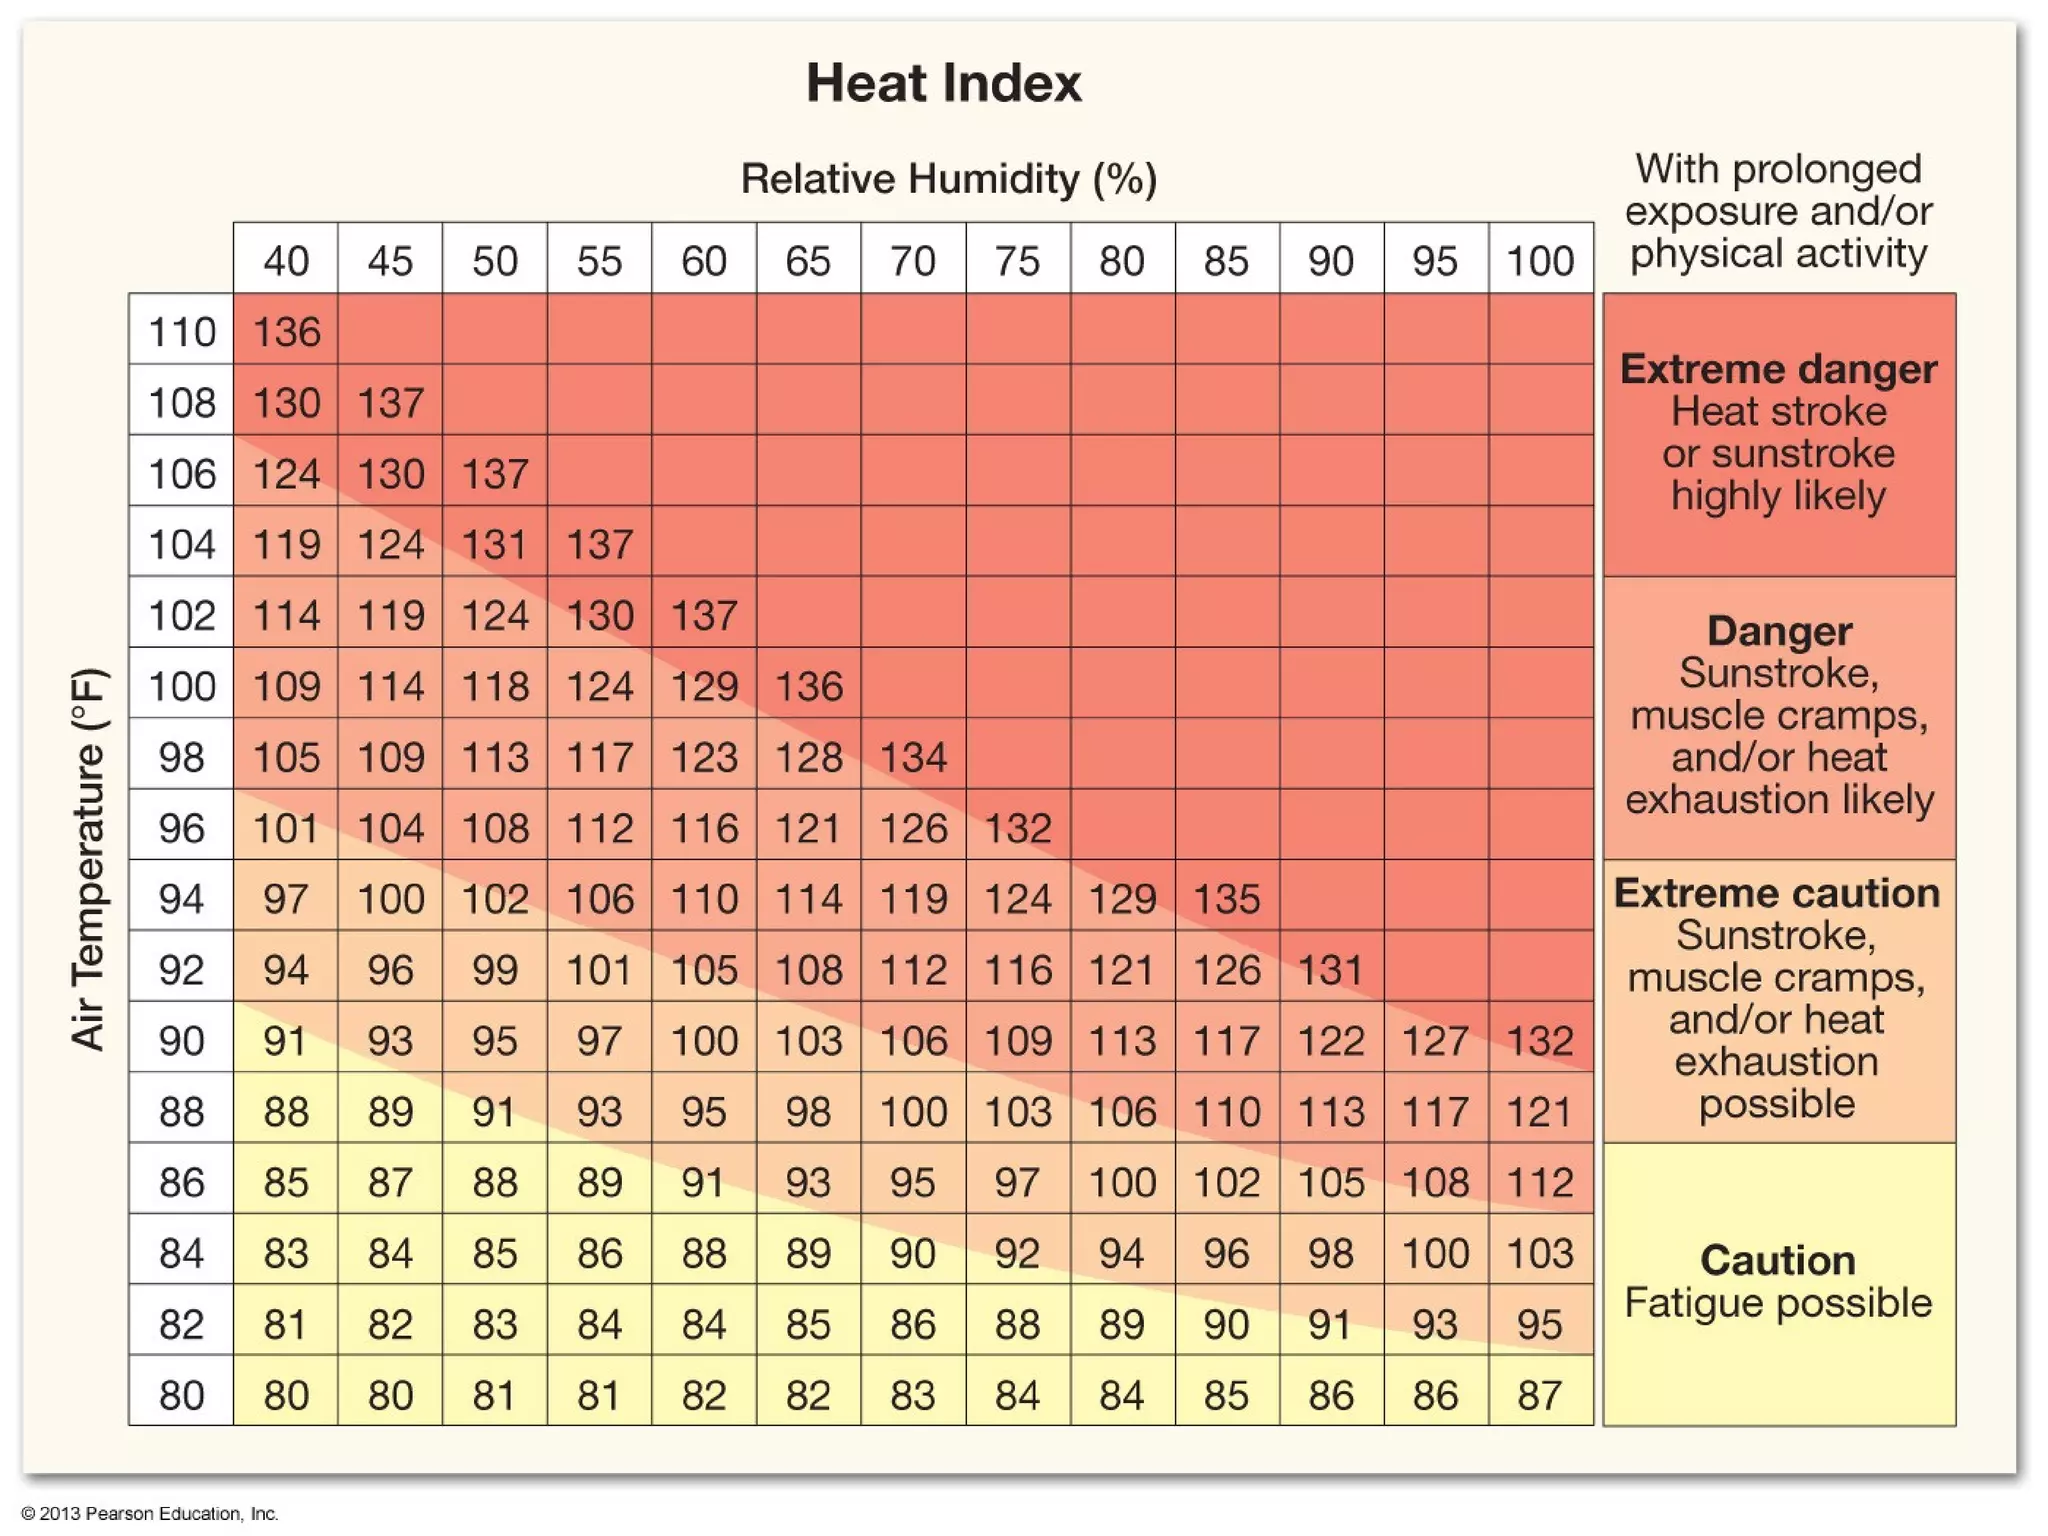
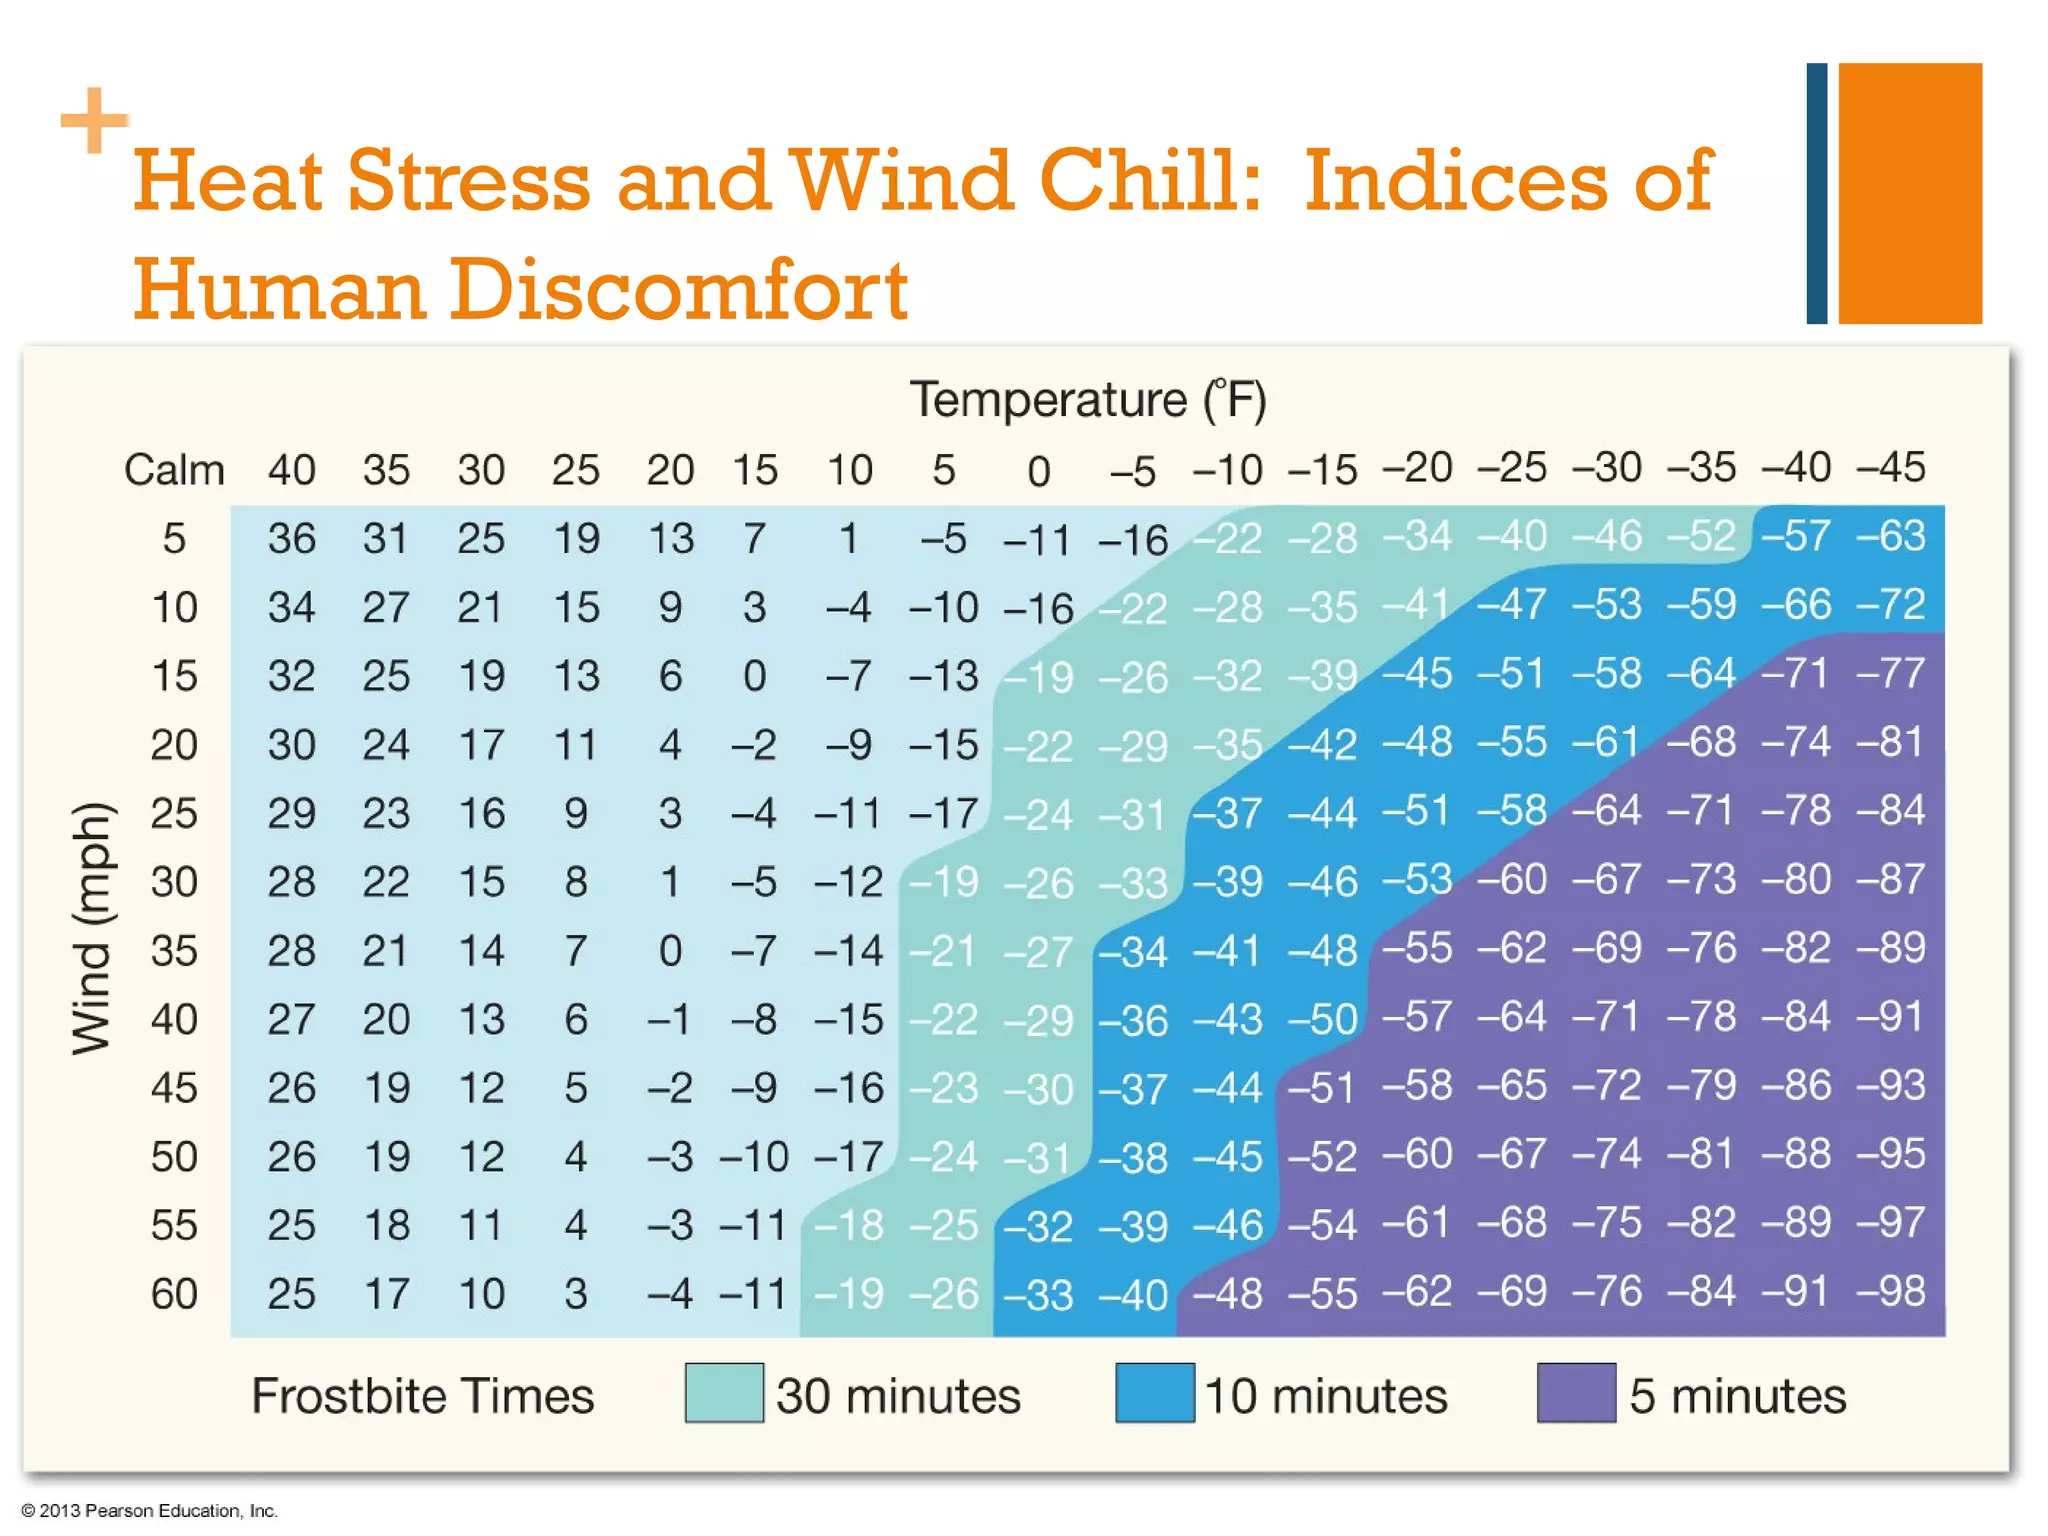
7) Indices used to