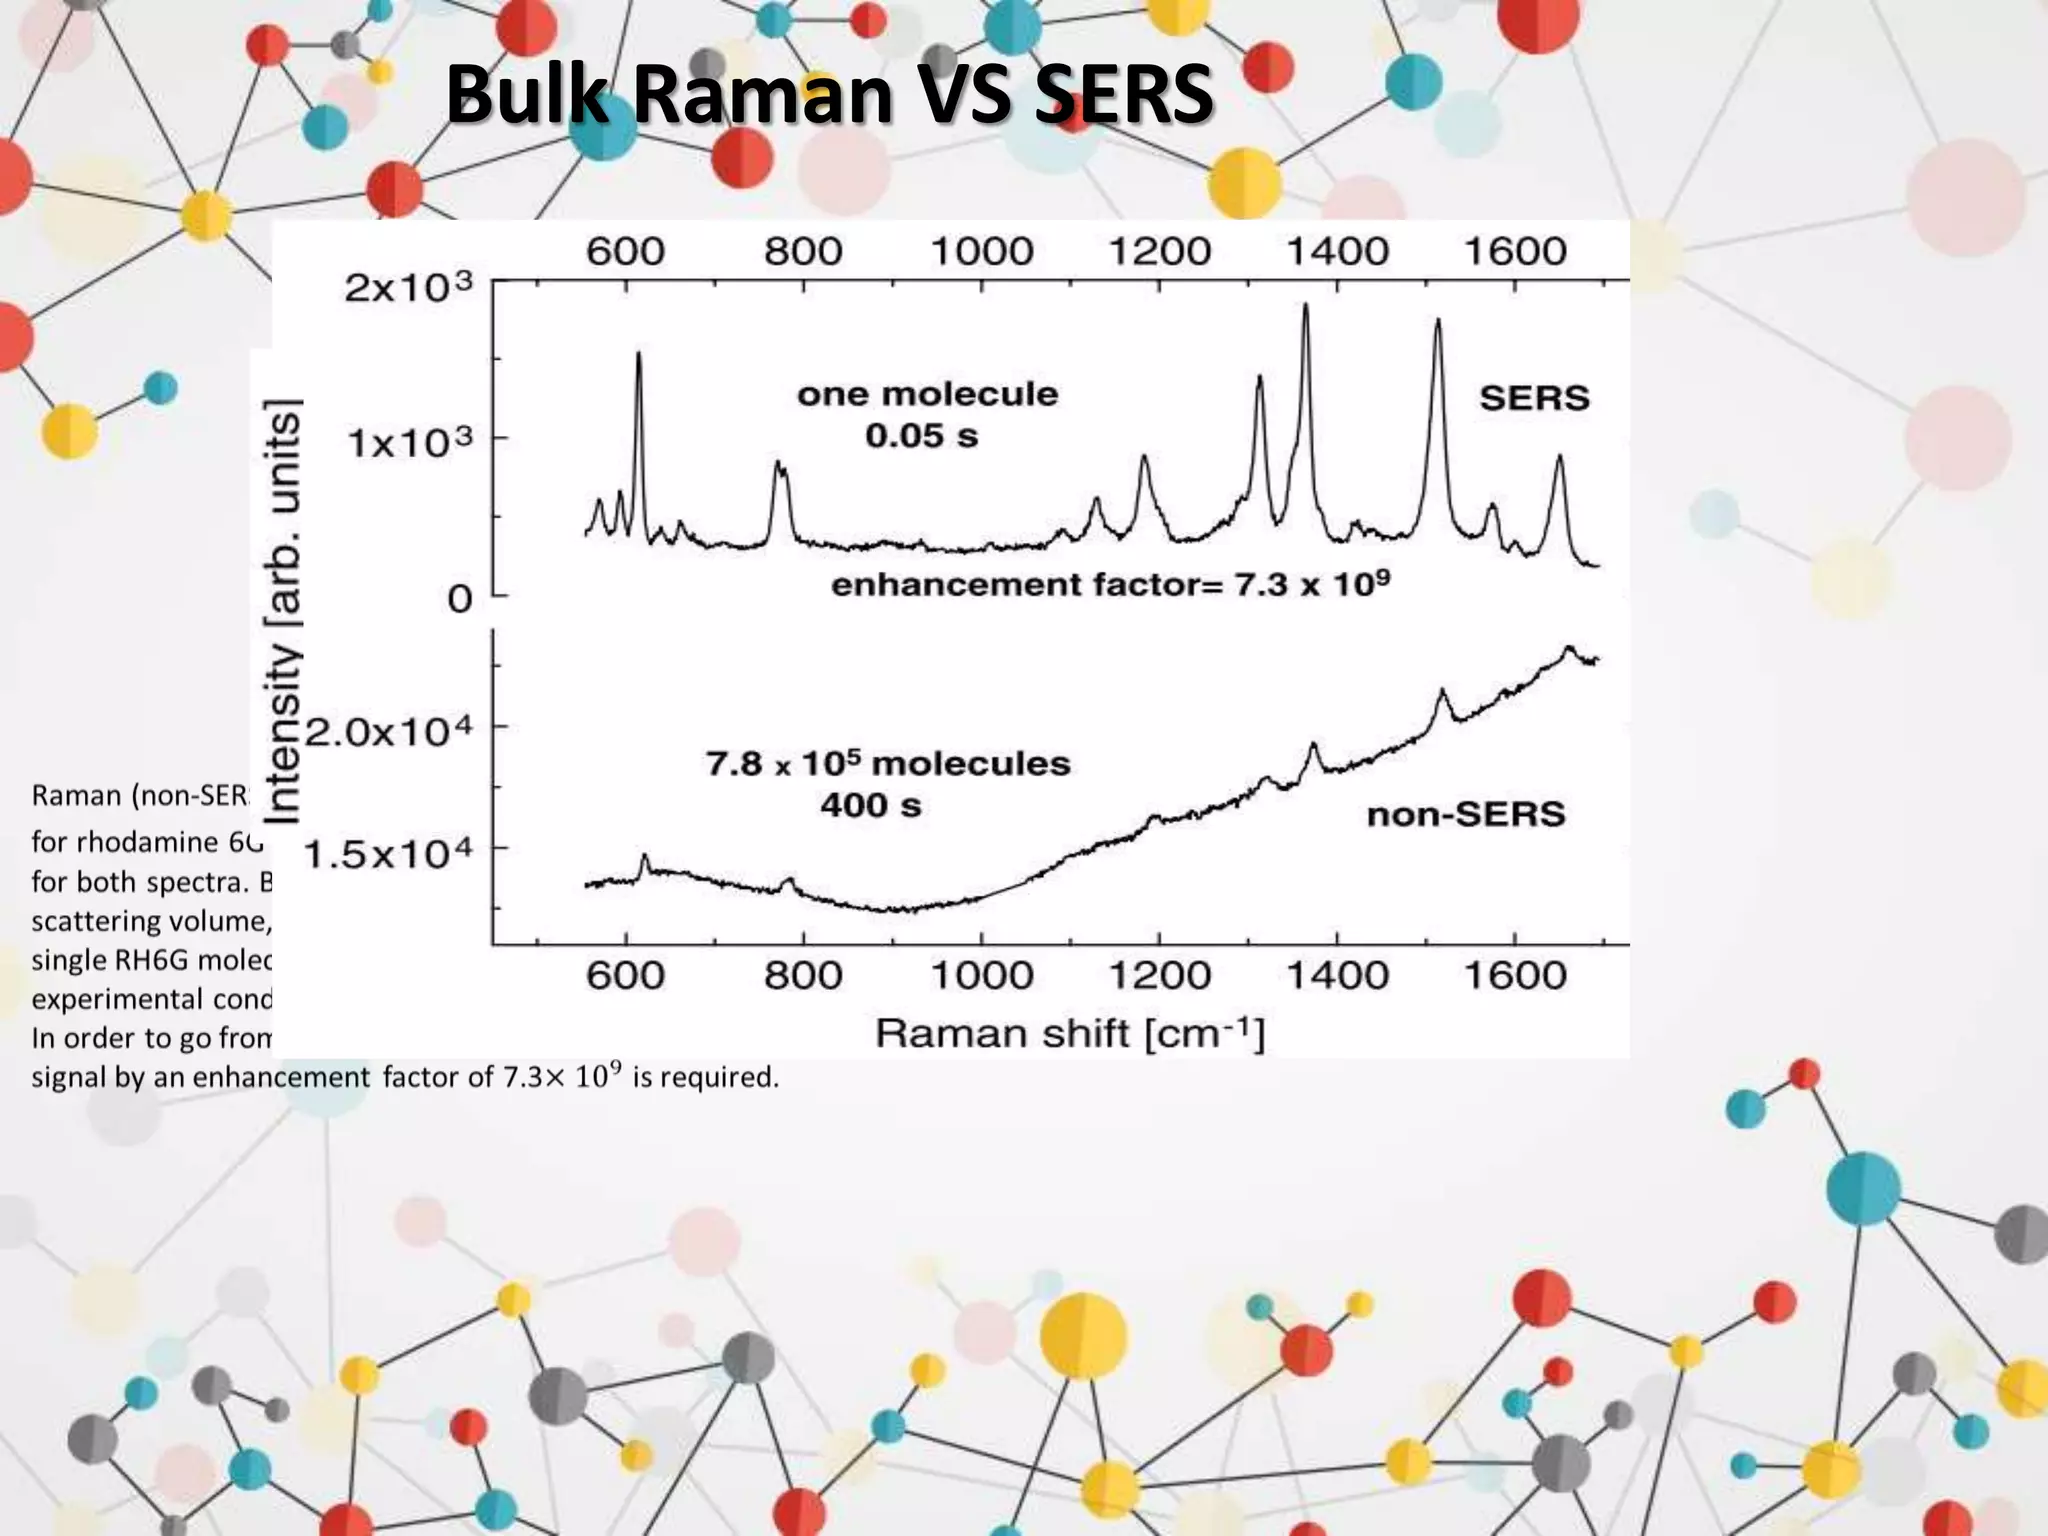
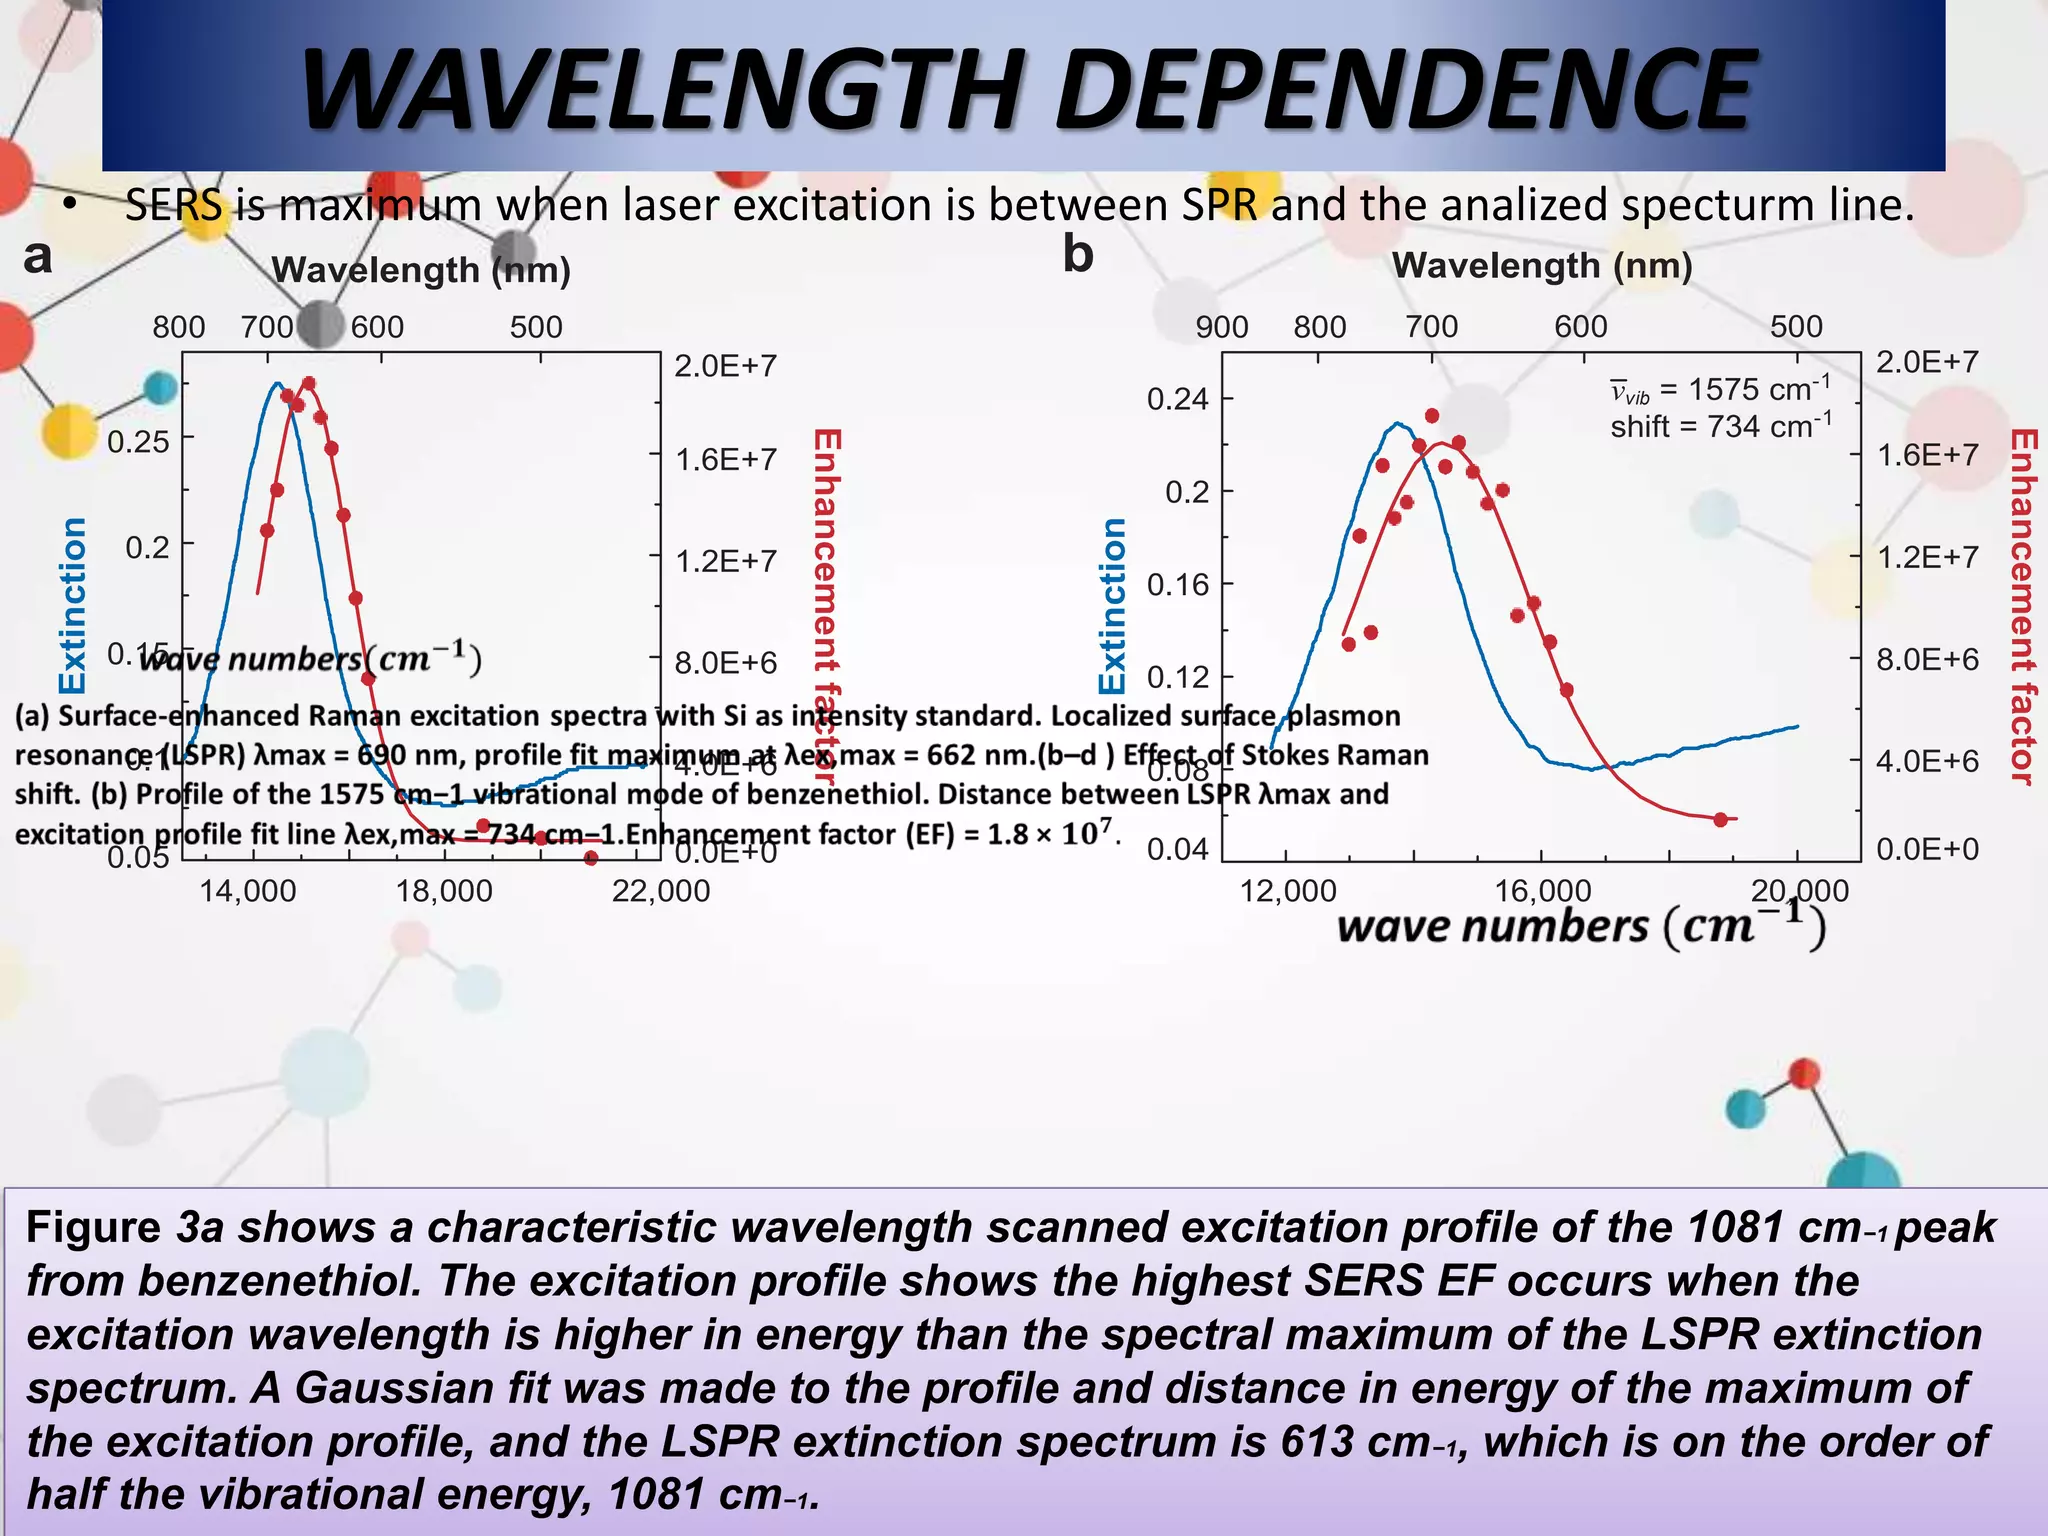
Surface enhanced Raman spectroscopy (SERS) provides greatly amplified Raman signals from molecules located near nanostructured metal surfaces, such as gold or silver. It works by taking advantage of localized surface plasmon resonances in these metals that can enhance the electromagnetic field in the vicinity of the surface by many orders of magnitude. This enhanced field can increase the normally weak Raman signals by factors of up to 1011, allowing single-molecule detection. SERS relies on both electromagnetic and chemical enhancement mechanisms to amplify Raman scattering.
![DISTANCE DEPENDENCE
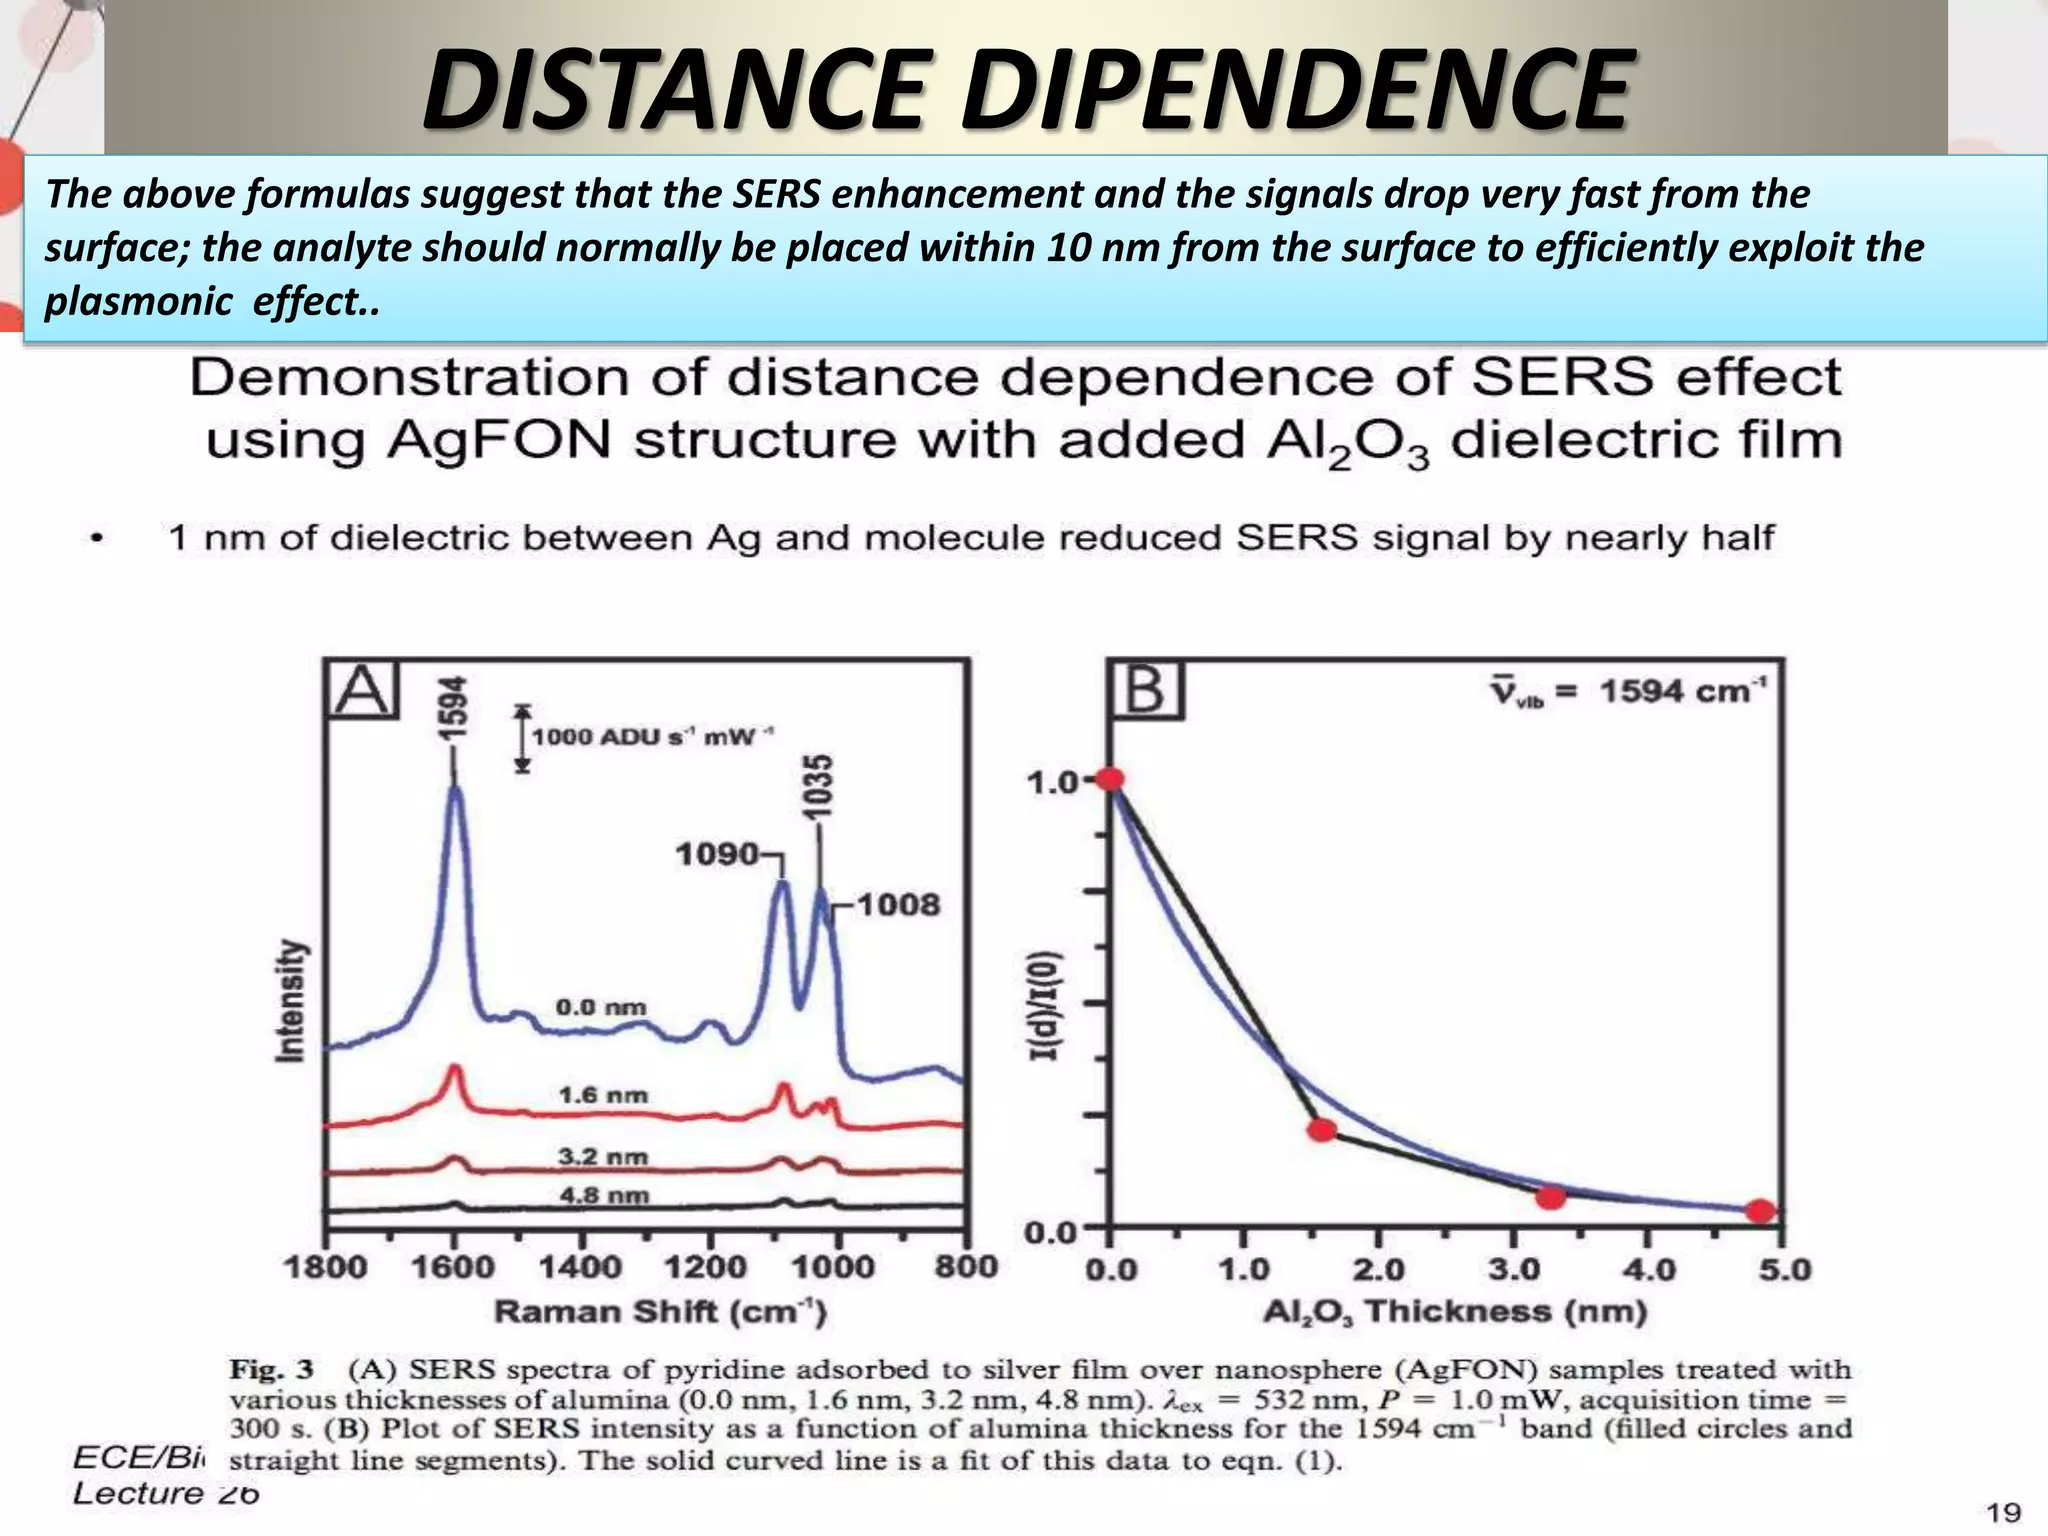
fig-SERS signal as a function of the distance from
the surface. A short and a long-range
component are identified; they are associated to
morphological features of the metallic substrate
with
a size of approximately 1 nm and 20 nm,
respectively. In the insets, a scanning electron
microscopy
(SEM) picture of the SERS substrate (silver film over
nanospheres) and a simulation of the electric
field are presented. Reproduced with permission
from Masango et al. [236]. Copyright (2016),](https://image.slidesharecdn.com/surfaceenhancedramanspectroscopyrahutoshranjan-200729070828/75/Surface-enhanced-raman-spectroscopy-rahutosh-ranjan-29-2048.jpg)
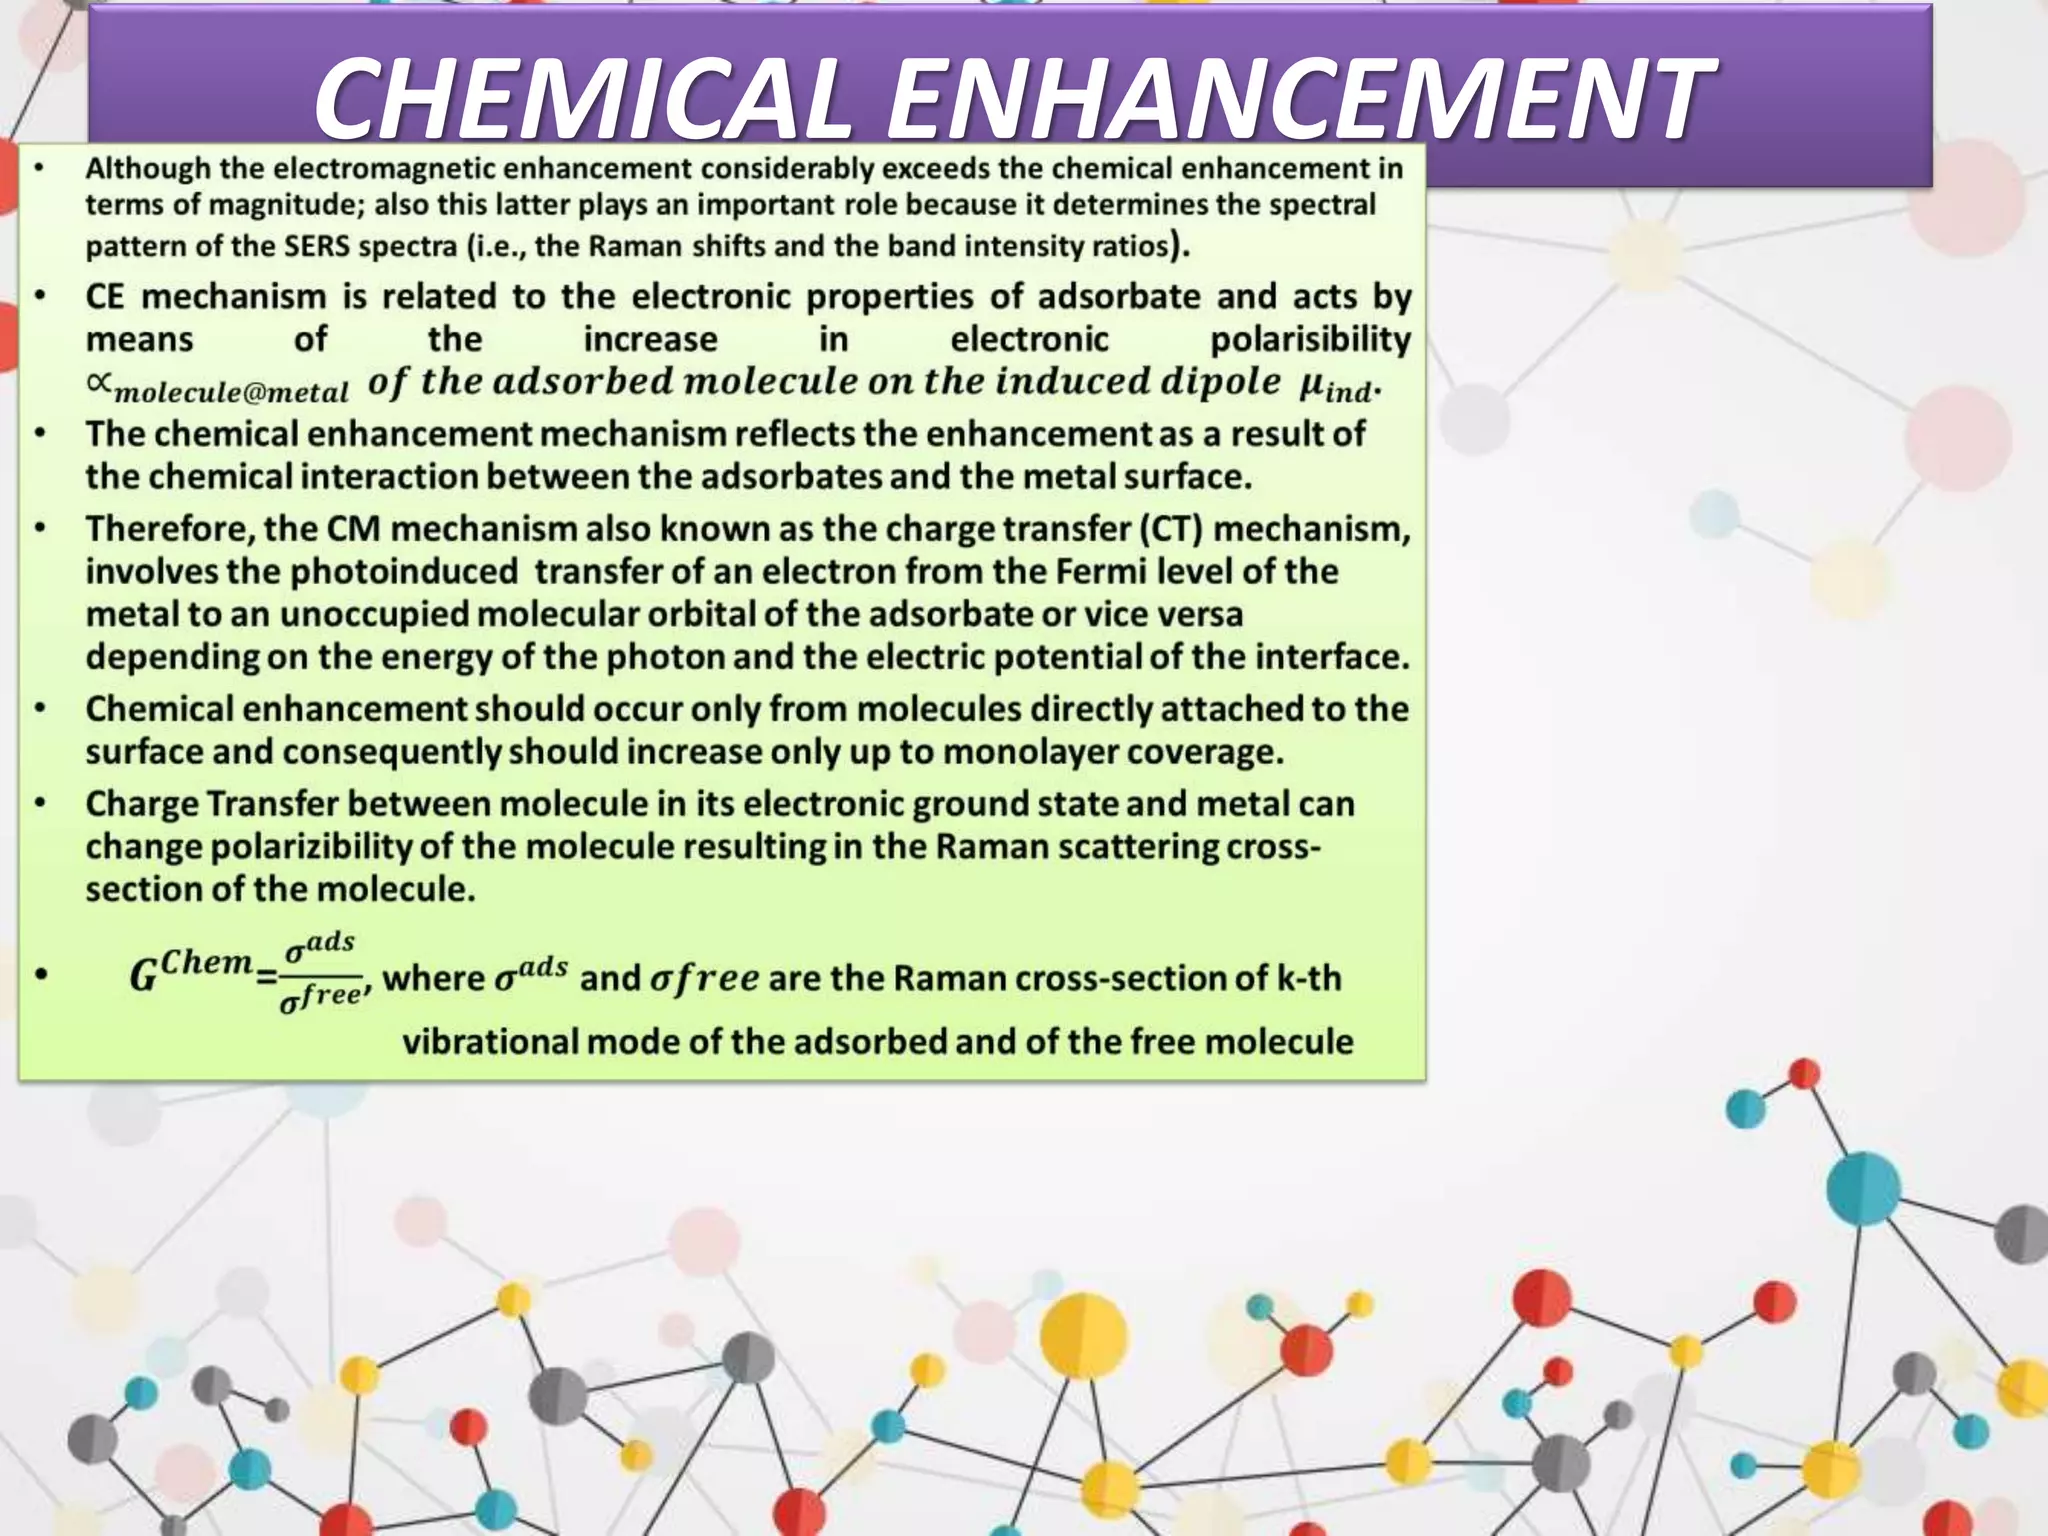
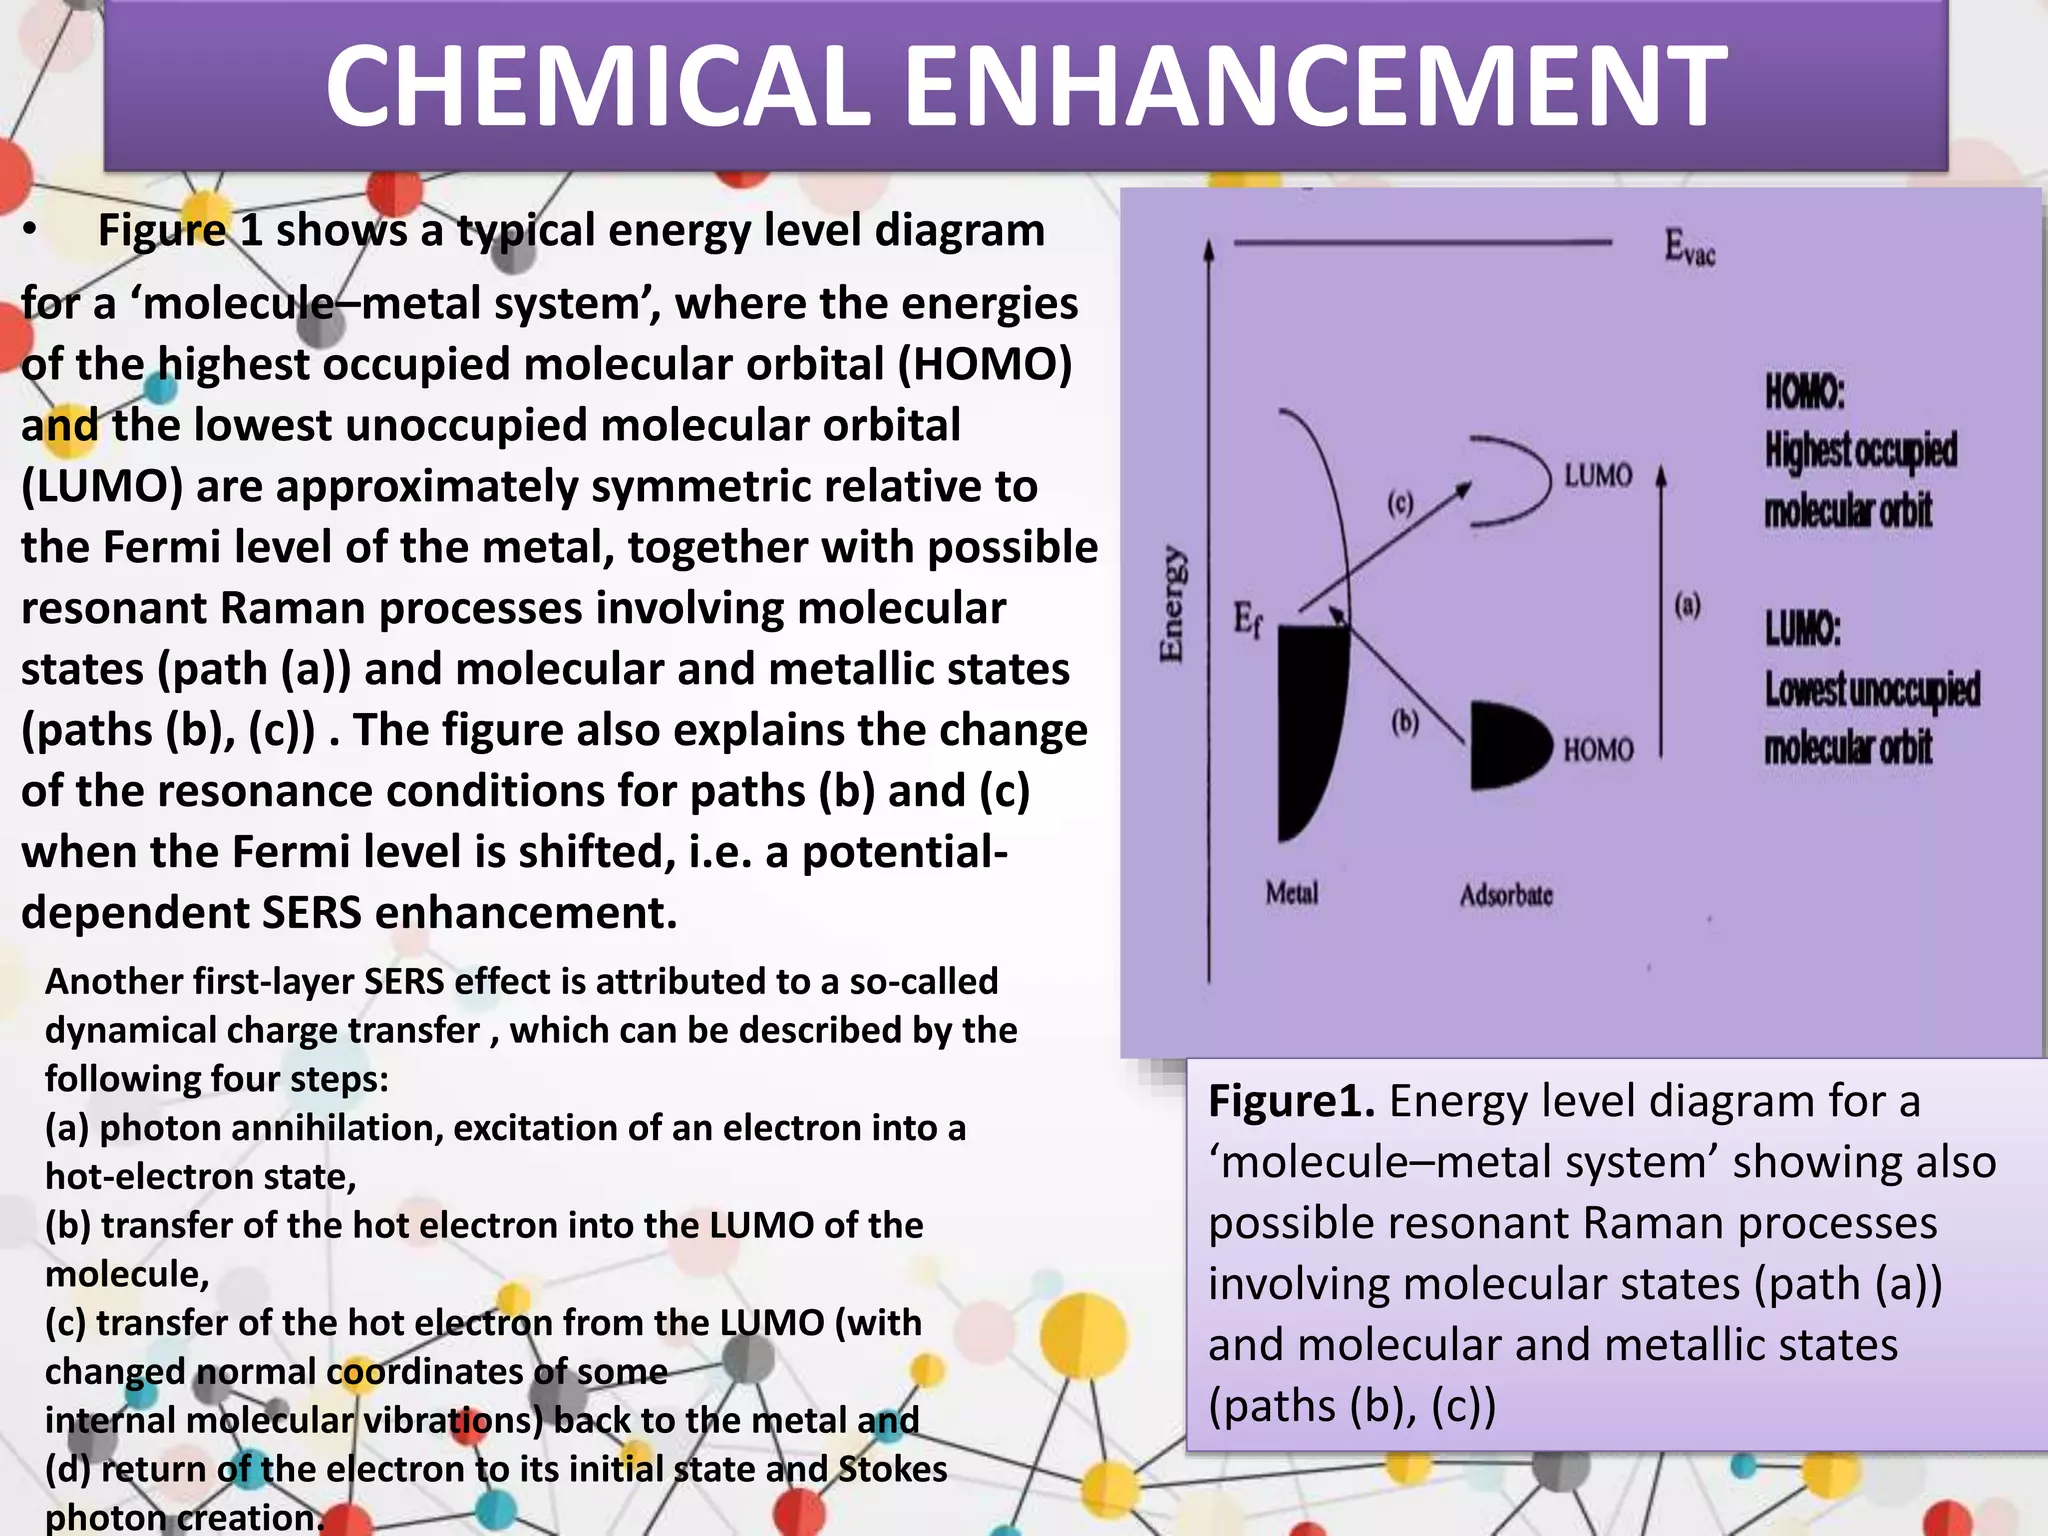
![CHEMICAL ENHANCEMENT
Two different mechanisms can contribute to
the chemical enhancement.
Non-resonant chemical effect. The interaction
between the molecule and the metal does not
lead to the formation of a new electronic state
(the molecular orbitals lay at energies not
close enough to the Fermi level of the metal);
however, such interaction may induce an
appreciable change in the geometrical and
electronic structure of the molecule, that
reveals as a mild modification of the Raman
shifts and of the intensity of the vibrational
modes.
Resonant charge transfer chemical effect. The
interaction between the molecule and the
metal brings about the creation of a metal–
molecule charge transfer (CT) state. If the
Raman scattering is excited with a laser source
in resonance or pre-resonance with this state,
some Raman modes can be strongly enhanced,
in particular those ones coupled to the
allowed electronic transitions
(resonant Raman scattering).
(a) Spectral distribution of the plasmonic
(red line), charge transfer (CT, black line),
and intramolecular (green, blue, and violet
lines) resonances for pyridine adsorbed on
silver. Reprinted (adapted) with permission
from Lombardi et al. [9]. Copyright (2008)
American Chemical Society.](https://image.slidesharecdn.com/surfaceenhancedramanspectroscopyrahutoshranjan-200729070828/75/Surface-enhanced-raman-spectroscopy-rahutosh-ranjan-34-2048.jpg)