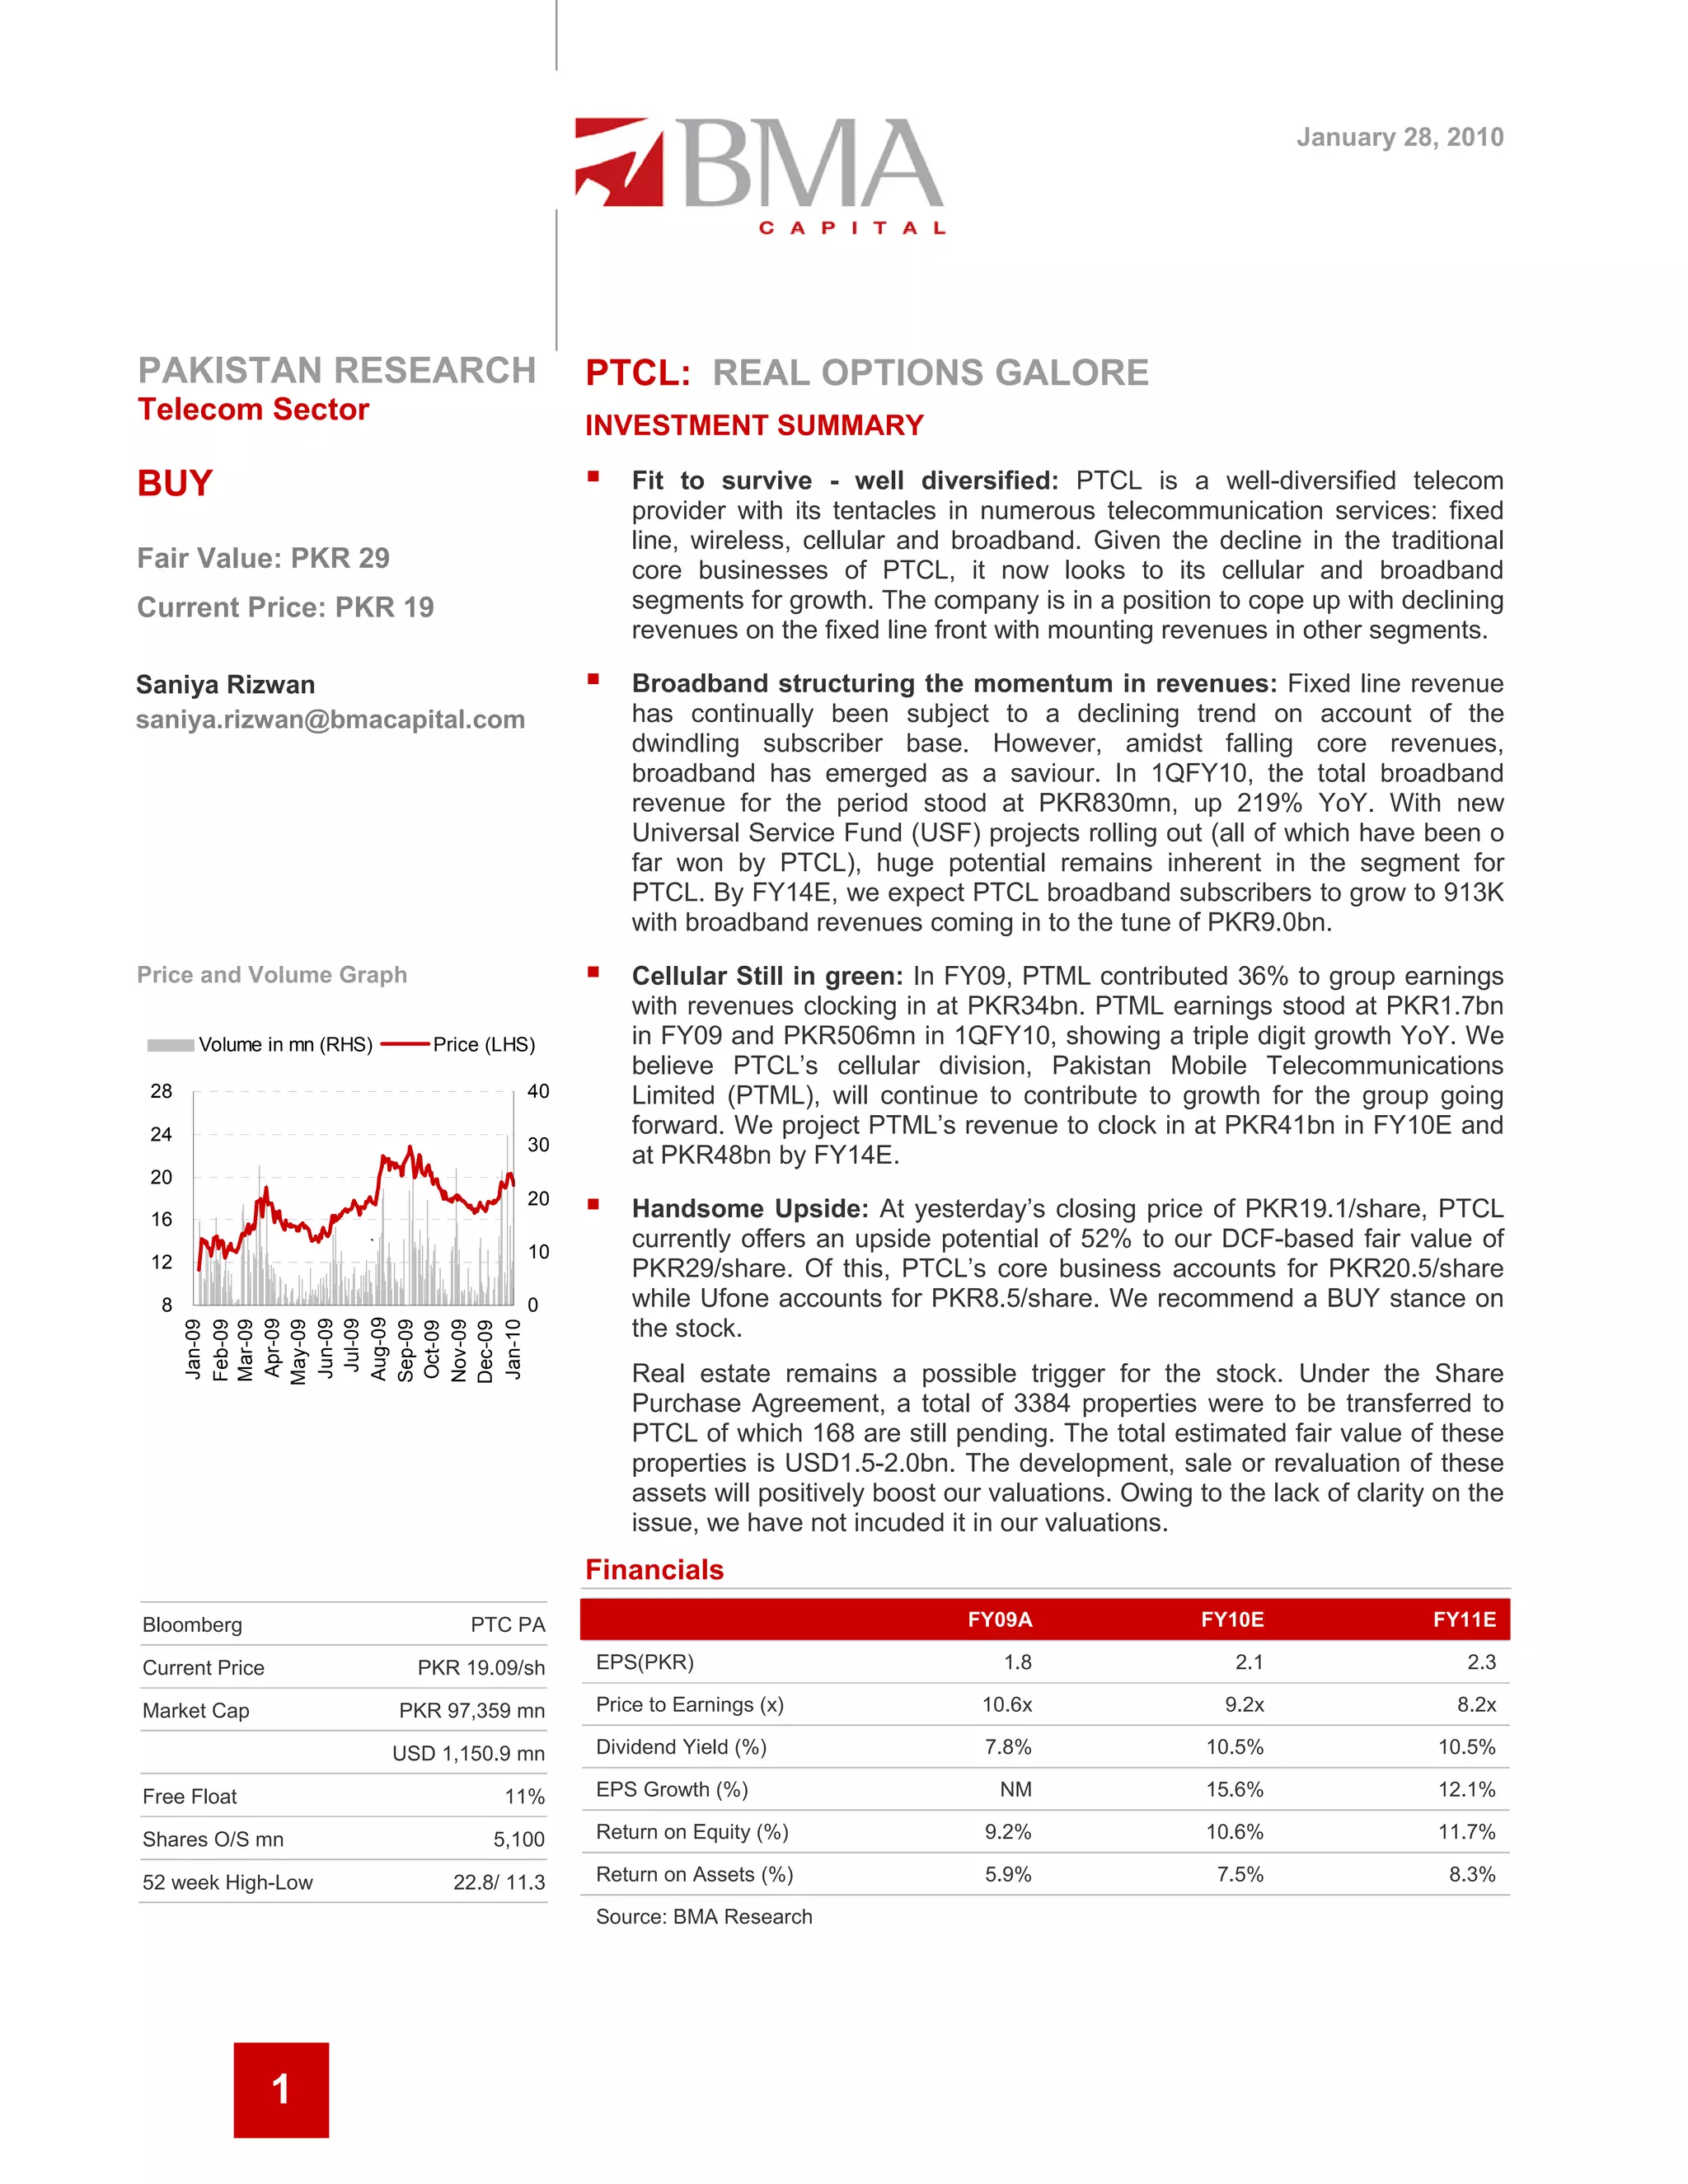
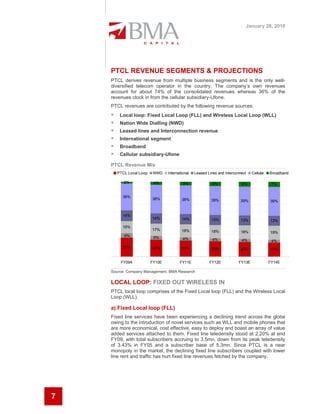
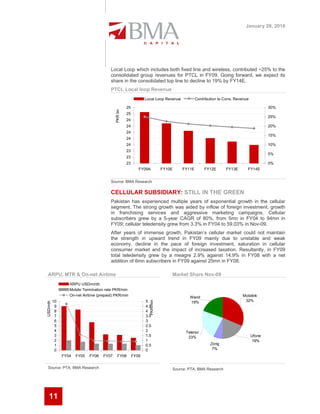
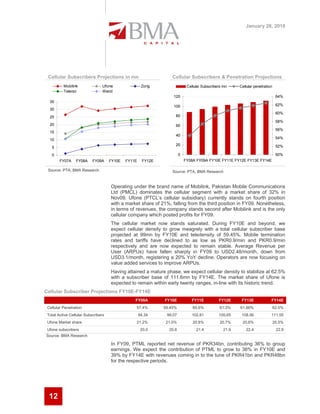
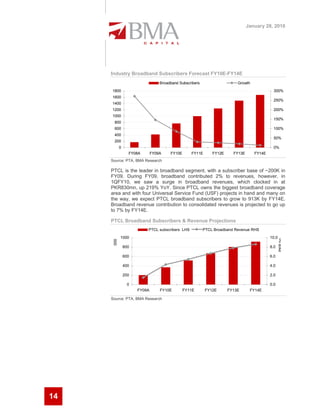
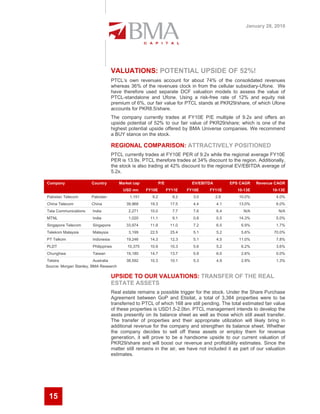
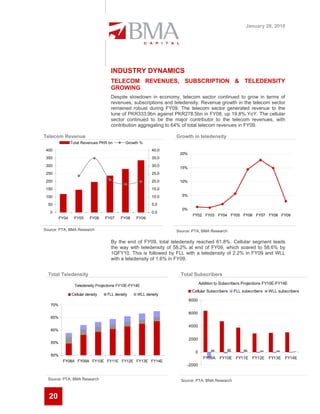
PTCL is a well-diversified telecom provider in Pakistan with operations in fixed line, wireless, cellular, and broadband services. While PTCL's traditional fixed line business is declining, its cellular and broadband segments are growing and contributing more to revenues. PTCL's broadband revenues have increased significantly, up 219% in 1QFY10, and broadband is expected to be a major driver of growth going forward. PTCL's cellular division PTML continues to be profitable and its revenues are projected to increase substantially through FY14E. At its current price, PTCL offers upside potential of 52% based on the analyst's fair value estimate, and is recommended as a buy.
The document summarizes Tele2's opportunities for growth in Russia and Sweden. In Russia, Tele2 sees opportunities to expand its mobile network coverage and take advantage of growing data usage. It currently has licenses for 61 million people in Russia and could expand to 73.5 million with new licenses. Tele2 also submitted an application to join a consortium investigating 4G mobile broadband opportunities in Russia. In Sweden, Tele2 launched 4G services in five major cities and sees potential for further growth in mobile revenue and postpaid customers.
charter communications 4Q2007_Earnings_Presentation_vFINALfinance34
This document is the transcript from Charter Communications' 4th quarter and full year 2007 earnings call. It includes:
1) Charter Communications reported consistent revenue and adjusted EBITDA growth in the 4th quarter and full year 2007, driven by strategies to increase bundling penetration and improve customer experience.
2) The company grew revenue from high-speed internet and telephone services through customer growth and increasing ARPU. Bundling phone with cable services drove faster growth and improved customer retention.
3) Charter reduced its debt maturities through 2012 to $367 million and expects adequate liquidity through 2009 to continue investing in growth opportunities and improving service.
ITNL is an established surface transportation player and market leader in the road BOT sector with a portfolio of over 7,500 lane km of projects spread across India. The company is expected to benefit from the growing opportunities in the road sector in India, with the NHAI targeting to award around 33,500 km of projects over the next 5 years. However, increasing revenue from low-margin EPC contracts is expected to impact ITNL's margins. The analyst values ITNL on an SOTP basis and initiates coverage with an "Accumulate" recommendation and target price of Rs358 per share.
NTPC reported a 7.9% year-over-year increase in net sales for the fourth quarter of fiscal year 2010, slightly ahead of estimates. Operating profit grew 1.9% year-over-year due to a 2.3% increase in sales volumes from commissioning new plants and higher plant load factors, though margins declined. Net profit declined 4.5% due to one-time provisions and lower interest rates. The analyst maintains an "Accumulate" rating and target price of Rs230, seeing continued growth from NTPC's regulated business model and expansion plans offset by potential project delays.
Charter Communications held an earnings call presentation on May 3, 2007 to discuss their quarterly results and outlook. The presentation included the following:
1) Charter reported strong momentum in the first quarter of 2007 with the highest revenue, adjusted EBITDA, and RGU growth in several years driven by increased bundling of services and growth in value-added services.
2) Bundled customers increased to 41% of total customers in the first quarter of 2007 compared to 34% in the prior year. Telephone services passed increased significantly year-over-year and telephone customers more than doubled.
3) Financial results showed 10.7% revenue growth and 13.2% adjusted EBITDA growth year-
BGR Energy Systems reported a very strong 4QFY2010 performance, with revenues growing 130.7% and net profit up 130.6% over the previous year. For the full year, revenues grew 59.7% and net profit increased 74.7%. The company maintained a healthy order backlog of Rs10,230cr and expects continued growth in orders. The analyst maintains a Buy recommendation on the stock with a target price of Rs722, noting attractive valuation multiples and expecting revenue and profit to grow at 36.7% and 31.2% CAGR over the next few years.
Charter Communications reported financial results for the second quarter of 2007 that showed double-digit revenue and adjusted EBITDA growth compared to the second quarter of 2006. Revenue grew 11% due to increases in high-speed internet, telephone, and commercial business, while adjusted EBITDA rose 11%. The company added 166,300 total RGUs in the quarter, up 47% year-over-year, driven by growth in digital video, high-speed internet, and telephone customers. Bundled customers grew 17.7% and now make up 42% of total customers.
Company report reliance broadcast network 17th april 2012Four-S
RBN is rapidly building a strong presence in the Indian media and entertainment industry. Within 6 years, RBN's BIG FM radio network has become the largest private radio network by scale and the second largest by revenues. RBN also has a 5 channel broadcasting portfolio and is entering the profitable phases of its radio and television businesses. RBN's international joint ventures and content production capabilities position it for continued high growth across radio, television, and other segments in the coming years.
Television industry in india - Hindi General Entertainment Channel Manish Poddar
The document discusses the television industry in India, focusing on the Hindi general entertainment channel (GEC) segment. It analyzes the Hindi GEC segment, including key players, content types, pricing models, and financial performance. The Hindi GEC segment is highly competitive and profitable for only the top 3-4 players. While serials are the most popular content, reality shows generate good viewership but higher costs make profitability difficult. New entrants must spend heavily on programming, marketing, and carriage fees to gain market share in the established Hindi GEC segment.
- Mphasis Limited is an Indian IT & BPO services provider and subsidiary of Hewlett Packard (HP), with HP owning 61% stake.
- The document provides an analysis of Mphasis' business segments, financial performance, valuation and recommendations.
- Based on a projected FY12 P/E multiple of 15, the fair value for Mphasis is estimated to be Rs. 723 per share. The document recommends a 'HOLD' rating on the stock.
Tulip Telecom has a strong asset base but high debt from acquisitions has weighed on its share price. While it defaulted twice on FCCB repayments, its fiber network, data centers, and long-term contracts could attract potential acquirers. Brave investors may realize outstanding returns if the company arranges funds or gets acquired, as its assets are undervalued compared to its total asset valuation. However, it remains a risky bet due to uncertainty around resolving its debt issues.
Bank of America Merrill Lynch held a Leveraged Finance Conference on December 4, 2012. Sinclair Broadcast Group presented at the conference. Sinclair owns 83 television stations across 46 markets, reaching 27.1% of US households. Sinclair highlighted its diversified portfolio across markets and network affiliations. It also discussed industry trends like growing political advertising and retransmission revenues that are driving growth in the television broadcasting sector. Sinclair forecasted $205 million in free cash flow for 2012 due to its strong operations and balance sheet with no near-term debt maturities.
Cuál es el futuro de la banda ancha fija y móvilDaniel Osorio
Mobile broadband is proving popular in some European countries and is both complementing and substituting fixed broadband in some cases. Some key points:
- In countries like Austria, a high percentage of broadband subscribers now use mobile broadband, showing substitution of fixed lines.
- However, mobile broadband is also serving complementary uses, with new subscribers and some using both fixed and mobile broadband.
- The low prices of mobile broadband plans in some markets, driven by competition, has accelerated this substitution effect for fixed players.
- Factors like improving technologies and devices, as well as attractive service bundles, continue to drive demand for mobile broadband over both fixed networks and mobile-only usage.
1) HCC reported a 13.6% increase in net sales to Rs.995.4 crore for 1QFY2011, in line with Angel Research estimates. Operating profit grew 9.3% to Rs.125.8 crore.
2) Net profit increased 55.6% to Rs.28.3 crore, marginally ahead of estimates due to higher operating margins and lower taxes.
3) Angel Research maintains a Neutral view on HCC, valuing it at Rs.126/share on an SOTP basis, with limited upside from current levels given its valuation of 36.5x FY2012 EPS.
1) NTPC is India's largest power generation company with a capacity of 29,394MW and plans to triple its capacity to 75,000MW over the next decade.
2) Power demand in India is expected to grow substantially over the coming years, outpacing supply growth and exacerbating current shortages.
3) NTPC aims to increase its generating capacity multifold to 50GW by 2012 and 75GW by 2017 to meet demand and maintain its leadership position.
Bharti Airtel Limited presented an investor presentation in May 2011. The presentation provided an overview of Airtel as an integrated telecom company offering wireless, fixed line, broadband, DTH, and enterprise services across India and international markets. It summarized Airtel's growth trajectory since 1996 and highlighted its leadership position in the Indian telecom market with over 220 million customers as of 2011. Key performance indicators such as revenue, EBITDA, and operating metrics were also presented to demonstrate Airtel's continued strong financial and operational performance.
ITNL reported strong revenue growth in Q2 FY12, though profit growth was moderate due to higher interest costs. Revenue grew 42% to Rs. 1,255 crores due to increased project execution. EBITDA grew 37% but margins fell due to higher contribution from construction projects. Order backlog provides revenue visibility for the next 24-30 months. While order awards have slowed, bidding activity is increasing, presenting opportunities for future growth.
Pratibha ind Result Update 4 qfy2010-110510Angel Broking
Pratibha Industries reported financial results for the fourth quarter of fiscal year 2010 that were in line with expectations. Operating margins improved significantly due to a reduction in raw material costs, boosting the bottom line. However, the company paid taxes at the marginal rate rather than claiming tax benefits. While the results were decent, the analyst maintains a neutral outlook on the stock given that positives are already reflected in the price.
Telecom Italia 3Q 2011 Results (Patuano)Gruppo TIM
Telecom Italia reported its 9M 2011 results. The company saw improving trends in its domestic mobile revenues in Q3 2011 compared to Q2 2011, despite a reduction in mobile termination rates. Telecom Italia's customer base grew solidly in Q3 2011, with a focus on quality acquisitions. Mobile retail browsing revenues accelerated due to growth in small screen revenues on the consumer segment.
The document discusses Georgia's service sector and its opportunities for investment. Some key points:
- Services account for 43% of Georgia's GDP and the sector has received major foreign direct investment inflows of $500 million in 2011, with financial services being a leading sub-sector.
- Retail/wholesale trade represents 40% of service sector GDP and has seen strong FDI growth. Healthcare/social work FDI inflows have also grown substantially in recent years.
- Georgia presents opportunities to capitalize on investment in financial services/headquarters and developing as a regional retail hub.
Telecom Italia – Telecom Argentina FY 2011 Preliminary Results and 2012‐14 Pl...Gruppo TIM
Telecom Italia's preliminary full-year 2011 results showed strong growth. Revenues increased 26.5% to €3.22 billion and EBITDA rose 24.1% to €1.035 billion. The company's mobile business in Argentina performed well, gaining market share and increasing average revenue per user by 16%. Looking ahead, Telecom Italia outlined plans to continue investing in growth through 2014 to further expand its networks and services.
The document provides an analysis of Consolidated Construction Consortium's (CCCL) 4QFY2010 results and outlook. Some key points:
- CCCL reported 33.2% revenue growth for 4QFY2010 inline with estimates, but order inflow for FY2010 was below expectations at Rs2,166cr.
- The company's current order book stands at Rs3,392cr, providing 1.4x revenue visibility for FY2011, which is lower than peers.
- The analyst expects 19.2% revenue CAGR for CCCL over FY2010-2012 on the back of its order book and recovery in private capex.
- C
Reliance Industries reported lower-than-expected quarterly results, with profits impacted by lower-than-expected refining margins. Revenue grew 120.7% year-over-year primarily due to higher refining revenues, but margins were lower than estimates. While volume growth was strong, profitability was hurt by refining margins of $7.5/bbl compared to an estimated $8.5/bbl. The analyst maintains a buy rating due to expectations for margin improvement and inorganic growth opportunities.
BGR Energy has expanded from manufacturing BoP components to executing turnkey BoP projects and full EPC contracts. It has a large order backlog providing revenue visibility. Government plans substantial capacity additions over the next decade, creating huge opportunities for BoP providers. BGR is well positioned as one of few players offering complete turnkey BoP services. It has competitive advantages like in-house manufacturing and engineering capabilities.
Delivered this presentation at the Informa's Pricing Mobile Broadband conference 26 & 27th August 2012 in London. While some of the slides are similar to the ones in my Mind Share document you will find new slides and re-worked material giving another twist to Right Pricing Mobile Broadband. Enjoy and should you have any questions/comments just get in touch! Don't be a stranger!
MPL Result Update 4qfy2010-030510-finalAngel Broking
Madhucon Projects reported disappointing results for the fourth quarter of fiscal year 2010 that were below expectations. While revenue grew robustly due to higher subcontracting in the power segment, operating margins hit a historical low of 6.4% due to the heavy subcontracting. The analyst maintains a "Buy" rating but lowers the target price to Rs. 190 per share based on revised estimates factoring in lower margins and a higher holding company discount applied to the valuation of Madhucon Infra subsidiary. Near-term revenue visibility comes from existing power segment orders but margins are expected to remain under pressure from ongoing subcontracting.
J Kumar Infraprojects is one of the leading construction companies in India with nearly three decades of experience. It has a current order backlog of Rs. 13 billion diversified across various segments like transportation, civil works, irrigation and piling. The company is well positioned to benefit from the large infrastructure projects underway in India. Kotak Securities initiates coverage on J Kumar with a "Buy" rating and a target price of Rs. 260 per share given its strong growth outlook and attractive valuations.
The majority down. 62% of our 72-stock universe suffered lower
sequential quarterly net profits, with 24% surprising on the downside.
The combined 1Q09 net profit of our research universe fell by just 3.5%
QoQ. But stripping out 5 large gainers, net profits fell a larger 13.6%
QoQ. Consumers and glove manufacturers’ defied gravity, but net
profits of virtually all stocks in nine sectors fell quarter-on-quarter.
A surprising combined result, but the devil is in the details. The
combined net profit of our research universe declined just 3.5% QoQ
despite an overwhelming 62% of companies reporting a sequential
quarterly decline. But excluding five companies, combined net profit fell
13.6% QoQ, an acceleration from previous quarters. A broad-based
earnings decline is being masked by a few companies, including some
monopolies.
Declines in nine sectors, but consumer sector unscathed. Every
stock in nine sectors, excluding monopolies Petronas Gas and KLCCP,
experienced a drop in quarterly sequential earnings. The sectors are
gaming, oil & gas, property, REITs, construction, building materials,
semi-conductors, plantations and toll roads. Consumer stocks and
glove manufacturers showed particular resilience.
An ‘energy dividend’ took effect; monopolies fared well. Lower oil
prices benefited heavy fuel users AirAsia and Tenaga. Their gains were
only partially offset by lower earnings at the oil & gas services
companies. Net profits of Telekom, Tenaga and Petronas Gas, all
effectively monopolies, improved on a quarterly basis although only
Petronas Gas raised prices in 1Q09.
The biggest disappointment and downgrade: 1Q GDP. First quarter
2009 GDP fell 6.2% YoY, against consensus expectations of a 3-4%
drop. We have revised our GDP forecasts to -3.8% in 2009 and +4.0%
YoY in 2010 (previously -1.3% and +3.5% respectively). The
government, to be ahead in the expectations game, is projecting 2009
GDP growth of -4% to -5%. The silver lining is the government is now
under greater pressure to implement its fiscal stimulus plans quickly.
A reversal of fortune ahead for construction, building materials.
Despite uniformly lower earnings this 1Q, we believe the construction
and building materials sectors are only 2-3 quarters away from
improved revenues. Share prices of stocks in these sectors will likely
be driven by newsflow from the fiscal stimulus rather than earnings.
Atlanta ended the fiscal year 2012 with an order book exceeding Rs. 24 billion, over 4 times expected revenues for fiscal year 2013. This positions the company for strong growth going forward. Three new road projects worth Rs. 27 billion were won in fiscal year 2012 and are key drivers of anticipated growth. Two operational build-operate-transfer road projects are also expected to contribute improved cash flows in fiscal years 2013 and 2014. The company remains attractively valued given its portfolio of road projects and other infrastructure and real estate developments.
This document provides an overview of IPTV Specialized Global Company. It discusses the company's capital structure, shareholders, core competencies in IPTV solutions, and major milestones from 2008-2009 including contracts, acquisitions, and financing activities. The company aims to be a leader in IPTV product development and total solutions through capabilities like full product portfolios, system integration expertise, and patented technologies.
HDIL is initiating coverage with a buy recommendation and target price of Rs356 per share. HDIL's Mumbai International Airport redevelopment project is on track to generate significant revenue. The company is also set to benefit from strong land development rights (TDR) prices in Mumbai, which have recovered in recent years. At the current price of Rs284 per share, HDIL is trading at a 28% discount to the analyst's 1-year forward estimate of net asset value (NAV) of Rs395 per share. The target price of Rs356 represents a 10% discount to the estimated 1-year forward NAV.
Reliance Communication's quarterly performance failed to meet expectations, with wireless revenue growing only 1.7% compared to the industry average. While the company surpassed 100 million subscribers, its broadband and global business segments saw declines. Profits grew 10.1% due to higher interest earned, but margins fell due to higher network and access costs. Going forward, profitability is expected to come under pressure from increased leverage for capex spending and acquiring 3G licenses.
Elecon Engineering is a leading provider of material handling equipment and gear solutions in India. It has a 26% market share in the domestic gear market, making it the leader. The company is well positioned to benefit from an estimated Rs32,500 crore of opportunities in the material handling equipment industry over the next few years, driven by growth in core sectors like power, steel, and coal. Elecon's order book and revenues are expected to grow at a CAGR of 40% and 13.5%, respectively, during FY2010-12, supported by a recovery in industrial activity and capital expenditures. The company's strong position in the stable gear market also helps support its profitability.
Elecon Engineering is a leading provider of material handling equipment and gear solutions in India. The company is well positioned to benefit from increasing industrial capital expenditures in sectors like power and steel. The analyst estimates Elecon will grow sales at a CAGR of 13.5% and adjusted profits at 37% over fiscal years 2010-2012 due to improving financials and recovery in the material handling equipment industry. The report initiates coverage on Elecon with a buy recommendation and target price of Rs102 based on attractive valuations and growth opportunities.
Telecom Italia key takeaways and plan targets document outlines the following:
1) Telecom Italia operates in both mature and emerging economies, with Italy as a cash cow market and Latin America providing growth opportunities.
2) Between 2011-2013, Telecom Italia generated over 22 billion Euros in operating free cash flow while stabilizing revenues and EBITDA.
3) The plan targets continued capital discipline with a focus on debt reduction to below 28 billion Euros and yearly dividend growth of around 15%.
4) For 2011 specifically, the plan updates project broadly stable revenues and EBITDA versus 2010, with capex of around 4.8 billion Euros.
1. EDB launched an improved business with aligned and coordinated capabilities, including a new powerful consulting unit and simplified legal structure represented by a new logo.
2. The company saw positive revenue trends after a challenging 2009, with revenue of 1,824 million NOK (a 5% year-over-year decrease) and improved EBITA margins of 7.4%.
3. EDB secured future business with 1.3 billion NOK in new signings for the quarter and an order backlog of 12.1 billion NOK across business areas including IT Operations, Solutions, and Consulting.
Madhucon Projects reported a 43% increase in net sales and a 22.2% increase in operating profit for the first quarter of FY2011, beating analyst estimates. While margins and earnings also exceeded forecasts, regulatory changes have delayed the company's plans to raise equity financing. As a result, the analyst downgrades the stock to "Accumulate" and changes the valuation methodology to no longer factor in potential equity dilution. The analyst sets a target price of Rs174 per share based on assigning a PE ratio to FY2012 earnings estimates and valuing subsidiaries.
TV Today Network reported quarterly revenue growth of 46.9% year-over-year to Rs78.9 crore, aided by steady growth in its broadcasting business and the amalgamation of its radio business. However, the company reported a loss of Rs10.1 crore for the quarter compared to a profit of Rs8.1 crore last year, with its operating margin contracting significantly, owing to losses incurred in its newly amalgamated radio business. For the full year, TV Today reported revenue growth of 13.9% but net profit declined 7.9% due to a Rs38 crore loss in the radio business. The analyst downgraded the stock to Neutral given losses in the radio business and a
Gateway Distriparks reported quarterly results that were marginally below estimates. Revenue growth was driven by a 24.2% year-over-year increase in the higher-margin Rail business. However, CFS revenues fell 9.2% due to a fire. Profits increased significantly due to tax write backs. While funds from Blackstone were slightly delayed, management expects funds in the next quarter and for Rail to break even on profits this fiscal year. Falling market share at a key container terminal remains a concern.
1) Finolex Cables reported a 50.4% year-over-year increase in net sales to Rs. 493.1 crore for the first quarter of FY2011, driven by strong growth in the electrical cables segment.
2) Operating margins declined to 8% from 15.2% in the prior year quarter due to higher raw material costs, though margins improved sequentially.
3) Net profit increased 4.5% year-over-year to Rs. 23 crore for the quarter despite margin pressure, with sales growth offsetting higher costs.
The document initiates coverage of Sun TV Network with a "Buy" recommendation and target price of Rs497. Key points include:
- Sun TV Network is a leader in 3 of 4 lucrative southern TV markets in India.
- The analyst models 23.5-25.3% CAGR in revenues, core profits, and earnings for Sun TV over FY2010-12, and cash balances swelling to Rs10 billion by FY2012.
- Factors like rate hikes, growth in niche channels and DTH subscriptions, and the movie Endhiran are expected to drive strong revenue growth.
- The target price of Rs497 represents a 24% upside and is based on a
Italian Equity Roadshow 2012 - Tokyo - Alex Bolis presentation (June 2012)Gruppo TIM
Telecom Italia Group held investor meetings in June 2012. The presentation included the following:
1) Telecom Italia Group reported revenues of €29.9 billion for 2011, up 2.7% year-over-year. EBITDA was €12.3 billion, flat compared to 2010.
2) Telecom Italia leads the domestic Italian market with over 32 million mobile lines and 14.5 million fixed accesses. In Brazil, TIM is the second largest mobile operator with 57.6 million lines.
3) Forward-looking statements in the presentation involve risks and uncertainties that could cause actual results to differ from projections. Telecom Italia undertakes no obligation to update such
Investor Meetings - Hong Kong and Singapore - Alex Bolis presentation (June 2...Gruppo TIM
Telecom Italia Group held investor meetings in June 2012 to provide an overview of the company, highlight its leadership positions across key markets including Italy, Brazil, and Argentina, and outline its strategic priorities of proactively managing the domestic market in Italy for cash generation while continuing business expansion in Brazil and managing growth and profitability in Argentina.
The document provides a recommendation to buy shares of Noida Toll Bridge Company Ltd (NTBCL). Some key points:
- NTBCL operates the Delhi-Noida toll bridge and has seen average daily traffic grow from 17,000 to over 104,000 vehicles. Traffic is expected to double by 2021.
- The company has a favorable business model requiring low capital expenditures and working capital with cash toll collections.
- Post debt restructuring in 2002 and a GDR listing in 2006, the company has a comfortable liquidity position.
- The concession agreement assures a 20% return on capital and increases the concession period if targets are not met, favoring the company.
Based
HDIL reported strong results for the first quarter of FY2011, with revenue up 52.7% year-over-year and profit up 118%. This was driven by high-margin sales of floor space index and transferable development rights, with TDR prices and volumes sustained at high levels. The company's execution of its large airport redevelopment project remains on track. HDIL is well positioned in the large market for slum redevelopment in Mumbai. Recent residential project launches have also been well received, providing revenue visibility. The analyst maintains a 'Buy' rating on the stock.
Top mailing list providers in the USA.pptxJeremyPeirce1
Discover the top mailing list providers in the USA, offering targeted lists, segmentation, and analytics to optimize your marketing campaigns and drive engagement.
Brian Fitzsimmons on the Business Strategy and Content Flywheel of Barstool S...Neil Horowitz
On episode 272 of the Digital and Social Media Sports Podcast, Neil chatted with Brian Fitzsimmons, Director of Licensing and Business Development for Barstool Sports.
What follows is a collection of snippets from the podcast. To hear the full interview and more, check out the podcast on all podcast platforms and at www.dsmsports.net
[To download this presentation, visit:
https://www.oeconsulting.com.sg/training-presentations]
This presentation is a curated compilation of PowerPoint diagrams and templates designed to illustrate 20 different digital transformation frameworks and models. These frameworks are based on recent industry trends and best practices, ensuring that the content remains relevant and up-to-date.
Key highlights include Microsoft's Digital Transformation Framework, which focuses on driving innovation and efficiency, and McKinsey's Ten Guiding Principles, which provide strategic insights for successful digital transformation. Additionally, Forrester's framework emphasizes enhancing customer experiences and modernizing IT infrastructure, while IDC's MaturityScape helps assess and develop organizational digital maturity. MIT's framework explores cutting-edge strategies for achieving digital success.
These materials are perfect for enhancing your business or classroom presentations, offering visual aids to supplement your insights. Please note that while comprehensive, these slides are intended as supplementary resources and may not be complete for standalone instructional purposes.
Frameworks/Models included:
Microsoft’s Digital Transformation Framework
McKinsey’s Ten Guiding Principles of Digital Transformation
Forrester’s Digital Transformation Framework
IDC’s Digital Transformation MaturityScape
MIT’s Digital Transformation Framework
Gartner’s Digital Transformation Framework
Accenture’s Digital Strategy & Enterprise Frameworks
Deloitte’s Digital Industrial Transformation Framework
Capgemini’s Digital Transformation Framework
PwC’s Digital Transformation Framework
Cisco’s Digital Transformation Framework
Cognizant’s Digital Transformation Framework
DXC Technology’s Digital Transformation Framework
The BCG Strategy Palette
McKinsey’s Digital Transformation Framework
Digital Transformation Compass
Four Levels of Digital Maturity
Design Thinking Framework
Business Model Canvas
Customer Journey Map
Discover timeless style with the 2022 Vintage Roman Numerals Men's Ring. Crafted from premium stainless steel, this 6mm wide ring embodies elegance and durability. Perfect as a gift, it seamlessly blends classic Roman numeral detailing with modern sophistication, making it an ideal accessory for any occasion.
https://rb.gy/usj1a2
Building Your Employer Brand with Social MediaLuanWise
Presented at The Global HR Summit, 6th June 2024
In this keynote, Luan Wise will provide invaluable insights to elevate your employer brand on social media platforms including LinkedIn, Facebook, Instagram, X (formerly Twitter) and TikTok. You'll learn how compelling content can authentically showcase your company culture, values, and employee experiences to support your talent acquisition and retention objectives. Additionally, you'll understand the power of employee advocacy to amplify reach and engagement – helping to position your organization as an employer of choice in today's competitive talent landscape.
The Genesis of BriansClub.cm Famous Dark WEb PlatformSabaaSudozai
BriansClub.cm, a famous platform on the dark web, has become one of the most infamous carding marketplaces, specializing in the sale of stolen credit card data.
Unveiling the Dynamic Personalities, Key Dates, and Horoscope Insights: Gemin...my Pandit
Explore the fascinating world of the Gemini Zodiac Sign. Discover the unique personality traits, key dates, and horoscope insights of Gemini individuals. Learn how their sociable, communicative nature and boundless curiosity make them the dynamic explorers of the zodiac. Dive into the duality of the Gemini sign and understand their intellectual and adventurous spirit.
Event Report - SAP Sapphire 2024 Orlando - lots of innovation and old challengesHolger Mueller
Holger Mueller of Constellation Research shares his key takeaways from SAP's Sapphire confernece, held in Orlando, June 3rd till 5th 2024, in the Orange Convention Center.
3 Simple Steps To Buy Verified Payoneer Account In 2024SEOSMMEARTH
Buy Verified Payoneer Account: Quick and Secure Way to Receive Payments
Buy Verified Payoneer Account With 100% secure documents, [ USA, UK, CA ]. Are you looking for a reliable and safe way to receive payments online? Then you need buy verified Payoneer account ! Payoneer is a global payment platform that allows businesses and individuals to send and receive money in over 200 countries.
If You Want To More Information just Contact Now:
Skype: SEOSMMEARTH
Telegram: @seosmmearth
Gmail: seosmmearth@gmail.com
How to Implement a Real Estate CRM SoftwareSalesTown
To implement a CRM for real estate, set clear goals, choose a CRM with key real estate features, and customize it to your needs. Migrate your data, train your team, and use automation to save time. Monitor performance, ensure data security, and use the CRM to enhance marketing. Regularly check its effectiveness to improve your business.
The APCO Geopolitical Radar - Q3 2024 The Global Operating Environment for Bu...APCO
The Radar reflects input from APCO’s teams located around the world. It distils a host of interconnected events and trends into insights to inform operational and strategic decisions. Issues covered in this edition include:
Industrial Tech SW: Category Renewal and CreationChristian Dahlen
Every industrial revolution has created a new set of categories and a new set of players.
Multiple new technologies have emerged, but Samsara and C3.ai are only two companies which have gone public so far.
Manufacturing startups constitute the largest pipeline share of unicorns and IPO candidates in the SF Bay Area, and software startups dominate in Germany.
How MJ Global Leads the Packaging Industry.pdfMJ Global
MJ Global's success in staying ahead of the curve in the packaging industry is a testament to its dedication to innovation, sustainability, and customer-centricity. By embracing technological advancements, leading in eco-friendly solutions, collaborating with industry leaders, and adapting to evolving consumer preferences, MJ Global continues to set new standards in the packaging sector.
Structural Design Process: Step-by-Step Guide for BuildingsChandresh Chudasama
The structural design process is explained: Follow our step-by-step guide to understand building design intricacies and ensure structural integrity. Learn how to build wonderful buildings with the help of our detailed information. Learn how to create structures with durability and reliability and also gain insights on ways of managing structures.
Organizational Change Leadership Agile Tour Geneve 2024
Bma ptcl company_report
1. January 28, 2010
PAKISTAN RESEARCH PTCL: REAL OPTIONS GALORE
Telecom Sector INVESTMENT SUMMARY
BUY Fit to survive - well diversified: PTCL is a well-diversified telecom
provider with its tentacles in numerous telecommunication services: fixed
line, wireless, cellular and broadband. Given the decline in the traditional
Fair Value: PKR 29 core businesses of PTCL, it now looks to its cellular and broadband
Current Price: PKR 19 segments for growth. The company is in a position to cope up with declining
revenues on the fixed line front with mounting revenues in other segments.
Saniya Rizwan Broadband structuring the momentum in revenues: Fixed line revenue
saniya.rizwan@bmacapital.com has continually been subject to a declining trend on account of the
dwindling subscriber base. However, amidst falling core revenues,
broadband has emerged as a saviour. In 1QFY10, the total broadband
revenue for the period stood at PKR830mn, up 219% YoY. With new
Universal Service Fund (USF) projects rolling out (all of which have been o
far won by PTCL), huge potential remains inherent in the segment for
PTCL. By FY14E, we expect PTCL broadband subscribers to grow to 913K
with broadband revenues coming in to the tune of PKR9.0bn.
Price and Volume Graph Cellular Still in green: In FY09, PTML contributed 36% to group earnings
with revenues clocking in at PKR34bn. PTML earnings stood at PKR1.7bn
Volume in mn (RHS) Price (LHS) in FY09 and PKR506mn in 1QFY10, showing a triple digit growth YoY. We
believe PTCL’s cellular division, Pakistan Mobile Telecommunications
28 40 Limited (PTML), will continue to contribute to growth for the group going
24 forward. We project PTML’s revenue to clock in at PKR41bn in FY10E and
30
at PKR48bn by FY14E.
20
20
16 Handsome Upside: At yesterday’s closing price of PKR19.1/share, PTCL
` 10
currently offers an upside potential of 52% to our DCF-based fair value of
12 PKR29/share. Of this, PTCL’s core business accounts for PKR20.5/share
8 0 while Ufone accounts for PKR8.5/share. We recommend a BUY stance on
Aug-09
Apr-09
Jun-09
Jul-09
the stock.
Jan-09
Feb-09
May-09
Mar-09
Sep-09
Nov-09
Jan-10
Oct-09
Dec-09
Real estate remains a possible trigger for the stock. Under the Share
Purchase Agreement, a total of 3384 properties were to be transferred to
PTCL of which 168 are still pending. The total estimated fair value of these
properties is USD1.5-2.0bn. The development, sale or revaluation of these
assets will positively boost our valuations. Owing to the lack of clarity on the
issue, we have not incuded it in our valuations.
Financials
Bloomberg PTC PA FY09A FY10E FY11E
Current Price PKR 19.09/sh EPS(PKR) 1.8 2.1 2.3
Market Cap PKR 97,359 mn Price to Earnings (x) 10.6x 9.2x 8.2x
USD 1,150.9 mn Dividend Yield (%) 7.8% 10.5% 10.5%
Free Float 11% EPS Growth (%) NM 15.6% 12.1%
Shares O/S mn 5,100 Return on Equity (%) 9.2% 10.6% 11.7%
52 week High-Low 22.8/ 11.3 Return on Assets (%) 5.9% 7.5% 8.3%
Source: BMA Research
1
2. January 28, 2010
TABLE OF CONTENTS
1 Investment Rationale 3
2 PTCL Revenue Segments and Projections 7
3 Valuations 15
4 Financials 17
5 About the Company 19
6 Industry Dynamics 20
2
3. January 28, 2010
INVESTMENT RATIONALE
FIT TO SURVIVE: WELL DIVERSIFIED
Fixed line is PTCL’s core business however following the decline in subscribers
on the fixed line front; PTCL now looks to its wireless, cellular and broadband
segments for growth. Since PTCL is a well-diversified telecom resource, we
expect PTCL to survive the fixed line attrition with growth in other segments of
the company.
PTCL’s fixed line subscribers are expected to continue to decline going forward,
with PTCL fixed line subscribers aggregating to 2.8mn by FY14E against 3.4mn
in FY09. However, we project the subscriber base of the company in cellular
and wireless segments to grow to 22.9mn and 2.5mn by FY14E against 20mn
and 1.3mn in FY09, bringing about a net increase of 3.5mn in the total PTCL
subscriber base. PTCL Broadband subscribers which at present stand at ~300K
are also expected to grow to 913K by FY14E.
An examination of the chief telecommunication divisions reveals that the
attrition in fixed line subscribers has been owing to the fixed to mobile
substitution as well as the emergent preference for Wireless Local Loop (WLL).
Fixed line subscribers have been following a declining trend since FY06, where
we saw a negligible fall of 1.4% in the subscriber base. It was however only a
beginning and what followed was a consecutive attrition in fixed line subscribers
which as per the latest statistics released by PTA stood at 3.5mn as against the
peak of 5.3mn in FY05. Concurrently, we saw a surge in the WLL and cellular
subscribers. WLL, post its introduction in 2005, saw its subscribers shoot up
from 265K in FY05 to 1mn in FY06. As at Nov 09, the total WLL subscribers
stood at 2.72mn subscribers. Cellular subscriber growth and density, however,
has far surpassed all other telecommunication segments. Cellular teledensity
stood at 59.03% in Nov09, with a total subscriber base of 96.71mn.
Industry Tele-density Projections FY10E-FY14E Industry Additional Sub Projections FY10E-FY14E
Cellular density FLL density WLL density Cellular Subscribers FLL subscribers WLL subscribers
70%
7000
6000
65% 5000
4000
60% 3000
000's
2000
55% 1000
0
-1000 FY09A FY10E FY11E FY12E FY13E FY14E
50%
-2000
FY08A FY09A FY10E FY11E FY12E FY13E FY14E
Source: PTA, BMA Research Source: PTA, BMA Research
3
4. January 28, 2010
PTCL Subscriber Projections
PTCL FLL Subscribers PTCL WLL Subscribers Ufone Subscribers
30
25
20
15
10
5
0
FY08A FY09A FY10E FY11E FY12E FY13E FY14E
Source: PTA, BMA Research
BROADBAND: THE NEXT BIG THING
PTCL has the biggest broadband coverage area. We expect PTCL broadband
subscribers to grow to 913K by FY14E from ~200K in FY09. Broadband
revenue is expected to be the major top-line driver going forward with
broadband revenue coming in to the tune of PKR9.0bn by FY14E against
~PKR2.0bn in FY09.
Broadband in Pakistan has been experiencing healthy growth with penetration
equalling 0.26% in FY09. The subscribers have showed a tremendous surge,
with the total subscriber base of 414K at end of FY09 against 168K in FY08.
To improve the telecom penetration in the country, the Government of Pakistan
has established the Universal Service Fund (USF) which subsidizes various
telecom projects. Up to date, four subsidized USF broadband projects have
been awarded, of which PTCL has won all, with a target penetration of 186K
subscribers within 1.5 years. USF subsidy is acting as a positive impetus for
broadband proliferation in the country. Going forward, we expect PTCL to
continue to be the major winner of the USF subsidized projects.
For PTCL, the declining subscriber base, coupled with falling tariffs, in all
business segments has been translating into a YoY decline in revenues. Amidst
falling core revenues, broadband has emerged as a saviour. The company has
been successful in achieving a QoQ growth of 2% in revenues attributable
primarily to the thriving broadband segment that has been triumphant in
escalating its share of overall revenues to an enormous 5.7% in 1QFY10
compared to 2.3% during the same period last year. Such a massive soar in
revenue contribution from the broadband segment was not expected to pull in
so soon.
4
5. January 28, 2010
Industry Broadband Subscribers
Broadband Subscribers Growth
1800 300%
1600
250%
1400
1200 200%
000's
1000
150%
800
600 100%
400
50%
200
0 0%
FY08A FY09A FY10E FY11E FY12E FY13E FY14E
Source: PTA, BMA Research
Since PTCL owns the biggest broadband coverage area and has four Universal
Service Funds projects in hand and a couple in the pipeline, we expect PTCL
broadband subscribers to grow to 913K by FY14E. Broadband revenue is
expected to be the major top-line driver going forward with revenue from the
head expected to clock in at PKR9.0bn, contributing 7% of consolidated
revenues by FY14E as against 2% in FY09.
PTCL Broadband Subscribers and Revenue Forecast
PTCL subscribers LHS PTCL Broadband Revenue RHS
1000 10.0
900 9.0
800 8.0
700 7.0
PKR bn
600 6.0
000's
500 5.0
400 4.0
300 3.0
200 2.0
100 1.0
0 0.0
FY09A FY10E FY11E FY12E FY13E FY14E
Source: Company Report, BMA Research
CELLULAR: CUSHION-ING THE DECLINES
PTCL’s subsidiary, Pak Telecom Mobile Limited (PTML) operating with the
brand name of Ufone, is the only cellular company in the country which reported
profit for FY09; all the other cellular operators incurred losses for the same
period. PTML reported earnings of PKR1.7bn in FY09 and showed a triple digit
growth YoY in 1QFY10 with earnings clocking in at PKR506mn. In FY09, PTML
contributed 36% to group earnings. We believe PTCL’s cellular division will
continue to contribute to growth for the group going forward. We expect the
contribution of PTML to grow to 38% in FY10E and 39% by FY14E.
5
6. January 28, 2010
Ufone Revenue and subscribers
Ufone Revenues Ufone subscribers
60 23.5
In mn
In PKR bn
23.0
50 22.5
40 22.0
21.5
30 21.0
20.5
20 20.0
10 19.5
19.0
0 18.5
FY09A FY10E FY11E FY12E FY13E FY14E
Source: PTCL Annual Report, PTA, BMA Research
6
7. January 28, 2010
PTCL REVENUE SEGMENTS & PROJECTIONS
PTCL derives revenue from multiple business segments and is the only well-
diversified telecom operator in the country. The company’s own revenues
account for about 74% of the consolidated revenues whereas 36% of the
revenues clock in from the cellular subsidiary-Ufone.
PTCL revenues are contributed by the following revenue sources:
Local loop: Fixed Local Loop (FLL) and Wireless Local Loop (WLL)
Nation Wide Dialling (NWD)
Leased lines and Interconnection revenue
International segment
Broadband
Cellular subsidiary-Ufone
PTCL Revenue Mix
PTCL Local Loop NWD International Leased Lines and Interconnect Cellular Broadband
2% 4% 5% 6% 6% 7%
36%
38% 38% 39% 39% 39%
14%
14% 14% 13% 13% 13%
16%
17% 18% 18% 18% 19%
6% 5% 4% 4% 4% 4%
25% 23% 21% 20% 20% 19%
FY09A FY10E FY11E FY12E FY13E FY14E
Source: Company Management, BMA Research
LOCAL LOOP: FIXED OUT WIRELESS IN
PTCL local loop comprises of the Fixed Local loop (FLL) and the Wireless Local
Loop (WLL).
a) Fixed Local loop (FLL)
Fixed line services have been experiencing a declining trend across the globe
owing to the introduction of novel services such as WLL and mobile phones that
are more economical, cost effective, easy to deploy and boast an array of value
added services attached to them. Fixed line teledensity stood at 2.20% at end
FY09, with total subscribers accruing to 3.5mn, down from its peak teledensity
of 3.43% in FY05 and a subscriber base of 5.3mn. Since PTCL is a near
monopoly in the market, the declining fixed line subscribers coupled with lower
line rent and traffic has hurt fixed line revenues fetched by the company.
7
8. January 28, 2010
Industry FLL Subscribers and FLL Teledensity Addition to PTCL FLL Subscribers
FLL Subcribers mn FLL Teledensity % Addition to subscribers in 1000
6.0 4.0
-443 FY09
3.5
5.0
3.0 -403 FY08
4.0
2.5
-452 FY07
3.0 2.0
1.5 -62 FY06
2.0
1.0 FY05 762
1.0
0.5
FY04 446
0.0 0.0
FY04 FY05 FY06 FY07 FY08 FY09 -600 -400 -200 0 200 400 600 800 1000
Source: PTA, BMA Research Source: PTA, BMA Research
There are six competitors in the FLL segment while it is dominated by PTCL
followed by National Telecommunication Corporation (NTC). Others are
relatively new and have not yet succeeded in creating a mark in the segment.
PTCL has the privilege of being the largest fixed line service provider; it enjoys
a near monopoly with a market share of 96%. However, declining fixed line
subscribers have hurt fixed line revenue fetched by PTCL on account of lower
line rent and reduced minutes of usage.
Fixed Line Market Share FY09
PTCL NTC Others
2.96% 1.23%
95.82%
Source: PTA
Going forward, the depletion in fixed line subscribers is expected to continue on
account of fixed to mobile and WLL substitution. We anticipate FLL penetration
to decline by 1.61% to a subscriber base of 2.88mn by FY14E
Fixed Subscriber Market Projections FY10E-FY14E
FY09A FY10E FY11E FY12E FY13E FY14E
Industry FLL Penetration 2.20% 1.98% 1.88% 1.79% 1.70% 1.61%
Industry FLL Subscribers mn 3.50 3.30 3.19 3.08 2.98 2.88
PTCL FLL Subscribers mn 3.40 3.20 3.09 2.99 2.89 2.79
Source: PTA, BMA Research
8
9. January 28, 2010
Industry FLL Projections FY10E-FY14E
Fixed Line Penetration % Fixed Line Subscibers mn
2.5 4.0
3.5
2
3.0
1.5 2.5
% 2.0
1 1.5
1.0
0.5
0.5
0 0.0
FY09A FY10E FY11E FY12E FY13E FY14E
Source: PTA, BMA Research
With PTCL being the dominant player in the FLL segment (commanding a
market share of 96%), its revenues from the segment have and are expected to
continue to decline; bringing about a decrease in total revenues as well as
change in the revenue mix of the company.
b) Wireless Local Loop (WLL)
Wireless Local Loop (WLL) is growing in popularity owing to its convenience of
use and its reach in far off areas of the country (used as Public Call Office). The
WLL requires less investment and higher returns as compared to fixed line.
Popularity of WLL services can also be gauged from the dropping figures of
fixed line subscribers especially in case of PTCL where a balancing effect of
gain and drop in WLL and FLL is going on for more than a year. With the
introduction of the wireless technology in 2005, the WLL penetration has
increased from 0.17% in 2005 to 1.6% in 2009, with subscribers growing at a
CAGR of 77%. During FY09 alone, a total of 377k subscribers have been added
by WLL operators bringing the tally of WLL subscribers to 2.6mn against 2.2mn
in FY08.
WLL Subscribers
PTCL Total
4.0
mn
3.0
2.0
1.0
0.0
FY05 FY06 FY07 FY08 FY09 Nov-09
Source: PTA, BMA Research
In the wireless segment, PTCL started with a share of 61% in 2005, however
with new entrants into the market, its market share stood at 47%, down 14% by
Nov09. Its main competitors include Telecard, WorldCall and Wateen.
9
10. January 28, 2010
Market Share WLL FY05 Market Share Nov09
PTCL TeleCard WorldCall Others
PTCL TeleCard WorldCall
1% 7%
21%
37%
48%
62%
24%
Source: PTA, BMA Research Source: PTA, BMA Research
Going forward, we expect additions to the WLL subscribers to continue, albeit at
a slower pace. We expect the industry WLL subscriber base to surpass FLL
subscribers by FY11E. WLL subscribers and penetration is expected to stand at
3.07mn and 1.84% respectively by FY10E and at 4.02mn and 2.25% by FY14E.
In addition, we expect PTCL to regain and surpass its lost market share owing
to the low call tariff rates (no line rent package) and quality service as against
the expensive Wateen and low service quality of other WLL providers. We
anticipate PTCL’s share in WLL to be 62% by FY14E with a subscriber base of
2.5mn.
WLL Subscriber Projections FY10E-FY14E
FY09A FY10E FY11E FY12E FY13E FY14E
WLL Penetration 1.60% 1.84% 2.02% 2.13% 2.23% 2.25%
WLL Subscribers mn 2.62 3.07 3.43 3.67 3.92 4.02
PTCL WLL subscribers mn 1.3 1.6 1.9 2.2 2.4 2.5
PTCL Market Share 50% 52% 55% 60% 61% 62%
Source: BMA Research
WLL Market Share Industry and PTCL WLL Subscribers mn
PTCL Others Total WLL subscribers PTCL WLL Subscribes
100%
90% FY14E
80% 40% 39% 38%
50% 48% 45%
70% FY13E
60% FY12E
50%
40% FY11E
30% 60% 61% 62% FY10E
50% 52% 55%
20%
FY09A
10%
0%
0.0 0.5 1.0 1.5 2.0 2.5 3.0 3.5 4.0 4.5
FY09A FY10E FY11E FY12E FY13E FY14E
Source: PTA, BMA Research Source: PTA, BMA Research
10
11. January 28, 2010
Local Loop which includes both fixed line and wireless, contributed ~25% to the
consolidated group revenues for PTCL in FY09. Going forward, we expect its
share in the consolidated top line to decline to 19% by FY14E.
PTCL Local loop Revenue
Local Loop Revenue Contribution to Cons. Revenue
25 30%
PKR bn
25
25%
24
24 20%
24
15%
24
24 10%
23
5%
23
23 0%
FY09A FY10E FY11E FY12E FY13E FY14E
Source: BMA Research
CELLULAR SUBSIDIARY: STILL IN THE GREEN
Pakistan has experienced multiple years of exponential growth in the cellular
segment. The strong growth was aided by inflow of foreign investment, growth
in franchising services and aggressive marketing campaigns. Cellular
subscribers grew by a 5-year CAGR of 80%, from 5mn in FY04 to 94mn in
FY09; cellular teledensity grew from 3.3% in FY04 to 59.03% in Nov-09.
After years of immense growth, Pakistan’s cellular market could not maintain
the strength in upward trend in FY09 mainly due to unstable and weak
economy, decline in the pace of foreign investment, saturation in cellular
consumer market and the impact of increased taxation. Resultantly, in FY09
total teledensity grew by a meagre 2.9% against 14.9% in FY08 with a net
addition of 6mn subscribers in FY09 against 25mn in FY08.
ARPU, MTR & On-net Airtime Market Share Nov-09
ARPU USD/mnth
Mobile Termination rate PKR/min
On-net Airtime (prepaid) PKR/min Mobilink
Warid
32%
PKR/min
10 5
USD/mth
19%
9 4.5
8 4
7 3.5
6 3
5 2.5
4 2 Telenor
3 1.5 23% Ufone
2 1 19%
1 0.5 Zong
0 0 7%
FY04 FY05 FY06 FY07 FY08 FY09
Source: PTA, BMA Research Source: PTA, BMA Research
11
12. January 28, 2010
Cellular Subscribers Projections in mn Cellular Subscribers & Penetration Projections
Mobilink Ufone Zong Cellular Subscribers mn Cellular penetration
Telenor Warid
120 64%
35
100 62%
30
60%
25 80
58%
20 60
56%
15
40
10 54%
20 52%
5
0 0 50%
FY07A FY08A FY09A FY10E FY11E FY12E FY08A FY09A FY10E FY11E FY12E FY13E FY14E
Source: PTA, BMA Research Source: PTA, BMA Research
Operating under the brand name of Mobilink, Pakistan Mobile Communications
Ltd (PMCL) dominates the cellular segment with a market share of 32% in
Nov09. Ufone (PTCL’s cellular subsidiary) currently stands on fourth position
with a market share of 21%, falling from the third position in FY09. Nonetheless,
in terms of revenues, the company stands second after Mobilink and is the only
cellular company which posted profits for FY09.
The cellular market now stands saturated. During FY10E and beyond, we
expect cellular density to grow meagrely with a total cellular subscriber base
projected at 99mn by FY10E and teledensity of 59.45%. Mobile termination
rates and tariffs have declined to as low as PKR0.9/min and PKR0.9/min
respectively and are now expected to remain stable. Average Revenue per
User (ARPUs) have fallen sharply in FY09 to USD2.48/month, down from
USD3.1/month, registering a 20% YoY decline. Operators are now focusing on
value added services to improve ARPUs.
Having attained a mature phase, we expect cellular density to stabilize at 62.5%
with a subscriber base of 111.6mn by FY14E. The market share of Ufone is
expected to remain within early twenty ranges, in-line with its historic trend.
Cellular Subscriber Projections FY10E-FY14E
FY09A FY10E FY11E FY12E FY13E FY14E
Cellular Penetration 57.4% 59.45% 60.6% 61.3% 61.86% 62.5%
Total Active Cellular Subscribers 94.34 99.07 102.81 105.65 108.56 111.55
Ufone Market share 21.2% 21.0% 20.8% 20.7% 20.6% 20.5%
Ufone subscribers 20.0 20.8 21.4 21.9 22.4 22.9
Source: BMA Research
In FY09, PTML reported net revenue of PKR34bn, contributing 36% to group
earnings. We expect the contribution of PTML to grow to 38% in FY10E and
39% by FY14E with revenues coming in to the tune of PKR41bn and PKR48bn
for the respective periods.
12
13. January 28, 2010
PTML (Ufone) Revenues and Subscribers Projections
Ufone Revenues LHS Ufone subscribers RHS
60 23.5
PKR bn
23.0
50 22.5
40 22.0
21.5
30 21.0
20.5
20 20.0
10 19.5
19.0
0 18.5
FY09A FY10E FY11E FY12E FY13E FY14E
Source: Company Annual Report, BMA Research
BROADBAND SEGMENT: GROWTH SEGMENT
With the declining fixed line segment and the maturing cellular markets, we now
look towards the broadband segment to structure growth in the telecom industry
going forward. Pakistan is ranked fourth in terms of broadband internet growth
in the world. At present the total broadband subscribers stand at 414K against
168K in FY08, depicting a growth of 146% in FY09. We expect the growth
trajectory to continue with total broadband subscribers aggregating to 1.7mn by
FY14E.
Broadband subscribers and growth Broadband subscribers by technology
Broadband subscribers Growth %
EvDO, 6%
450 300
Others, 0%
400 FTTh, 1%
250
350
300 200
250 WiMax,
150 28%
200
150 100 DSL, 59%
100
50 HFC, 6%
50
0 0
FY05 FY06 FY07 FY08 FY09
Source: PTA, BMA Research Source: PTA, BMA Research
13
14. January 28, 2010
Industry Broadband Subscribers Forecast FY10E-FY14E
Broadband Subscribers Growth
1800 300%
1600
250%
1400
1200 200%
1000
150%
800
600 100%
400
50%
200
0 0%
FY08A FY09A FY10E FY11E FY12E FY13E FY14E
Source: PTA, BMA Research
PTCL is the leader in broadband segment, with a subscriber base of ~200K in
FY09. During FY09, broadband contributed 2% to revenues, however, in
1QFY10, we saw a surge in broadband revenues, which clocked in at
PKR830mn, up 219% YoY. Since PTCL owns the biggest broadband coverage
area and with four Universal Service Fund (USF) projects in hand and many on
the way, we expect PTCL broadband subscribers to grow to 913K by FY14E.
Broadband revenue contribution to consolidated revenues is projected to go up
to 7% by FY14E.
PTCL Broadband Subscribers & Revenue Projections
PTCL subscribers LHS PTCL Broadband Revenue RHS
1000 10.0
PKR bn
000
800 8.0
600 6.0
400 4.0
200 2.0
0 0.0
FY09A FY10E FY11E FY12E FY13E FY14E
Source: PTA, BMA Research
14
15. January 28, 2010
VALUATIONS: POTENTIAL UPSIDE OF 52%!
PTCL’s own revenues account for about 74% of the consolidated revenues
whereas 36% of the revenues clock in from the cellular subsidiary-Ufone. We
have therefore used separate DCF valuation models to assess the value of
PTCL-standalone and Ufone. Using a risk-free rate of 12% and equity risk
premium of 6%, our fair value for PTCL stands at PKR29/share, of which Ufone
accounts for PKR8.5/share.
The company currently trades at FY10E P/E multiple of 9.2x and offers an
upside potential of 52% to our fair value of PKR29/share; which is one of the
highest potential upside offered by BMA Universe companies. We recommend
a BUY stance on the stock.
REGIONAL COMPARISON: ATTRACTIVELY POSITIONED
PTCL currently trades at FY10E PER of 9.2x while the regional average FY10E
PER is 13.9x. PTCL therefore trades at 34% discount to the region. Additionally,
the stock is also trading at 42% discount to the regional EV/EBITDA average of
5.2x.
Company Country Market cap P/E EV/EBITDA EPS CAGR Revenue CAGR
USD mn FY10E FY11E FY10E FY11E 10-13E 10-13E
Pakistan Telecom Pakistan 1,151 9.2 8.2 3.0 2.8 10.0% 4.0%
China Telecom China 39,968 19.3 17.5 4.4 4.1 13.0% 6.0%
Tata Communications India 2,271 10.0 7.7 7.6 6.4 N/A N/A
MTNL India 1,020 11.1 9.1 0.8 0.5 14.3% 5.0%
Singapore Telecom Singapore 33,974 11.9 11.0 7.2 6.5 6.9% 1.7%
Telekom Malaysia Malaysia 3,199 22.5 25.4 5.1 5.2 5.6% 70.0%
PT Telkom Indonesia 19,246 14.3 12.3 5.1 4.5 11.0% 7.8%
PLDT Philippines 10,375 10.9 10.3 5.6 5.2 6.2% 3.6%
Chunghwa Taiwan 19,180 14.7 13.7 5.9 6.0 2.6% 0.0%
Telstra Australia 38,592 10.3 10.1 5.3 4.9 2.9% 1.3%
Source: Morgan Stanley, BMA Research
UPSIDE TO OUR VALUATIONS: TRANSFER OF THE REAL
ESTATE ASSETS
Real estate remains a possible trigger for the stock. Under the Share Purchase
Agreement between GoP and Etisilat, a total of 3,384 properties were to be
transferred to PTCL of which 168 are still pending. The total estimated fair value
of these properties is USD1.5-2.0bn. PTCL management intends to develop the
assts presently on its balance sheet as well as those which still await transfer.
The transfer of properties and their appropriate utilization will likely bring in
additional revenue for the company and strengthen its balance sheet. Whether
the company decides to sell off these assets or employ them for revenue
generation, it will prove to be a handsome upside to our current valuation of
PKR29/share and will boost our revenue and profitability estimates. Since the
matter still remains in the air, we have not included it as part of our valuation
estimates.
15
16. January 28, 2010
POTENTIAL RISK FACTORS
Faster Than Anticipated Fixed Line Attrition
Faster than anticipated decline in fixed line may negatively hurt our revenue
projections and cause the fair value to be distorted.
Entry of Competitors
Competition in the business segments of broadband, cellular, WLL and LDI may
cause PTCL’s market share to shrink hence distorting our revenues and
profitability projections.
Ongoing Legal Issues: SHC Stay Order
A division bench of the Sindh High Court has stayed the transfer of moveable
and immoveable assets of the Pakistan Telecommunication Company Limited
to Etisalat Telecom, which owns 26 per cent controlling shares of the telecom
giant. The matter is yet pending and is unlikely to impact profitability. However,
news on this aspect may create a negative sentiment on the stock in the
market.
16
18. January 28, 2010
PTML-STANDALONE
Balance Sheet PKR mn FY09A FY10E FY11E FY12E FY13E FY14E
Assets
Non Current Assets 99,828 89,331 83,981 78,114 72,304 67,149
Current Assets 54,220 50,849 57,967 66,255 76,394 87,778
Total Assets 154,048 140,180 141,948 144,368 148,699 154,927
Equity and Liabilities
Current Liabilities 36,086 22,649 22,720 22,499 22,810 23,163
Non current liabilities 18,572 17,785 17,859 17,913 17,971 18,014
Total liabilities 54,659 40,434 40,579 40,413 40,780 41,177
Share Capital and Reserves 99,390 99,746 101,369 103,955 107,918 113,749
Total Equity & Liabilities 154,048 140,180 141,949 144,368 148,699 154,927
Income Statemnt PKR mn FY09A FY10E FY11E FY12E FY13E FY14E
Revenue 33,481 41,055 43,553 45,247 46,782 48,380
Less operating Costs 29,560 31,358 32,578 33,683 34,833
EBITDA 11,495 12,195 12,669 13,099 13,546
Less:
Depreciation (7,678) (7,232) (6,735) (6,195) (5,713)
Amortisation (62) (56) (50) (45) (41)
EBIT 5,327 3,756 4,908 5,884 6,860 7,792
Interest Expense (1,340) (1,790) (2,029) (1,066) (1,066)
Interest Income 1,407 2,024 2,165 2,270 2,679
EBT 3,823 5,142 6,020 8,063 9,405
Taxes (1,223) (1,645) (1,926) (2,580) (3,010)
NPAT 1,771 2,600 3,497 4,094 5,483 6,396
Ratios FY09A FY10E FY11E FY12E FY13E FY14E
EPS (PKR) 5.1 7.4 10.0 11.7 15.7 18.3
EPS Growth % - 47% 34% 17% 34% 17%
ROE % 30% 37% 39% 36% 38% 36%
ROA % 3% 4% 5% 6% 8% 9%
PAT margin % 5% 6% 8% 9% 12% 13%
BVPS (PKR) 16.8 20.2 25.7 32.2 40.8 50.8
Balance Sheet PKR mn FY09A FY10E FY11E FY12E FY13E FY14E
Assets
Non Current Assets 49,685 44,896 40,609 36,824 33,584 30,830
Current Assets 11,406 23,778 30,592 28,035 34,658 41,313
Total Assets 61,092 68,674 71,201 64,859 68,242 72,143
Equity and Liabilities
Current Liabilities 26,704 18,399 18,998 19,405 19,773 20,156
Non current liabilities 28,524 43,192 43,192 34,192 34,192 34,191
Total liabilities 55,228 61,592 62,191 53,597 53,965 54,348
Share Capital and Reserves 5,863 7,087 9,010 11,262 14,278 17,795
18 Total Equity & Liabilities 61,092 68,679 71,201 64,859 68,242 72,143
19. January 28, 2010
PTCL - ABOUT THE COMPANY
Pakistan Telecommunication Company Limited (PTCL) is the largest
telecommunication company in the country. The company provides telephony
services to the nation and holds the status of a backbone for the country's
telecommunication infrastructure despite arrival of a dozen other
telecommunication companies. The company consists of around 2,000
telephone exchanges across country providing largest fixed line network. In
addition to wire line operations, PTCL also provides fixed line service through its
countrywide CDMA based WLL (Wireless Local Loop) network, under the Vfone
brand name. In the cellular segment, the second largest cellular provider in
Pakistan, Ufone, is also a wholly owned subsidiary of PTCL. Internet is another
resource of PTCL, all making it a gigantic organization.
PTCL was privatized in 2005 whereby UAE based group Etisalat acquired 26%
stake in the company at a price of USD2.6bn. Government of Pakistan now
owns 62% of the company’s shares whereas Etisalat owns 26%.
19
20. January 28, 2010
INDUSTRY DYNAMICS
TELECOM REVENUES, SUBSCRIPTION & TELEDENSITY
GROWING
Despite slowdown in economy, telecom sector continued to grow in terms of
revenues, subscriptions and teledensity. Revenue growth in the telecom sector
remained robust during FY09. The telecom sector generated revenue to the
tune of PKR333.9bn against PKR278.5bn in FY08, up 19.8% YoY. The cellular
sector continued to be the major contributor to the telecom revenues, with
contribution aggregating to 64% of total telecom revenues in FY09.
Telecom Revenue Growth in teledensity
Total Revenues PKR bn Growth %
400 40.0
20%
350 35.0
300 30.0
15%
250 25.0
200 20.0 10%
150 15.0
100 10.0 5%
50 5.0
0%
0 0.0
FY02 FY03 FY04 FY05 FY06 FY07 FY08 FY09
FY04 FY05 FY06 FY07 FY08 FY09
Source: PTA, BMA Research Source: PTA, BMA Research
By the end of FY09, total teledensity reached 61.8%. Cellular segment leads
the way with teledensity of 58.2% at end of FY09, which soared to 58.6% by
1QFY10. This is followed by FLL with a teledensity of 2.2% in FY09 and WLL
with a teledensity of 1.6% in FY09.
Total Teledensity Total Subscribers
Addition to Subscribers Projections FY10E-FY14E
Teledensity Projections FY10E-FY14E
Cellular Subscribers FLL subscribers WLL subscribers
Cellular density FLL density WLL density
8000
70%
6000
65%
4000
60%
2000
55%
0
50%
FY09A FY10E FY11E FY12E FY13E FY14E
FY08A FY09A FY10E FY11E FY12E FY13E FY14E
-2000
Source: PTA, BMA Research Source: PTA, BMA Research
20
21. January 28, 2010
FOREIGN DIRECT INVESTMENT: POSITIVE IMPETUS FOR
GROWTH
The liberalization of Pakistan's telecommunications industry began in 1997.
Government of Pakistan awarded status of industry to the telecom sector in
year 2003-04 and announced the Telecom Deregulation Policy. Post
deregulation, the telecom sector attracted huge foreign investment inflows. In
FY08 and FY09, despite a slowdown in the economy, the telecom sector
continued to attract a major share of FDI in Pakistan. In FY08, the telecom
sector alone received USD1.44bn in Foreign Direct Investment (FDI) – about
27% of the country’s total foreign direct investment. This huge FDI inflow has
worked largely in promoting the telecom industry. During FY09, telecom sector
total FDI stood at USD815mn, down 43% YoY. The current wave of uncertainty
in the global demand and economic activity in the country has had a major
backlash on FDI inflows.
Foreign Direct Investment Foreign Direct Investment Proportion
FDI Others FDI Telecom FDI Telecom FDI Others
4500 100%
USD mn
4000
3500 80%
3000
60%
2500
2000
40%
1500
1000 20%
500
0 0%
FY02 FY03 FY04 FY05 FY06 FY07 FY08 FY09 FY02 FY03 FY04 FY05 FY06 FY07 FY08 FY09
Source: PTA, BMA Research Source: PTA, BMA Research
TAXES ON TELECOM SECTOR
Telecom is an important sector contributing about 3% in the national GDP.
During FY08, telecom contributed PKR111.63bn to national exchequer. In
FY09, the government of Pakistan raised over 40% FED/GST rate on the
telecom sector as compared to only 7% for the other sectors. Owing to this, the
FBR revenue from GST has declined in the two quarters subsequent to the
imposition. However, the total contribution of telecom to the national exchequer
of PKR112bn in FY09 remains almost at par with the prior year.
GST/CED collection from Telecom Sector Telecom Contribution to Exchequer
Basic Cellular Other Operators
Telecom Contribution to Exchequer
2.0
50 0.9
PKR bn
45 FY09 112
40 0.2
35 FY08 112
0.3
30
40.1 FY07 101
25 36.8
28.2
20 FY06 77
18.8
15
10 FY05 67
5 7.7 7.9 6.9 7.3 FY04 38
0 PKR bn
FY06 FY07 FY08 FY09
21 0 50 100 150
Source: PTA, BMA Research Source: PTA, BMA Research
22. January 28, 2010
DISCLAIMER
This memorandum is produced by BMA Capital Management Limited and is
only for the use of their clients. While the information contained herein is from
sources believed reliable, we do not represent that it is accurate or complete
and should not be relied upon as such. Opinions expressed may be revised at
any time. This memorandum is for information only and is not an offer to buy or
sell, or solicitation of any offer to buy or sell the securities mentioned.
ANALYST CERTIFICATION
I, Saniya Rizwan, hereby certify that this report represents my personal opinions
and analysis of information. All views are accurately expressed to the best of
my knowledge. I certify that no part of my remuneration is linked either directly
or indirectly to recommendations or analysis covered in this report.
22