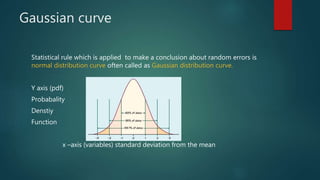
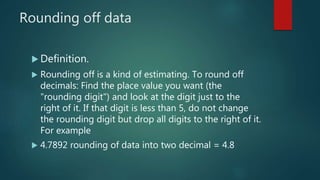
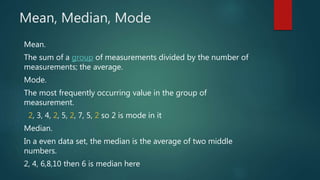
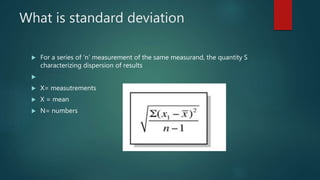
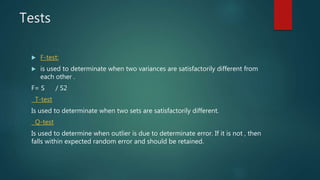
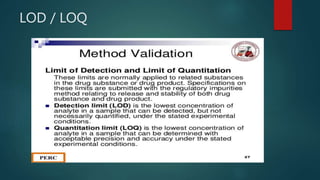
SlideShare a Scribd company logo
Statistical analysis &
errors
What is statistical analysis ?
The science that deals with the collection, analysis, and interpret
ation of numerical data, often using probability theory.
 The data themselves
 In data there is always errors due to human and instrumental
errors some can be corrected and avoided but some can not
because they are inderminate
Determinate Errors—They Are
Systematic
Determinate or systematic errors are
nonrandom and occur when something is
intrinsically wrong in the measurement.
They can be avoided or corrected
 Measurements errors can be divided into two
components
 Non random errors
 Systematic errors
 Non Random error
 They have slight order.
 Systematic error
 repeatable error associated with faulty equipment or a flawed
experiment design. These errors are usually caused by
measuring instruments that are incorrectly calibrated or are
used incorrectly.
 Determinate errors (systematic errors) are those that, as the name implies,
are determinable means they can be corrected or avoided.
 1) Mis-calibration of apparatus. This can be removed by checking the
apparatus against a standard.
 (2) Faulty observation. This is avoidable, and therefore should not be cited
as a source of error in any well-performed experiment.
 The error can be proportional to sample size or may change in a more
complex manner
 Variation are usually unidirectional
 As in the case of solubility loss of precipitate due to its solubility . Such an
example is the change in solution volume and concentration occurring
with changes in temperature. This can be corrected for by measuring the
solution temperature. Such measurable determinate errors are classed as
systematic errors.
Inderminate errors or random errors
 Inderminate errors are always random errors and can not be avoided
 Random errors ( inderminate)
It is caused by inherently unpredictable
fluctuations in the readings of a
measurement apparatus or in the
experimenter's interpretation of the
instrumental reading.
 Random errors are often called as accidental error.
 Random errors are indeterminate which means they
can not be determined/ calculated. But, we can make
a certain conclusion about these random errors by
applying mathematical more precisely statistical rules.
Gaussian curve
Statistical rule which is applied to make a conclusion about random errors is
normal distribution curve often called as Gaussian distribution curve.
Y axis (pdf)
Probabality
Denstiy
Function
x –axis (variables) standard deviation from the mean
Significant figures
 Definition
 the number of digits necessary to express the results of a measurement
consistent with the measured precision.
 Since there is uncertainty in any measurement of atleast +_ 1 in the last
significant figures.
 Rules
 Non-zero digits are always significant.
 Any zeros between two significant digits are significant.
 Zeros on the left side are always non-significant while zeros on right side
always significant.
For example
 0.216 Three significant figures
 90.7 Three significant figures
 800.0 Four significant figures
 0.0670 Three significant figures
Rounding off data
 Definition.
 Rounding off is a kind of estimating. To round off
decimals: Find the place value you want (the
"rounding digit") and look at the digit just to the
right of it. If that digit is less than 5, do not change
the rounding digit but drop all digits to the right of it.
For example
 4.7892 rounding of data into two decimal = 4.8
Mean, Median, Mode
Mean.
The sum of a group of measurements divided by the number of
measurements; the average.
Mode.
The most frequently occurring value in the group of
measurement.
2, 3, 4, 2, 5, 2, 7, 5, 2 so 2 is mode in it
Median.
In a even data set, the median is the average of two middle
numbers.
2, 4, 6,8,10 then 6 is median here
What is standard deviation
 For a series of ‘n’ measurement of the same measurand, the quantity S
characterizing dispersion of results

 X= measutrements
 X = mean
 N= numbers
Tests
 F-test:
 is used to determinate when two variances are satisfactorily different from
each other .
F= S / S2
T-test
Is used to determinate when two sets are satisfactorily different.
Q-test
Is used to determine when outlier is due to determinate error. If it is not , then
falls within expected random error and should be retained.
QC/QA
 A good laboratory practice (GLP) means who is defining for and what
purpose. A good laboratory should have
 Management
 Personnel
 Facilities
 Equipment
 Operation
 Method validation
 Quality assurance
 Good laboratory practices have been established by
worldwide bodies such as the Organization for
Economic Cooperation and Development (OECD)
and the International Organization for
Standardization (ISO). Government agencies have
adopted them for their purposes as rules that must
be followed for laboratories involved in analyzing
substances that require regulation. Examples are
pharmaceutical formulations, foods, and
environmentally important samples.
GLPs
 GLPs ( good laboratory practice) a body of rules, operating
procedures, and practices established by a given organization
that are considered to be mandatory with a view to ensuring
quality and correctness in the results produced by a
laboratory.
 GLP ensures correct results are reported.
 The laboratory should have two things
 1. SOPs ( standard operating procedures)
 2. QAU (quality assurance unit)
SOPs
 Standard operating procedures provide detailed
descriptions of activities performed by the laboratory.
 1) sample custody chain
 2)sample handling and preparation
 3) the analytical method
 4) instrument maintenance
 5) record keeping
QAU (quality assurance unit)
 The QAU is responsible for assuring good
laboratory practices are implemented.
Everyone in the lab is responsible for following
them.
Validation of analytical methods
 Validation process
 1) selectivity
 2) Linearity
 3) accuracy
 4) Precision
 5) Sensitivity
 6) Range
7) Limit of detection (LOD)
 8) Limit of quantitation
 9) Ruggedness or robustness
Selectivity
 Selectivity is basically the extent that the method can measure the analyte
of interest in the matrices of sample being analyzed without interference
from the matrix. Matrix effect may be either positive or negative
Matrix
 Matrix is everything in a sample except the actual analyte
Linearity
Accuracy
Precision
Sensitivity
The sensitivity is determined by slope of the calibration
curve and generally reflects the ability to distinguish
two different concentrations
You can measure slope or measure sample of closely
related conc. At high, intermediate, and low
concentrations
Range
 Range is actually an interval between upper and
lower concentrations of analyte in sample
LOD / LOQ
Robustness
Statistical analysis & errors (lecture 3)

More Related Content

What's hot

Linear regression
Linear regressionLinear regression
Linear regressionTech_MX
 
Wilcoxon Rank-Sum Test
Wilcoxon Rank-Sum TestWilcoxon Rank-Sum Test
Wilcoxon Rank-Sum Test
Lakshmi Anush
 
Chapter 12 outlier
Chapter 12 outlierChapter 12 outlier
Chapter 12 outlier
Houw Liong The
 
Principal component analysis
Principal component analysisPrincipal component analysis
Principal component analysis
Partha Sarathi Kar
 
PCA (Principal Component Analysis)
PCA (Principal Component Analysis)PCA (Principal Component Analysis)
PCA (Principal Component Analysis)
Luis Serrano
 
Least Significance Difference:Biostatics and Research Methodology
Least Significance Difference:Biostatics and Research MethodologyLeast Significance Difference:Biostatics and Research Methodology
Least Significance Difference:Biostatics and Research Methodology
Nigar Kadar Mujawar,Womens College of Pharmacy,Peth Vadgaon,Kolhapur,416112
 
Estimation theory 1
Estimation theory 1Estimation theory 1
Estimation theory 1
Gopi Saiteja
 
Quadrupole mass spectrometer
Quadrupole mass spectrometerQuadrupole mass spectrometer
Quadrupole mass spectrometer
Reshmi Rao
 
Calibration of uv vissible spectroscopy
Calibration of uv vissible spectroscopyCalibration of uv vissible spectroscopy
Calibration of uv vissible spectroscopy
Poornima Santhosh
 
Multiple Regression Analysis (MRA)
Multiple Regression Analysis (MRA)Multiple Regression Analysis (MRA)
Multiple Regression Analysis (MRA)
Naveen Kumar Medapalli
 
Introduction to t-tests (statistics)
Introduction to t-tests (statistics)Introduction to t-tests (statistics)
Introduction to t-tests (statistics)
Dr Bryan Mills
 
Accuracy and precision presentation
Accuracy and precision presentationAccuracy and precision presentation
Accuracy and precision presentation
SampatChoudhary4
 
The Kruskal-Wallis H Test
The Kruskal-Wallis H TestThe Kruskal-Wallis H Test
The Kruskal-Wallis H Test
Dr. Ankit Gaur
 
Anova.ppt
Anova.pptAnova.ppt
Anova.ppt
satyamsk
 
PCA (Principal component analysis)
PCA (Principal component analysis)PCA (Principal component analysis)
PCA (Principal component analysis)
Learnbay Datascience
 
Anomaly Detection
Anomaly DetectionAnomaly Detection
Anomaly Detection
guest0edcaf
 
Dimensionality Reduction
Dimensionality ReductionDimensionality Reduction
Dimensionality Reduction
mrizwan969
 
Pca
PcaPca
Inferential Statistics
Inferential StatisticsInferential Statistics
Inferential Statistics
Kush Kulshrestha
 

What's hot (20)

Testing of hypothesis
Testing of hypothesisTesting of hypothesis
Testing of hypothesis
 
Linear regression
Linear regressionLinear regression
Linear regression
 
Wilcoxon Rank-Sum Test
Wilcoxon Rank-Sum TestWilcoxon Rank-Sum Test
Wilcoxon Rank-Sum Test
 
Chapter 12 outlier
Chapter 12 outlierChapter 12 outlier
Chapter 12 outlier
 
Principal component analysis
Principal component analysisPrincipal component analysis
Principal component analysis
 
PCA (Principal Component Analysis)
PCA (Principal Component Analysis)PCA (Principal Component Analysis)
PCA (Principal Component Analysis)
 
Least Significance Difference:Biostatics and Research Methodology
Least Significance Difference:Biostatics and Research MethodologyLeast Significance Difference:Biostatics and Research Methodology
Least Significance Difference:Biostatics and Research Methodology
 
Estimation theory 1
Estimation theory 1Estimation theory 1
Estimation theory 1
 
Quadrupole mass spectrometer
Quadrupole mass spectrometerQuadrupole mass spectrometer
Quadrupole mass spectrometer
 
Calibration of uv vissible spectroscopy
Calibration of uv vissible spectroscopyCalibration of uv vissible spectroscopy
Calibration of uv vissible spectroscopy
 
Multiple Regression Analysis (MRA)
Multiple Regression Analysis (MRA)Multiple Regression Analysis (MRA)
Multiple Regression Analysis (MRA)
 
Introduction to t-tests (statistics)
Introduction to t-tests (statistics)Introduction to t-tests (statistics)
Introduction to t-tests (statistics)
 
Accuracy and precision presentation
Accuracy and precision presentationAccuracy and precision presentation
Accuracy and precision presentation
 
The Kruskal-Wallis H Test
The Kruskal-Wallis H TestThe Kruskal-Wallis H Test
The Kruskal-Wallis H Test
 
Anova.ppt
Anova.pptAnova.ppt
Anova.ppt
 
PCA (Principal component analysis)
PCA (Principal component analysis)PCA (Principal component analysis)
PCA (Principal component analysis)
 
Anomaly Detection
Anomaly DetectionAnomaly Detection
Anomaly Detection
 
Dimensionality Reduction
Dimensionality ReductionDimensionality Reduction
Dimensionality Reduction
 
Pca
PcaPca
Pca
 
Inferential Statistics
Inferential StatisticsInferential Statistics
Inferential Statistics
 

Similar to Statistical analysis & errors (lecture 3)

Chapter_05.ppt
Chapter_05.pptChapter_05.ppt
Chapter_05.ppt
SauravPaul47
 
146056297 cc-modul
146056297 cc-modul146056297 cc-modul
146056297 cc-modul
homeworkping3
 
Chapter1ccccccccccccxxxxxxxxxxxxxxxxxxxxxxxxxxxxxxxx.pdf
Chapter1ccccccccccccxxxxxxxxxxxxxxxxxxxxxxxxxxxxxxxx.pdfChapter1ccccccccccccxxxxxxxxxxxxxxxxxxxxxxxxxxxxxxxx.pdf
Chapter1ccccccccccccxxxxxxxxxxxxxxxxxxxxxxxxxxxxxxxx.pdf
halilyldrm13
 
02training material for msa
02training material for msa02training material for msa
02training material for msa營松 林
 
Errors in Chemical Analysis and Sampling
Errors in Chemical Analysis and SamplingErrors in Chemical Analysis and Sampling
Errors in Chemical Analysis and Sampling
Umer Ali
 
Quality control
Quality controlQuality control
Quality control
SKYFALL
 
Chapter 3.pptx
Chapter 3.pptxChapter 3.pptx
Chapter 3.pptx
mahamoh6
 
DSE-2, ANALYTICAL METHODS.pptx
DSE-2, ANALYTICAL METHODS.pptxDSE-2, ANALYTICAL METHODS.pptx
DSE-2, ANALYTICAL METHODS.pptx
Mathabhanga College
 
CAE344 ESA UNIT I.pptx
CAE344 ESA UNIT I.pptxCAE344 ESA UNIT I.pptx
CAE344 ESA UNIT I.pptx
ssuser7f5130
 
Errors.pptx
Errors.pptxErrors.pptx
Errors.pptx
Vastvikta Sahai
 
Analytical chemistry_Instrumentation_Introduction
Analytical chemistry_Instrumentation_IntroductionAnalytical chemistry_Instrumentation_Introduction
Analytical chemistry_Instrumentation_Introduction
Bivek Timalsina
 
Data analysis
Data analysisData analysis
Data analysis
SANTHANAM V
 
Evaluation of methods in clinical laboratory
Evaluation of methods in clinical laboratoryEvaluation of methods in clinical laboratory
Evaluation of methods in clinical laboratory
DrMAnwar2
 
Error analytical
Error analyticalError analytical
Error analytical
Lovnish Thakur
 
Modul Ajar Statistika Inferensia ke-13: Analisis Variansi, Eksperimentasi Fak...
Modul Ajar Statistika Inferensia ke-13: Analisis Variansi, Eksperimentasi Fak...Modul Ajar Statistika Inferensia ke-13: Analisis Variansi, Eksperimentasi Fak...
Modul Ajar Statistika Inferensia ke-13: Analisis Variansi, Eksperimentasi Fak...
Arif Rahman
 
Basics of quality assurance laboratory services
Basics of quality assurance laboratory servicesBasics of quality assurance laboratory services
Basics of quality assurance laboratory services
AhmadAlnatour5
 
Chapter 12
Chapter 12Chapter 12
Chapter 12
ECRD IN
 
Quality Assurance and Quality Control
Quality Assurance and Quality ControlQuality Assurance and Quality Control
Quality Assurance and Quality Control
ECRD IN
 

Similar to Statistical analysis & errors (lecture 3) (20)

Chapter_05.ppt
Chapter_05.pptChapter_05.ppt
Chapter_05.ppt
 
146056297 cc-modul
146056297 cc-modul146056297 cc-modul
146056297 cc-modul
 
Chapter1ccccccccccccxxxxxxxxxxxxxxxxxxxxxxxxxxxxxxxx.pdf
Chapter1ccccccccccccxxxxxxxxxxxxxxxxxxxxxxxxxxxxxxxx.pdfChapter1ccccccccccccxxxxxxxxxxxxxxxxxxxxxxxxxxxxxxxx.pdf
Chapter1ccccccccccccxxxxxxxxxxxxxxxxxxxxxxxxxxxxxxxx.pdf
 
02training material for msa
02training material for msa02training material for msa
02training material for msa
 
Errors in Chemical Analysis and Sampling
Errors in Chemical Analysis and SamplingErrors in Chemical Analysis and Sampling
Errors in Chemical Analysis and Sampling
 
Quality control
Quality controlQuality control
Quality control
 
Chapter 3.pptx
Chapter 3.pptxChapter 3.pptx
Chapter 3.pptx
 
DSE-2, ANALYTICAL METHODS.pptx
DSE-2, ANALYTICAL METHODS.pptxDSE-2, ANALYTICAL METHODS.pptx
DSE-2, ANALYTICAL METHODS.pptx
 
CAE344 ESA UNIT I.pptx
CAE344 ESA UNIT I.pptxCAE344 ESA UNIT I.pptx
CAE344 ESA UNIT I.pptx
 
1.1 STATISTICS
1.1 STATISTICS1.1 STATISTICS
1.1 STATISTICS
 
Errors.pptx
Errors.pptxErrors.pptx
Errors.pptx
 
Analytical chemistry_Instrumentation_Introduction
Analytical chemistry_Instrumentation_IntroductionAnalytical chemistry_Instrumentation_Introduction
Analytical chemistry_Instrumentation_Introduction
 
Data analysis
Data analysisData analysis
Data analysis
 
Evaluation of methods in clinical laboratory
Evaluation of methods in clinical laboratoryEvaluation of methods in clinical laboratory
Evaluation of methods in clinical laboratory
 
Error analytical
Error analyticalError analytical
Error analytical
 
Modul Ajar Statistika Inferensia ke-13: Analisis Variansi, Eksperimentasi Fak...
Modul Ajar Statistika Inferensia ke-13: Analisis Variansi, Eksperimentasi Fak...Modul Ajar Statistika Inferensia ke-13: Analisis Variansi, Eksperimentasi Fak...
Modul Ajar Statistika Inferensia ke-13: Analisis Variansi, Eksperimentasi Fak...
 
Errors in measurement
Errors in measurementErrors in measurement
Errors in measurement
 
Basics of quality assurance laboratory services
Basics of quality assurance laboratory servicesBasics of quality assurance laboratory services
Basics of quality assurance laboratory services
 
Chapter 12
Chapter 12Chapter 12
Chapter 12
 
Quality Assurance and Quality Control
Quality Assurance and Quality ControlQuality Assurance and Quality Control
Quality Assurance and Quality Control
 

Recently uploaded

Seminar of U.V. Spectroscopy by SAMIR PANDA
 Seminar of U.V. Spectroscopy by SAMIR PANDA Seminar of U.V. Spectroscopy by SAMIR PANDA
Seminar of U.V. Spectroscopy by SAMIR PANDA
SAMIR PANDA
 
Phenomics assisted breeding in crop improvement
Phenomics assisted breeding in crop improvementPhenomics assisted breeding in crop improvement
Phenomics assisted breeding in crop improvement
IshaGoswami9
 
bordetella pertussis.................................ppt
bordetella pertussis.................................pptbordetella pertussis.................................ppt
bordetella pertussis.................................ppt
kejapriya1
 
Orion Air Quality Monitoring Systems - CWS
Orion Air Quality Monitoring Systems - CWSOrion Air Quality Monitoring Systems - CWS
Orion Air Quality Monitoring Systems - CWS
Columbia Weather Systems
 
如何办理(uvic毕业证书)维多利亚大学毕业证本科学位证书原版一模一样
如何办理(uvic毕业证书)维多利亚大学毕业证本科学位证书原版一模一样如何办理(uvic毕业证书)维多利亚大学毕业证本科学位证书原版一模一样
如何办理(uvic毕业证书)维多利亚大学毕业证本科学位证书原版一模一样
yqqaatn0
 
20240520 Planning a Circuit Simulator in JavaScript.pptx
20240520 Planning a Circuit Simulator in JavaScript.pptx20240520 Planning a Circuit Simulator in JavaScript.pptx
20240520 Planning a Circuit Simulator in JavaScript.pptx
Sharon Liu
 
DMARDs Pharmacolgy Pharm D 5th Semester.pdf
DMARDs Pharmacolgy Pharm D 5th Semester.pdfDMARDs Pharmacolgy Pharm D 5th Semester.pdf
DMARDs Pharmacolgy Pharm D 5th Semester.pdf
fafyfskhan251kmf
 
Deep Behavioral Phenotyping in Systems Neuroscience for Functional Atlasing a...
Deep Behavioral Phenotyping in Systems Neuroscience for Functional Atlasing a...Deep Behavioral Phenotyping in Systems Neuroscience for Functional Atlasing a...
Deep Behavioral Phenotyping in Systems Neuroscience for Functional Atlasing a...
Ana Luísa Pinho
 
platelets_clotting_biogenesis.clot retractionpptx
platelets_clotting_biogenesis.clot retractionpptxplatelets_clotting_biogenesis.clot retractionpptx
platelets_clotting_biogenesis.clot retractionpptx
muralinath2
 
Unveiling the Energy Potential of Marshmallow Deposits.pdf
Unveiling the Energy Potential of Marshmallow Deposits.pdfUnveiling the Energy Potential of Marshmallow Deposits.pdf
Unveiling the Energy Potential of Marshmallow Deposits.pdf
Erdal Coalmaker
 
mô tả các thí nghiệm về đánh giá tác động dòng khí hóa sau đốt
mô tả các thí nghiệm về đánh giá tác động dòng khí hóa sau đốtmô tả các thí nghiệm về đánh giá tác động dòng khí hóa sau đốt
mô tả các thí nghiệm về đánh giá tác động dòng khí hóa sau đốt
HongcNguyn6
 
Observation of Io’s Resurfacing via Plume Deposition Using Ground-based Adapt...
Observation of Io’s Resurfacing via Plume Deposition Using Ground-based Adapt...Observation of Io’s Resurfacing via Plume Deposition Using Ground-based Adapt...
Observation of Io’s Resurfacing via Plume Deposition Using Ground-based Adapt...
Sérgio Sacani
 
Remote Sensing and Computational, Evolutionary, Supercomputing, and Intellige...
Remote Sensing and Computational, Evolutionary, Supercomputing, and Intellige...Remote Sensing and Computational, Evolutionary, Supercomputing, and Intellige...
Remote Sensing and Computational, Evolutionary, Supercomputing, and Intellige...
University of Maribor
 
What is greenhouse gasses and how many gasses are there to affect the Earth.
What is greenhouse gasses and how many gasses are there to affect the Earth.What is greenhouse gasses and how many gasses are there to affect the Earth.
What is greenhouse gasses and how many gasses are there to affect the Earth.
moosaasad1975
 
Richard's aventures in two entangled wonderlands
Richard's aventures in two entangled wonderlandsRichard's aventures in two entangled wonderlands
Richard's aventures in two entangled wonderlands
Richard Gill
 
THEMATIC APPERCEPTION TEST(TAT) cognitive abilities, creativity, and critic...
THEMATIC  APPERCEPTION  TEST(TAT) cognitive abilities, creativity, and critic...THEMATIC  APPERCEPTION  TEST(TAT) cognitive abilities, creativity, and critic...
THEMATIC APPERCEPTION TEST(TAT) cognitive abilities, creativity, and critic...
Abdul Wali Khan University Mardan,kP,Pakistan
 
Deep Software Variability and Frictionless Reproducibility
Deep Software Variability and Frictionless ReproducibilityDeep Software Variability and Frictionless Reproducibility
Deep Software Variability and Frictionless Reproducibility
University of Rennes, INSA Rennes, Inria/IRISA, CNRS
 
Mudde & Rovira Kaltwasser. - Populism - a very short introduction [2017].pdf
Mudde & Rovira Kaltwasser. - Populism - a very short introduction [2017].pdfMudde & Rovira Kaltwasser. - Populism - a very short introduction [2017].pdf
Mudde & Rovira Kaltwasser. - Populism - a very short introduction [2017].pdf
frank0071
 
Mudde & Rovira Kaltwasser. - Populism in Europe and the Americas - Threat Or...
Mudde &  Rovira Kaltwasser. - Populism in Europe and the Americas - Threat Or...Mudde &  Rovira Kaltwasser. - Populism in Europe and the Americas - Threat Or...
Mudde & Rovira Kaltwasser. - Populism in Europe and the Americas - Threat Or...
frank0071
 
Eukaryotic Transcription Presentation.pptx
Eukaryotic Transcription Presentation.pptxEukaryotic Transcription Presentation.pptx
Eukaryotic Transcription Presentation.pptx
RitabrataSarkar3
 

Recently uploaded (20)

Seminar of U.V. Spectroscopy by SAMIR PANDA
 Seminar of U.V. Spectroscopy by SAMIR PANDA Seminar of U.V. Spectroscopy by SAMIR PANDA
Seminar of U.V. Spectroscopy by SAMIR PANDA
 
Phenomics assisted breeding in crop improvement
Phenomics assisted breeding in crop improvementPhenomics assisted breeding in crop improvement
Phenomics assisted breeding in crop improvement
 
bordetella pertussis.................................ppt
bordetella pertussis.................................pptbordetella pertussis.................................ppt
bordetella pertussis.................................ppt
 
Orion Air Quality Monitoring Systems - CWS
Orion Air Quality Monitoring Systems - CWSOrion Air Quality Monitoring Systems - CWS
Orion Air Quality Monitoring Systems - CWS
 
如何办理(uvic毕业证书)维多利亚大学毕业证本科学位证书原版一模一样
如何办理(uvic毕业证书)维多利亚大学毕业证本科学位证书原版一模一样如何办理(uvic毕业证书)维多利亚大学毕业证本科学位证书原版一模一样
如何办理(uvic毕业证书)维多利亚大学毕业证本科学位证书原版一模一样
 
20240520 Planning a Circuit Simulator in JavaScript.pptx
20240520 Planning a Circuit Simulator in JavaScript.pptx20240520 Planning a Circuit Simulator in JavaScript.pptx
20240520 Planning a Circuit Simulator in JavaScript.pptx
 
DMARDs Pharmacolgy Pharm D 5th Semester.pdf
DMARDs Pharmacolgy Pharm D 5th Semester.pdfDMARDs Pharmacolgy Pharm D 5th Semester.pdf
DMARDs Pharmacolgy Pharm D 5th Semester.pdf
 
Deep Behavioral Phenotyping in Systems Neuroscience for Functional Atlasing a...
Deep Behavioral Phenotyping in Systems Neuroscience for Functional Atlasing a...Deep Behavioral Phenotyping in Systems Neuroscience for Functional Atlasing a...
Deep Behavioral Phenotyping in Systems Neuroscience for Functional Atlasing a...
 
platelets_clotting_biogenesis.clot retractionpptx
platelets_clotting_biogenesis.clot retractionpptxplatelets_clotting_biogenesis.clot retractionpptx
platelets_clotting_biogenesis.clot retractionpptx
 
Unveiling the Energy Potential of Marshmallow Deposits.pdf
Unveiling the Energy Potential of Marshmallow Deposits.pdfUnveiling the Energy Potential of Marshmallow Deposits.pdf
Unveiling the Energy Potential of Marshmallow Deposits.pdf
 
mô tả các thí nghiệm về đánh giá tác động dòng khí hóa sau đốt
mô tả các thí nghiệm về đánh giá tác động dòng khí hóa sau đốtmô tả các thí nghiệm về đánh giá tác động dòng khí hóa sau đốt
mô tả các thí nghiệm về đánh giá tác động dòng khí hóa sau đốt
 
Observation of Io’s Resurfacing via Plume Deposition Using Ground-based Adapt...
Observation of Io’s Resurfacing via Plume Deposition Using Ground-based Adapt...Observation of Io’s Resurfacing via Plume Deposition Using Ground-based Adapt...
Observation of Io’s Resurfacing via Plume Deposition Using Ground-based Adapt...
 
Remote Sensing and Computational, Evolutionary, Supercomputing, and Intellige...
Remote Sensing and Computational, Evolutionary, Supercomputing, and Intellige...Remote Sensing and Computational, Evolutionary, Supercomputing, and Intellige...
Remote Sensing and Computational, Evolutionary, Supercomputing, and Intellige...
 
What is greenhouse gasses and how many gasses are there to affect the Earth.
What is greenhouse gasses and how many gasses are there to affect the Earth.What is greenhouse gasses and how many gasses are there to affect the Earth.
What is greenhouse gasses and how many gasses are there to affect the Earth.
 
Richard's aventures in two entangled wonderlands
Richard's aventures in two entangled wonderlandsRichard's aventures in two entangled wonderlands
Richard's aventures in two entangled wonderlands
 
THEMATIC APPERCEPTION TEST(TAT) cognitive abilities, creativity, and critic...
THEMATIC  APPERCEPTION  TEST(TAT) cognitive abilities, creativity, and critic...THEMATIC  APPERCEPTION  TEST(TAT) cognitive abilities, creativity, and critic...
THEMATIC APPERCEPTION TEST(TAT) cognitive abilities, creativity, and critic...
 
Deep Software Variability and Frictionless Reproducibility
Deep Software Variability and Frictionless ReproducibilityDeep Software Variability and Frictionless Reproducibility
Deep Software Variability and Frictionless Reproducibility
 
Mudde & Rovira Kaltwasser. - Populism - a very short introduction [2017].pdf
Mudde & Rovira Kaltwasser. - Populism - a very short introduction [2017].pdfMudde & Rovira Kaltwasser. - Populism - a very short introduction [2017].pdf
Mudde & Rovira Kaltwasser. - Populism - a very short introduction [2017].pdf
 
Mudde & Rovira Kaltwasser. - Populism in Europe and the Americas - Threat Or...
Mudde &  Rovira Kaltwasser. - Populism in Europe and the Americas - Threat Or...Mudde &  Rovira Kaltwasser. - Populism in Europe and the Americas - Threat Or...
Mudde & Rovira Kaltwasser. - Populism in Europe and the Americas - Threat Or...
 
Eukaryotic Transcription Presentation.pptx
Eukaryotic Transcription Presentation.pptxEukaryotic Transcription Presentation.pptx
Eukaryotic Transcription Presentation.pptx
 

Statistical analysis & errors (lecture 3)

  • 2. What is statistical analysis ? The science that deals with the collection, analysis, and interpret ation of numerical data, often using probability theory.  The data themselves  In data there is always errors due to human and instrumental errors some can be corrected and avoided but some can not because they are inderminate
  • 3. Determinate Errors—They Are Systematic Determinate or systematic errors are nonrandom and occur when something is intrinsically wrong in the measurement. They can be avoided or corrected
  • 4.  Measurements errors can be divided into two components  Non random errors  Systematic errors
  • 5.  Non Random error  They have slight order.  Systematic error  repeatable error associated with faulty equipment or a flawed experiment design. These errors are usually caused by measuring instruments that are incorrectly calibrated or are used incorrectly.
  • 6.  Determinate errors (systematic errors) are those that, as the name implies, are determinable means they can be corrected or avoided.  1) Mis-calibration of apparatus. This can be removed by checking the apparatus against a standard.  (2) Faulty observation. This is avoidable, and therefore should not be cited as a source of error in any well-performed experiment.
  • 7.  The error can be proportional to sample size or may change in a more complex manner  Variation are usually unidirectional  As in the case of solubility loss of precipitate due to its solubility . Such an example is the change in solution volume and concentration occurring with changes in temperature. This can be corrected for by measuring the solution temperature. Such measurable determinate errors are classed as systematic errors.
  • 8. Inderminate errors or random errors  Inderminate errors are always random errors and can not be avoided  Random errors ( inderminate) It is caused by inherently unpredictable fluctuations in the readings of a measurement apparatus or in the experimenter's interpretation of the instrumental reading.
  • 9.  Random errors are often called as accidental error.  Random errors are indeterminate which means they can not be determined/ calculated. But, we can make a certain conclusion about these random errors by applying mathematical more precisely statistical rules.
  • 10. Gaussian curve Statistical rule which is applied to make a conclusion about random errors is normal distribution curve often called as Gaussian distribution curve. Y axis (pdf) Probabality Denstiy Function x –axis (variables) standard deviation from the mean
  • 11. Significant figures  Definition  the number of digits necessary to express the results of a measurement consistent with the measured precision.  Since there is uncertainty in any measurement of atleast +_ 1 in the last significant figures.  Rules  Non-zero digits are always significant.  Any zeros between two significant digits are significant.  Zeros on the left side are always non-significant while zeros on right side always significant.
  • 12. For example  0.216 Three significant figures  90.7 Three significant figures  800.0 Four significant figures  0.0670 Three significant figures
  • 13. Rounding off data  Definition.  Rounding off is a kind of estimating. To round off decimals: Find the place value you want (the "rounding digit") and look at the digit just to the right of it. If that digit is less than 5, do not change the rounding digit but drop all digits to the right of it. For example  4.7892 rounding of data into two decimal = 4.8
  • 14. Mean, Median, Mode Mean. The sum of a group of measurements divided by the number of measurements; the average. Mode. The most frequently occurring value in the group of measurement. 2, 3, 4, 2, 5, 2, 7, 5, 2 so 2 is mode in it Median. In a even data set, the median is the average of two middle numbers. 2, 4, 6,8,10 then 6 is median here
  • 15. What is standard deviation  For a series of ‘n’ measurement of the same measurand, the quantity S characterizing dispersion of results   X= measutrements  X = mean  N= numbers
  • 16. Tests  F-test:  is used to determinate when two variances are satisfactorily different from each other . F= S / S2 T-test Is used to determinate when two sets are satisfactorily different. Q-test Is used to determine when outlier is due to determinate error. If it is not , then falls within expected random error and should be retained.
  • 17. QC/QA  A good laboratory practice (GLP) means who is defining for and what purpose. A good laboratory should have  Management  Personnel  Facilities  Equipment  Operation  Method validation  Quality assurance
  • 18.  Good laboratory practices have been established by worldwide bodies such as the Organization for Economic Cooperation and Development (OECD) and the International Organization for Standardization (ISO). Government agencies have adopted them for their purposes as rules that must be followed for laboratories involved in analyzing substances that require regulation. Examples are pharmaceutical formulations, foods, and environmentally important samples.
  • 19. GLPs  GLPs ( good laboratory practice) a body of rules, operating procedures, and practices established by a given organization that are considered to be mandatory with a view to ensuring quality and correctness in the results produced by a laboratory.  GLP ensures correct results are reported.
  • 20.  The laboratory should have two things  1. SOPs ( standard operating procedures)  2. QAU (quality assurance unit)
  • 21. SOPs  Standard operating procedures provide detailed descriptions of activities performed by the laboratory.  1) sample custody chain  2)sample handling and preparation  3) the analytical method  4) instrument maintenance  5) record keeping
  • 22. QAU (quality assurance unit)  The QAU is responsible for assuring good laboratory practices are implemented. Everyone in the lab is responsible for following them.
  • 23. Validation of analytical methods  Validation process  1) selectivity  2) Linearity  3) accuracy  4) Precision  5) Sensitivity
  • 24.  6) Range 7) Limit of detection (LOD)  8) Limit of quantitation  9) Ruggedness or robustness
  • 25. Selectivity  Selectivity is basically the extent that the method can measure the analyte of interest in the matrices of sample being analyzed without interference from the matrix. Matrix effect may be either positive or negative Matrix  Matrix is everything in a sample except the actual analyte
  • 29. The sensitivity is determined by slope of the calibration curve and generally reflects the ability to distinguish two different concentrations You can measure slope or measure sample of closely related conc. At high, intermediate, and low concentrations
  • 30.
  • 31. Range  Range is actually an interval between upper and lower concentrations of analyte in sample