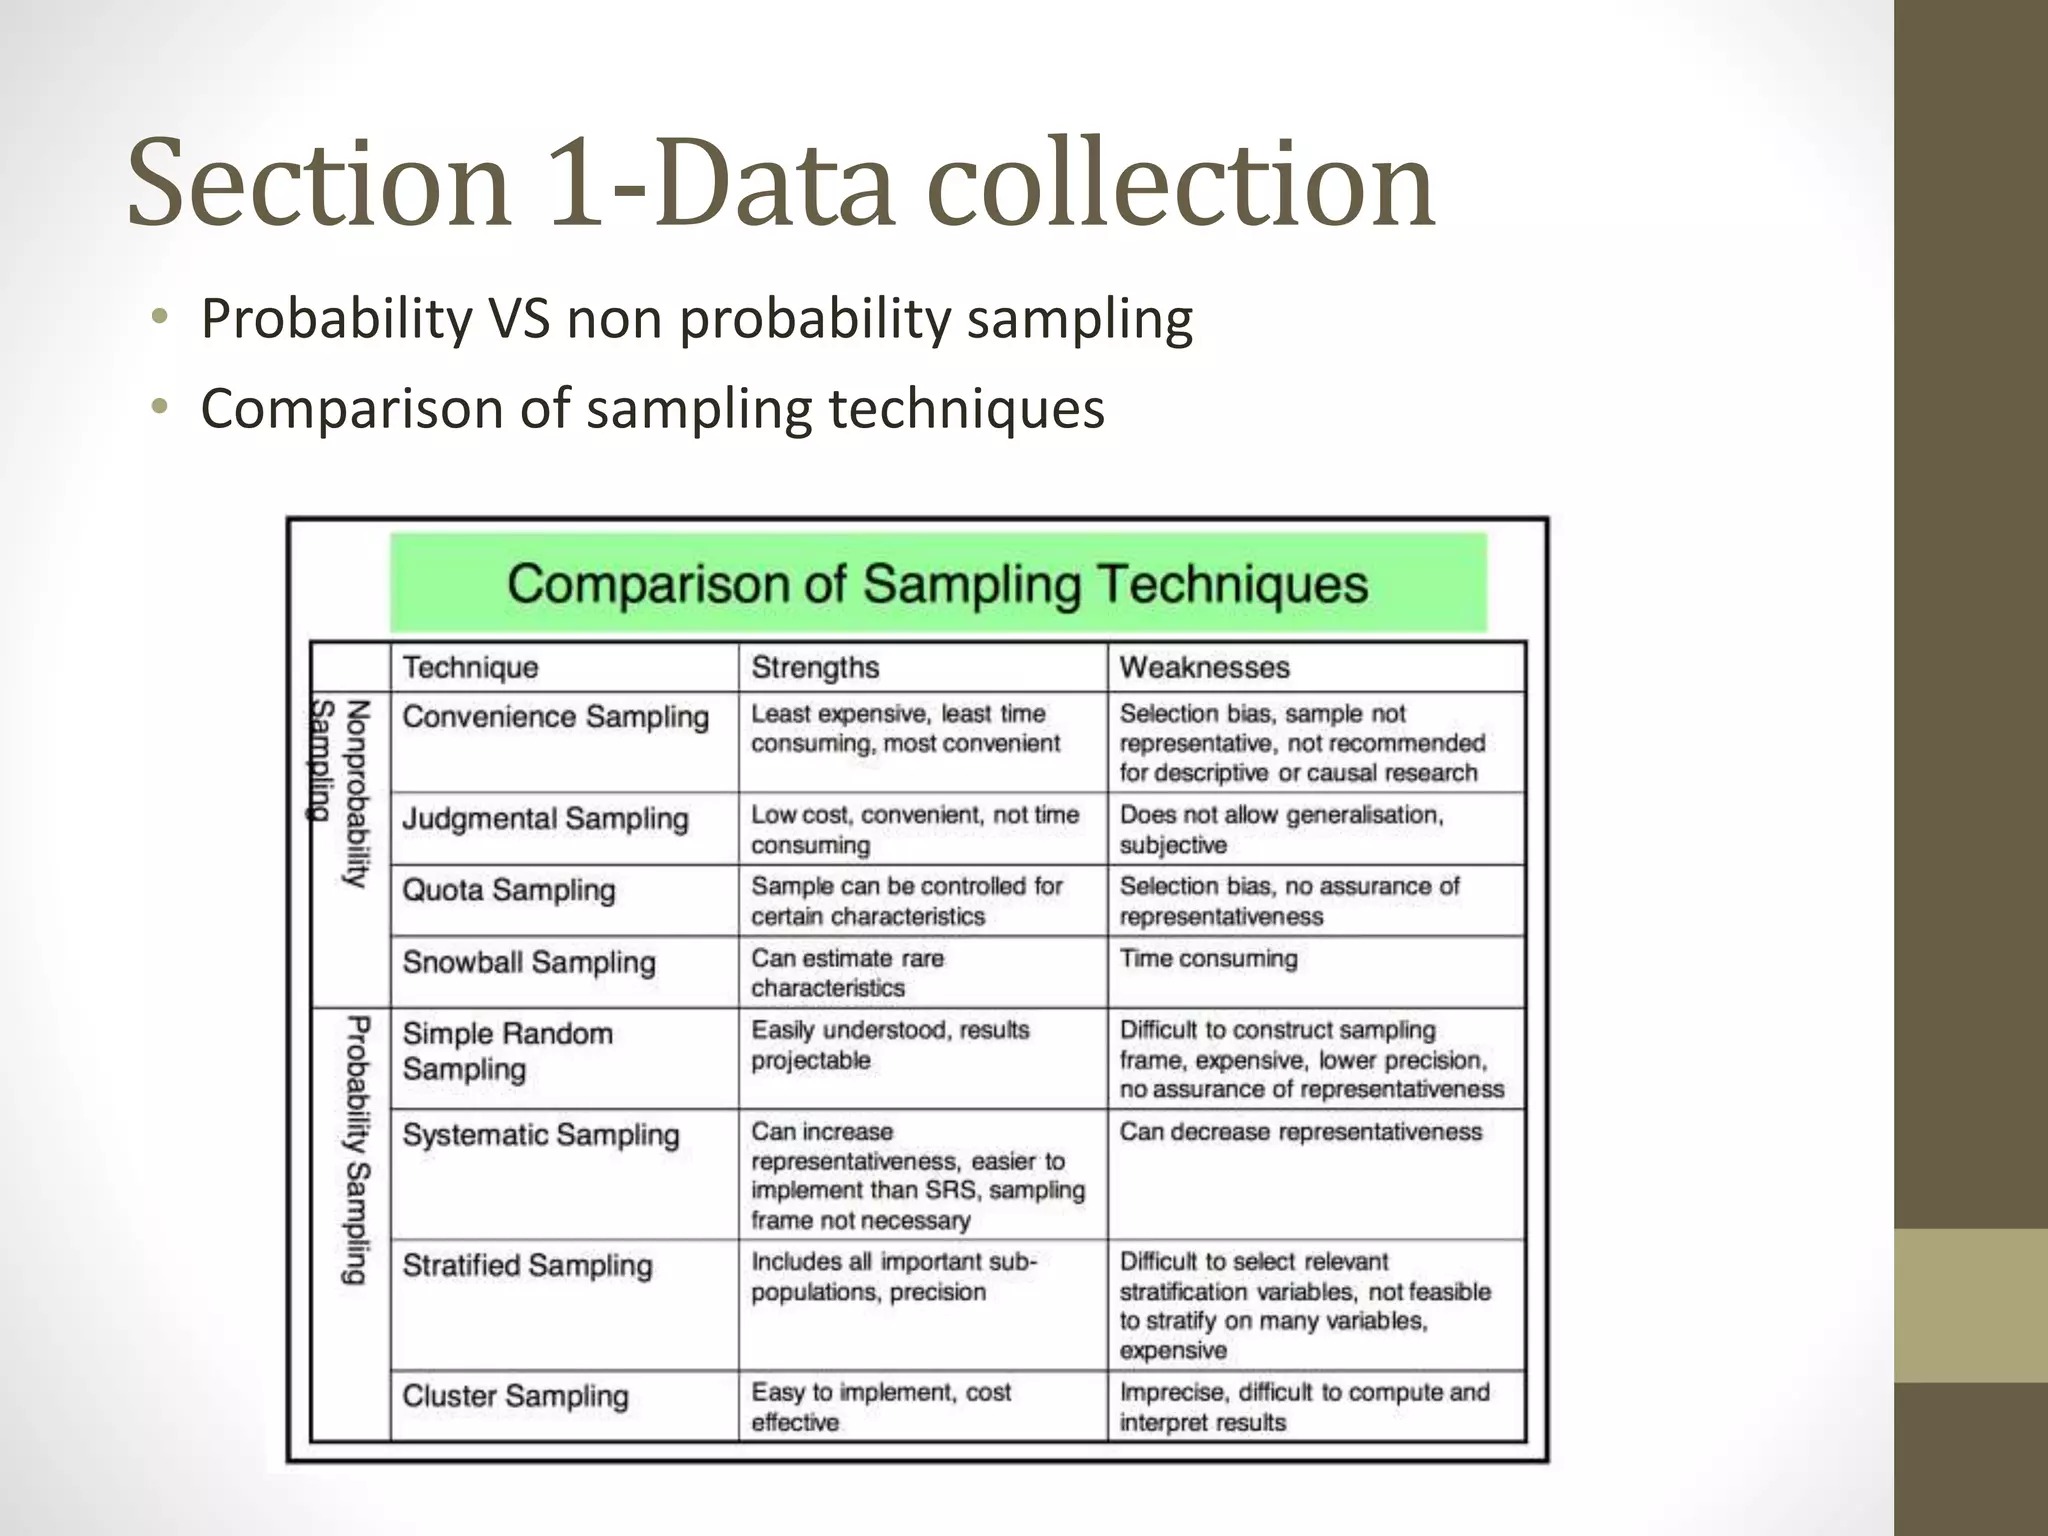
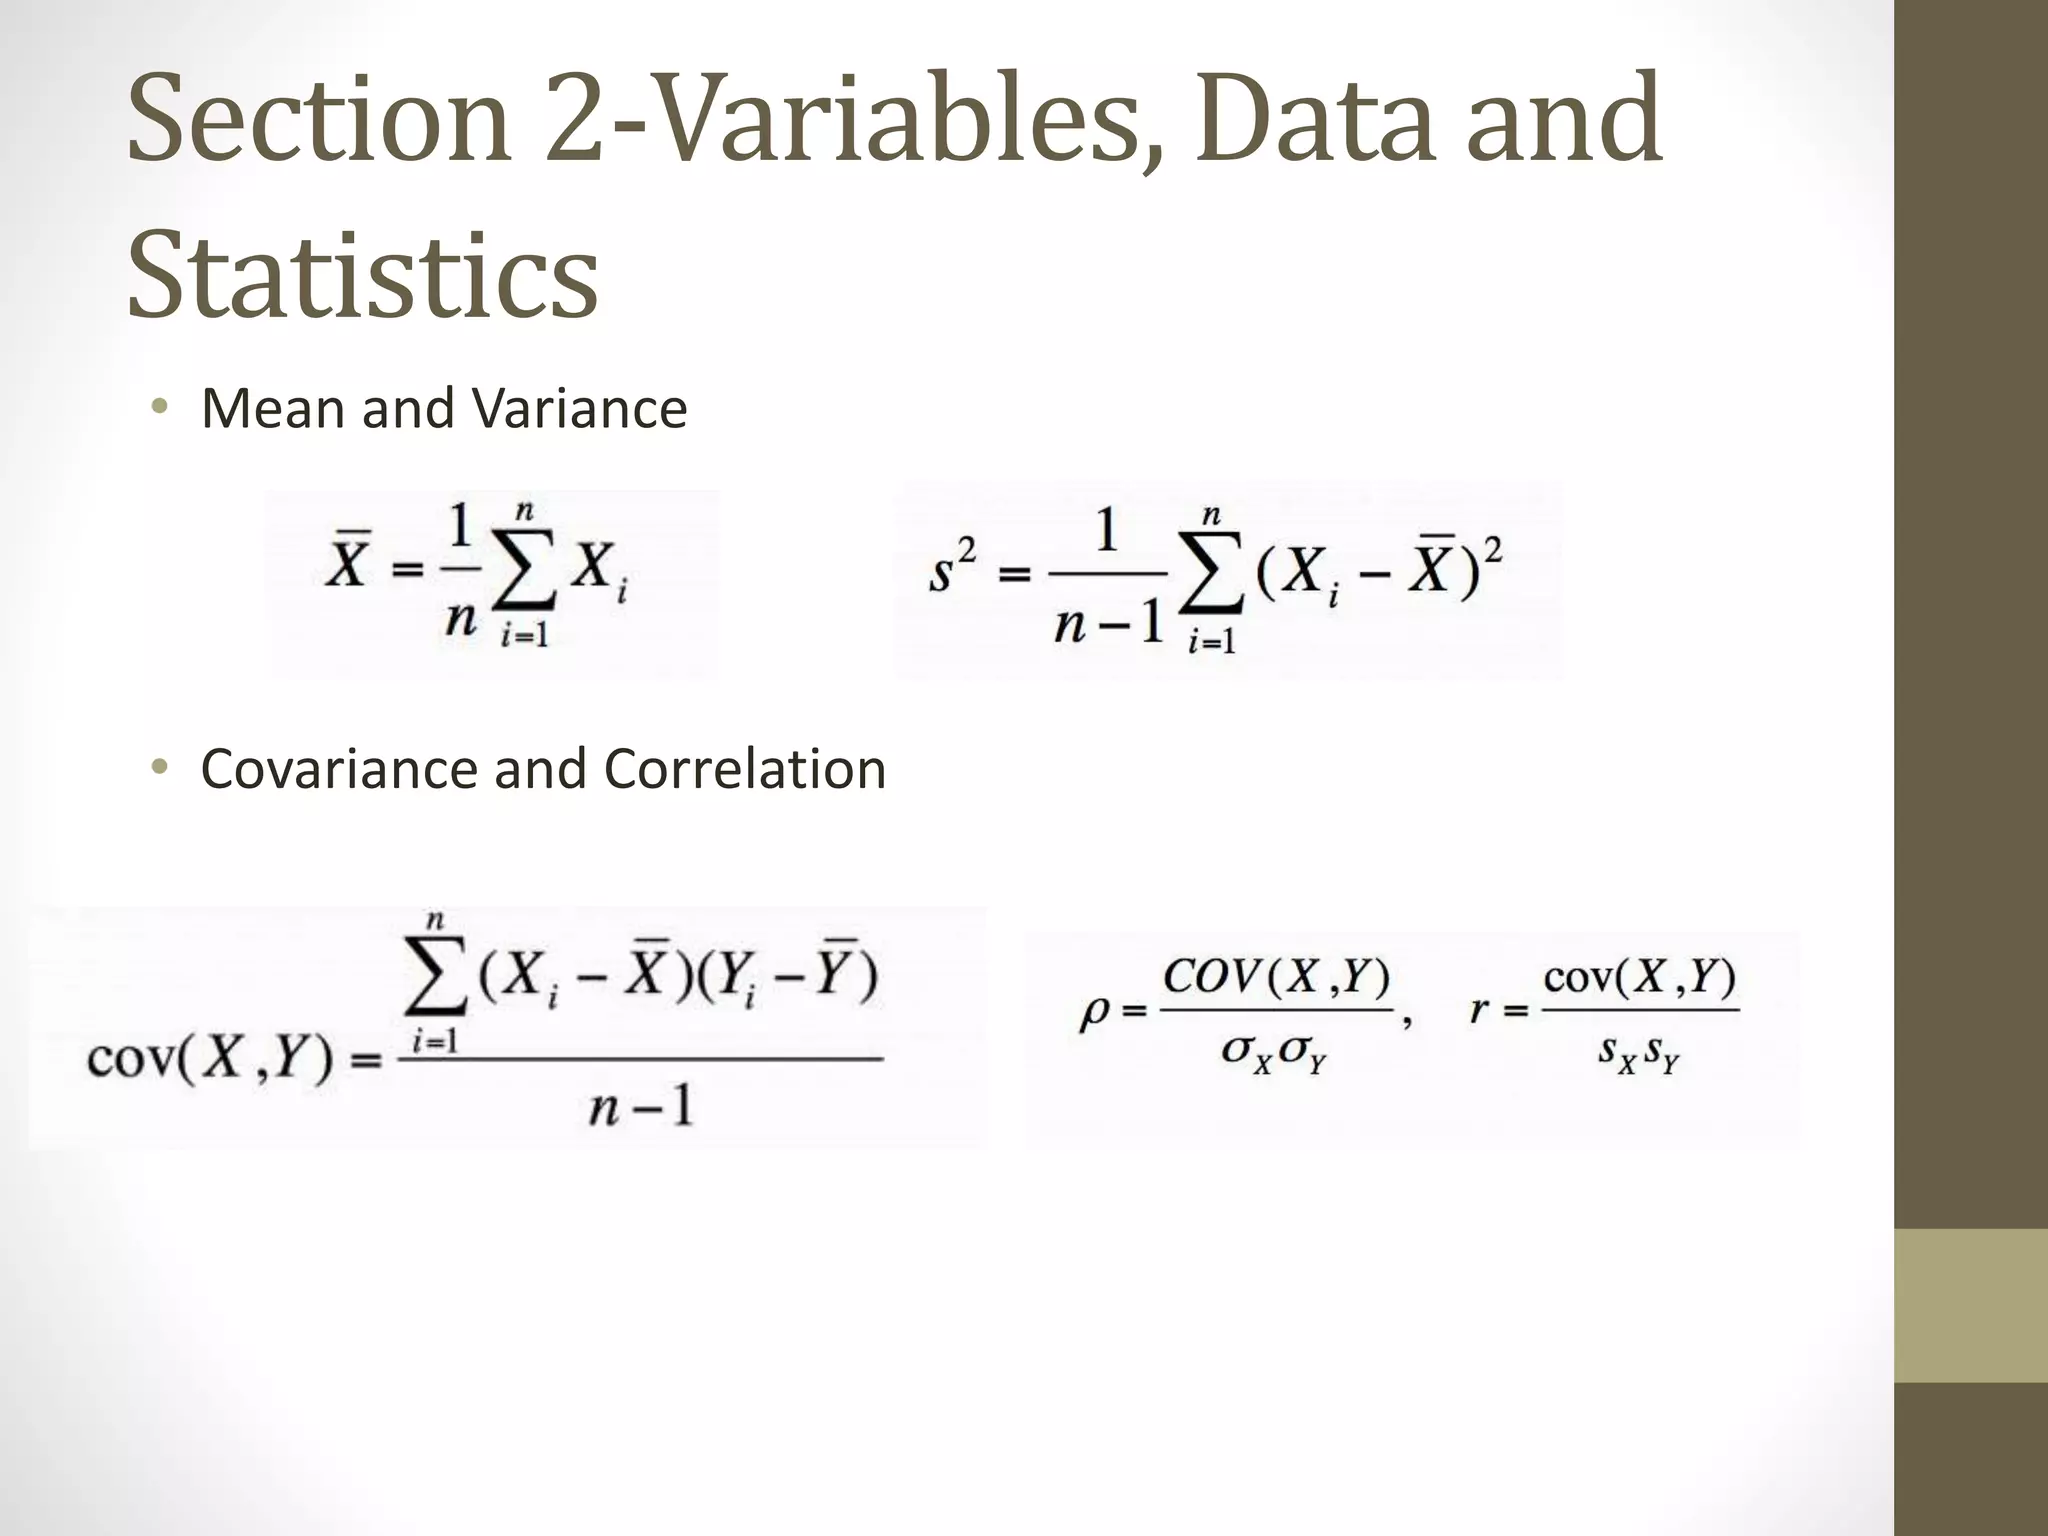
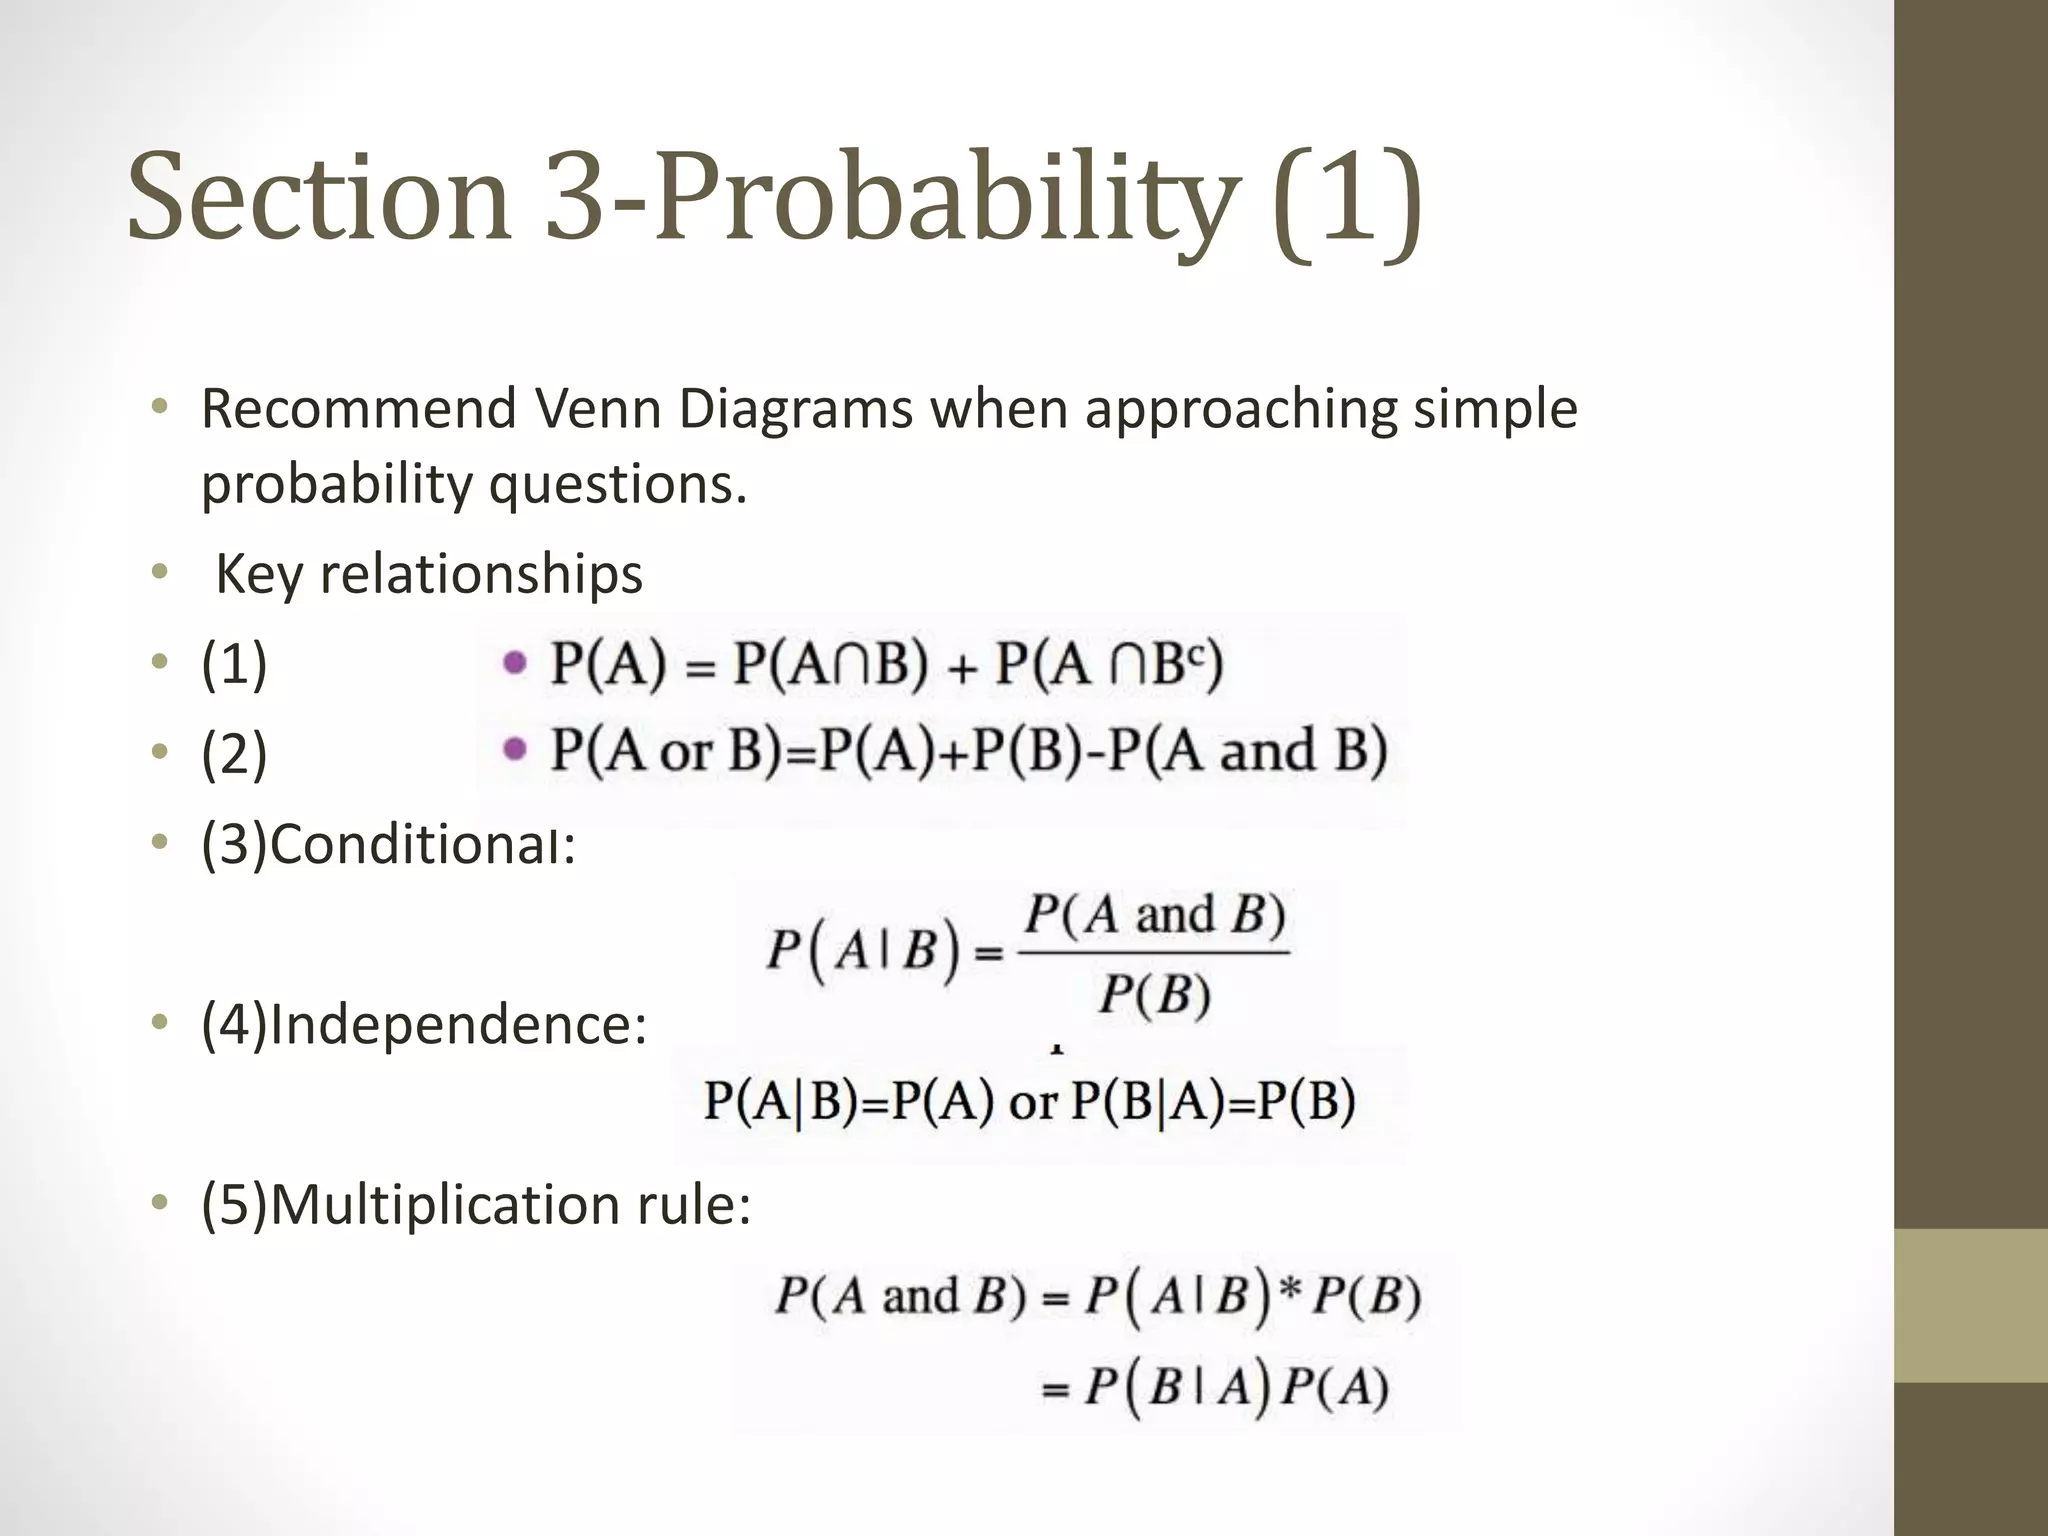
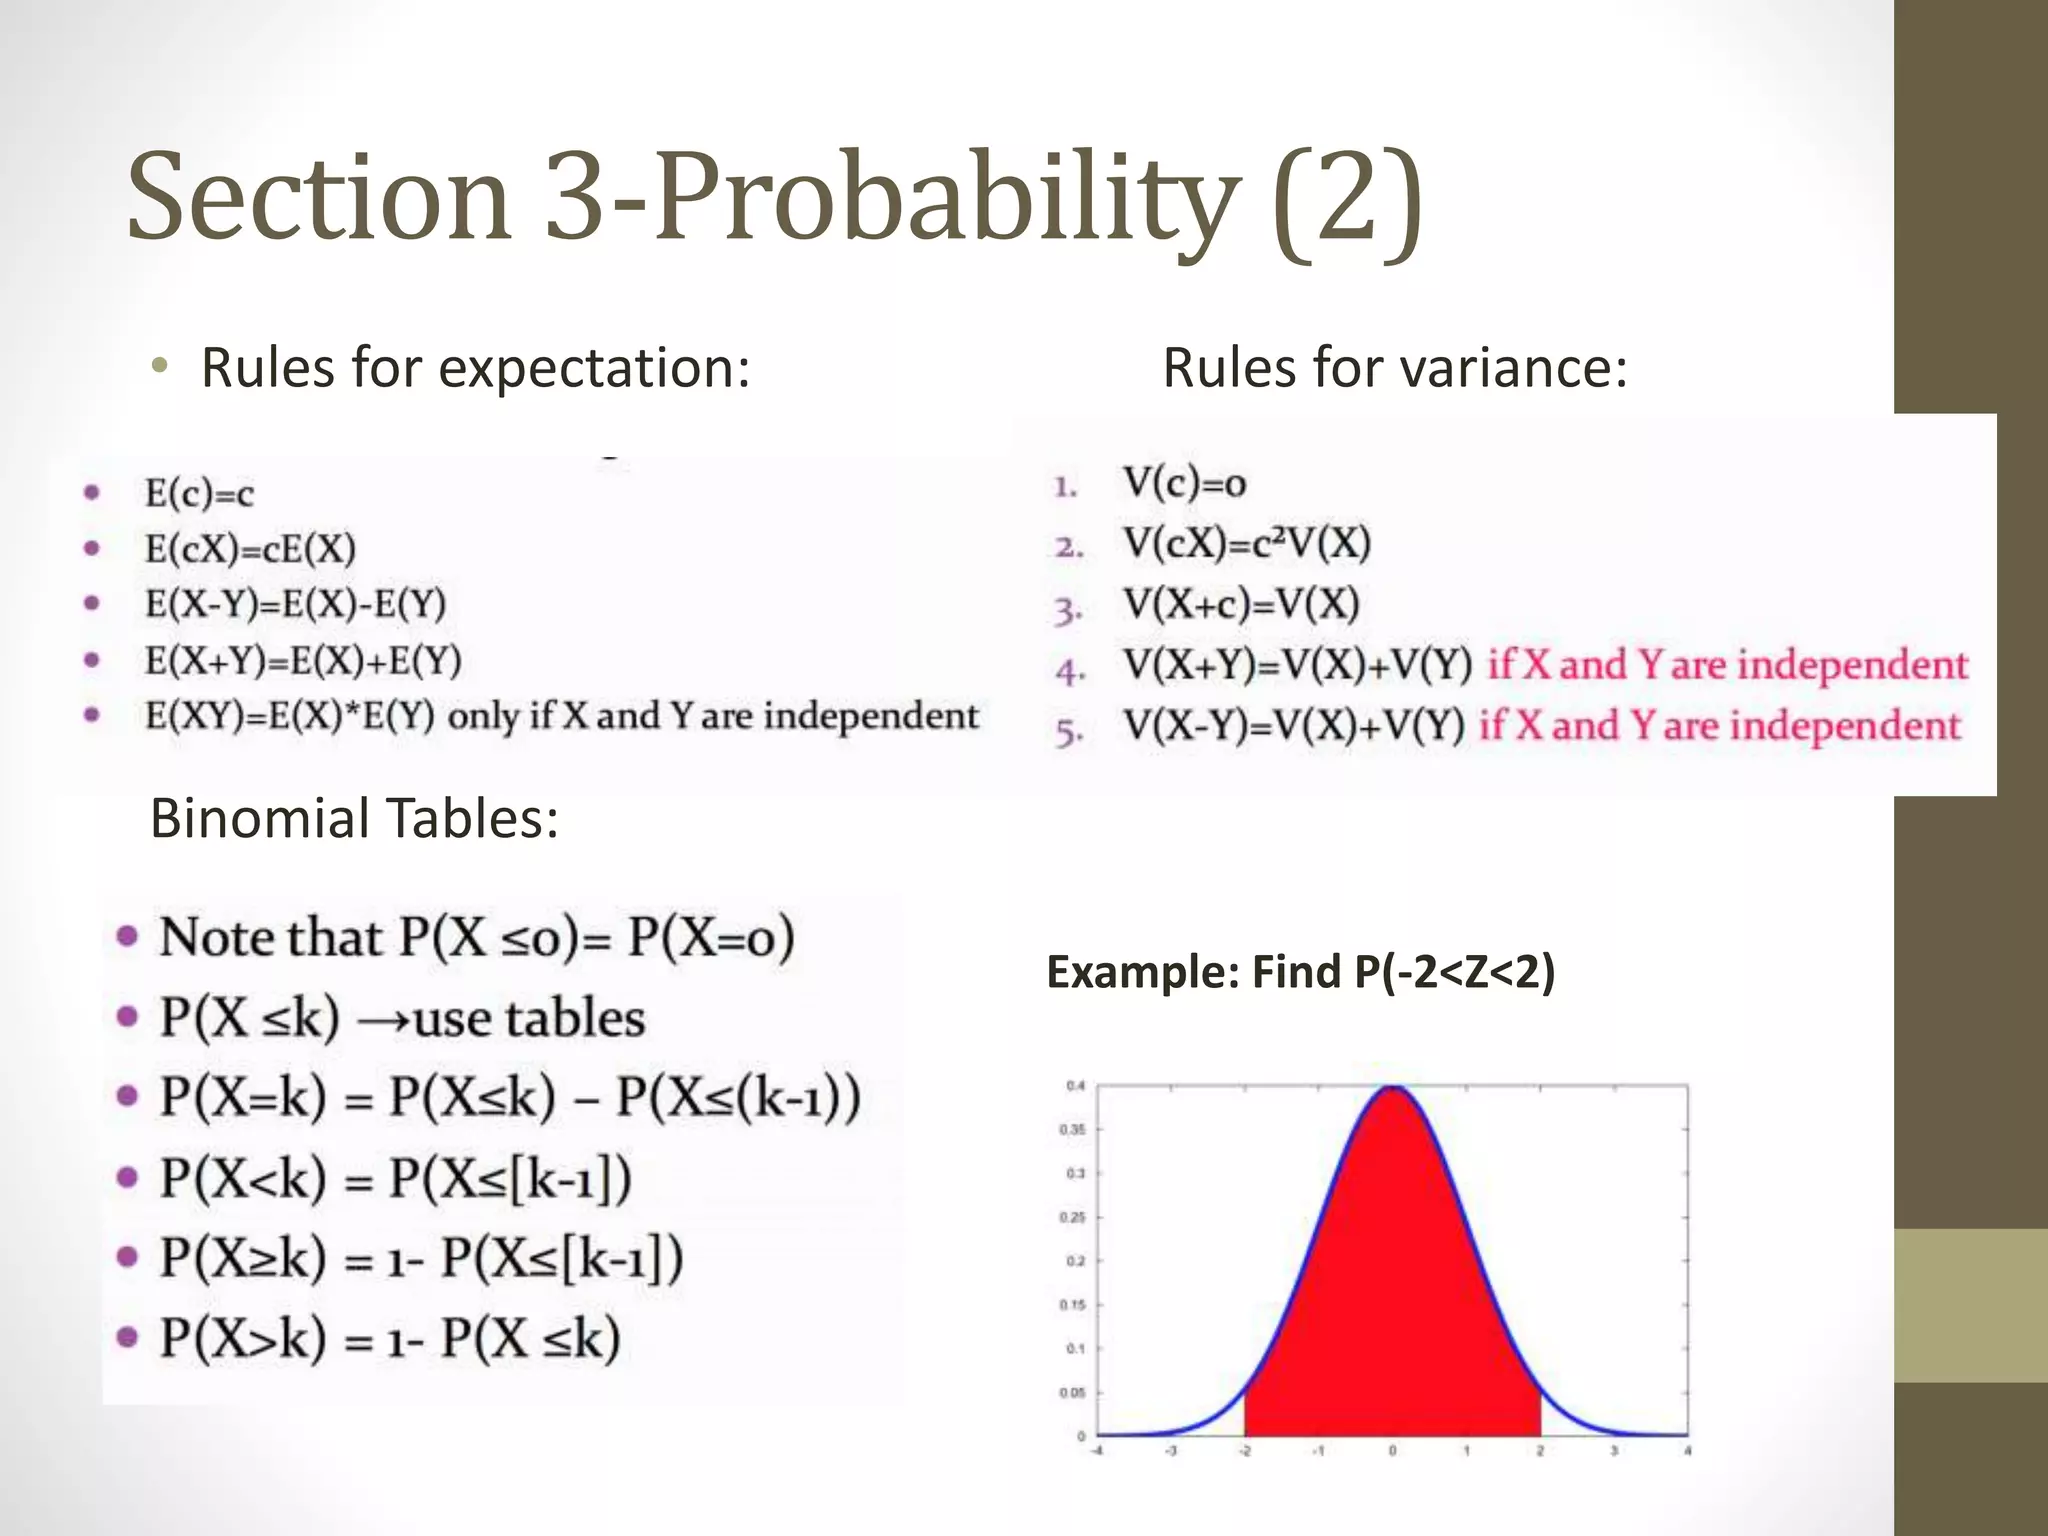
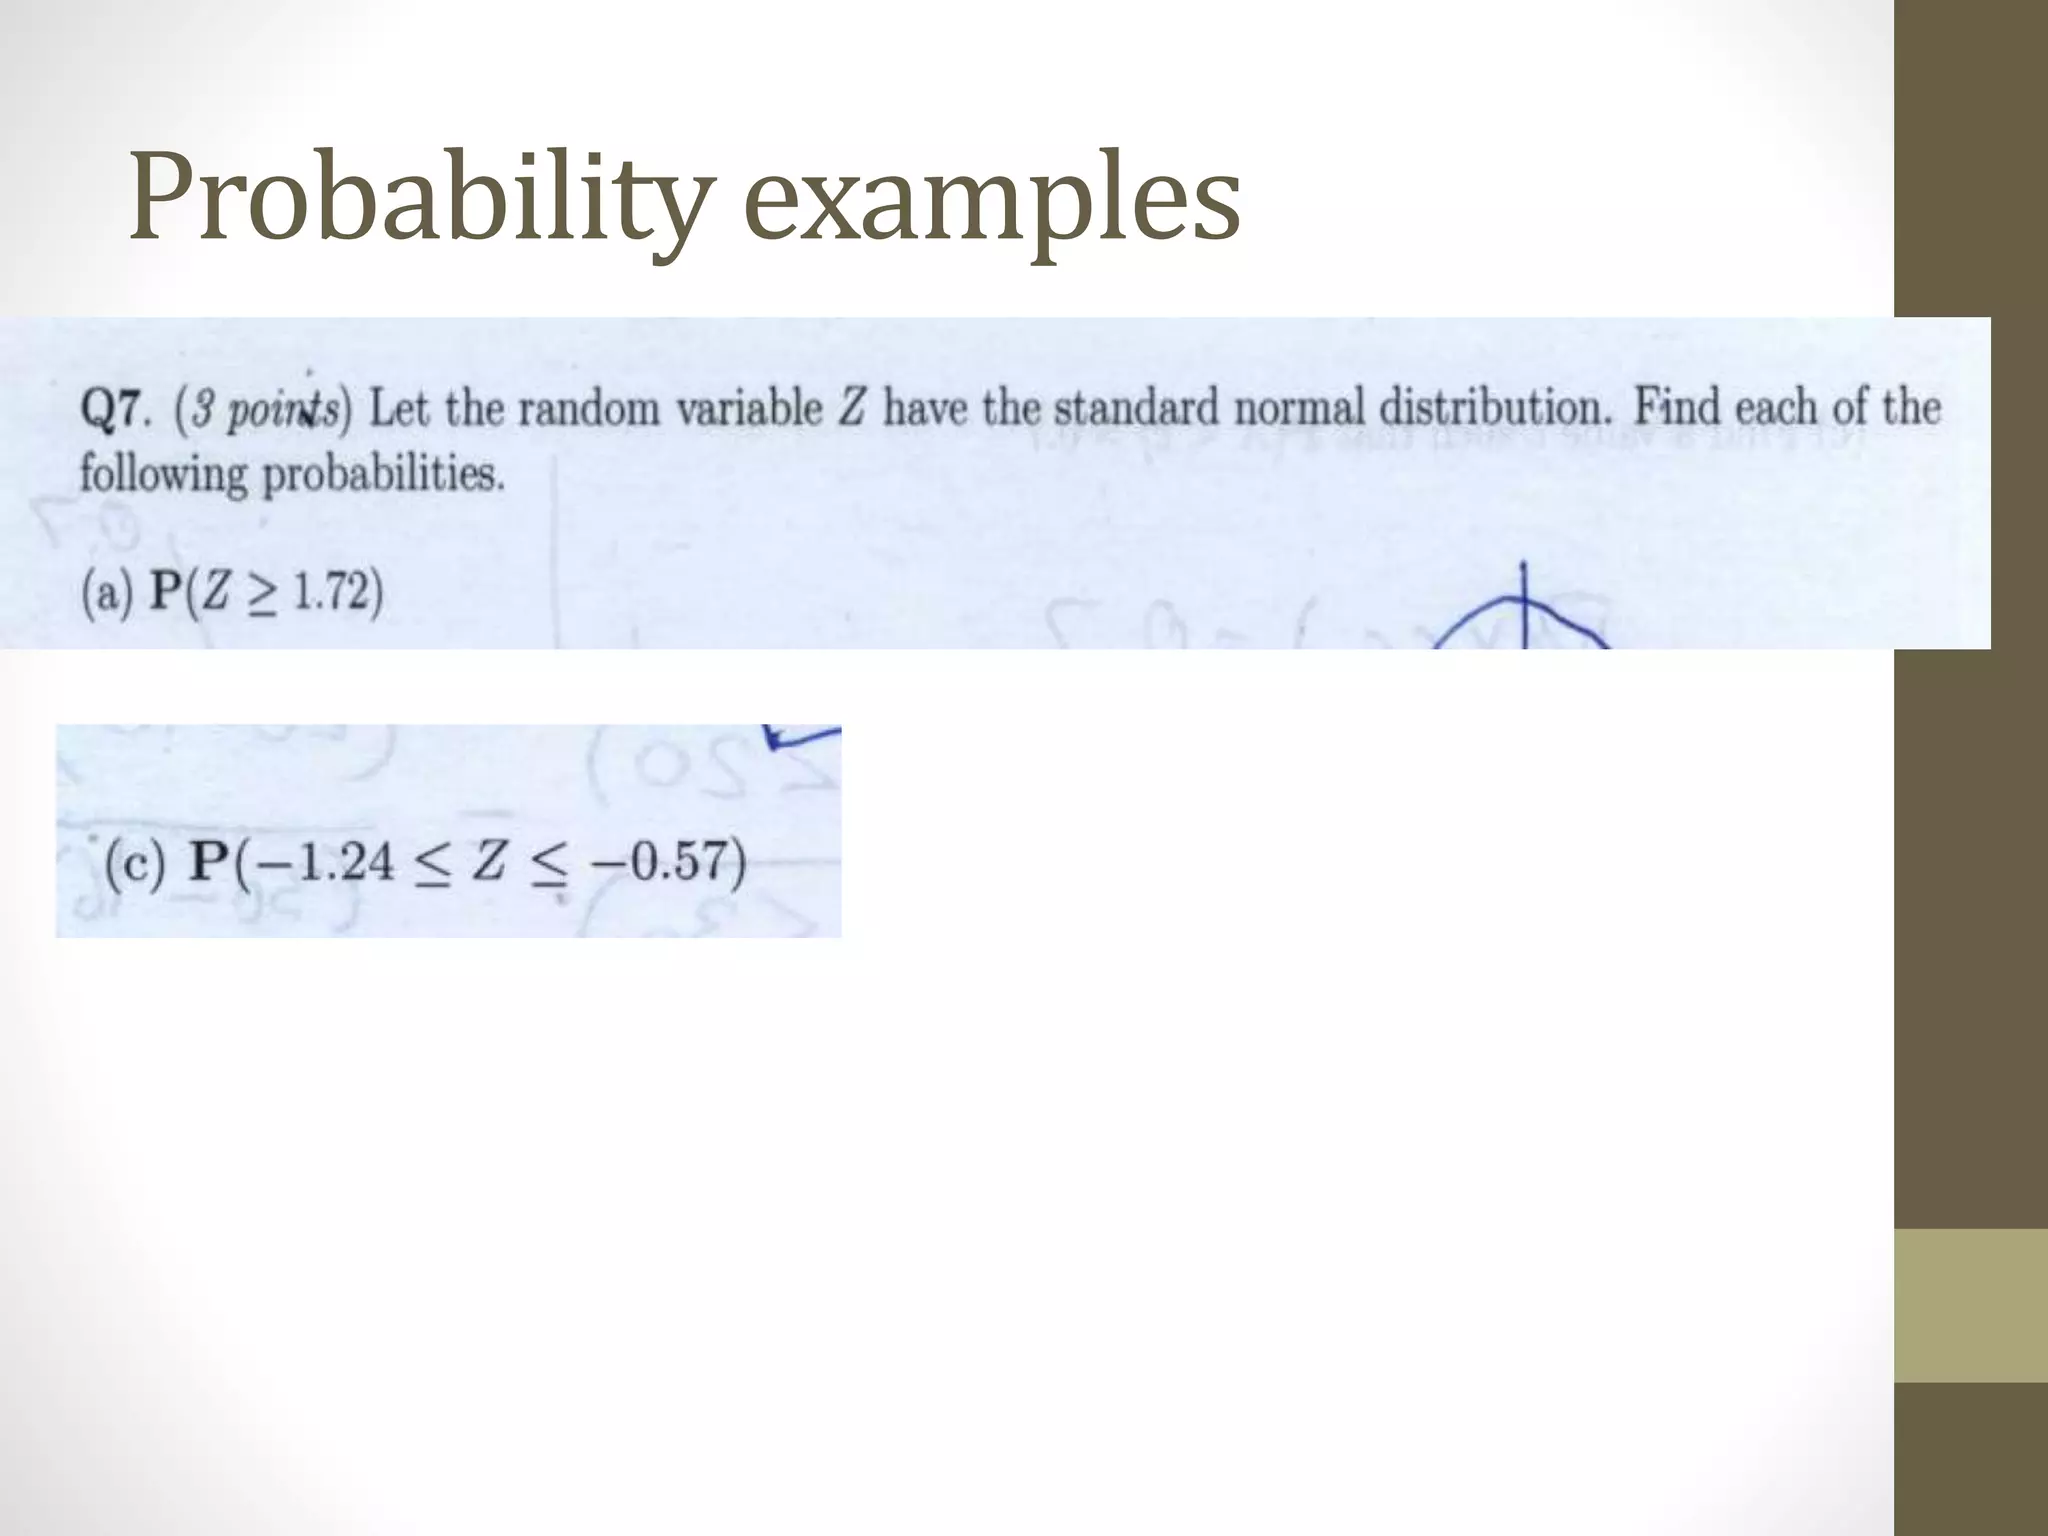
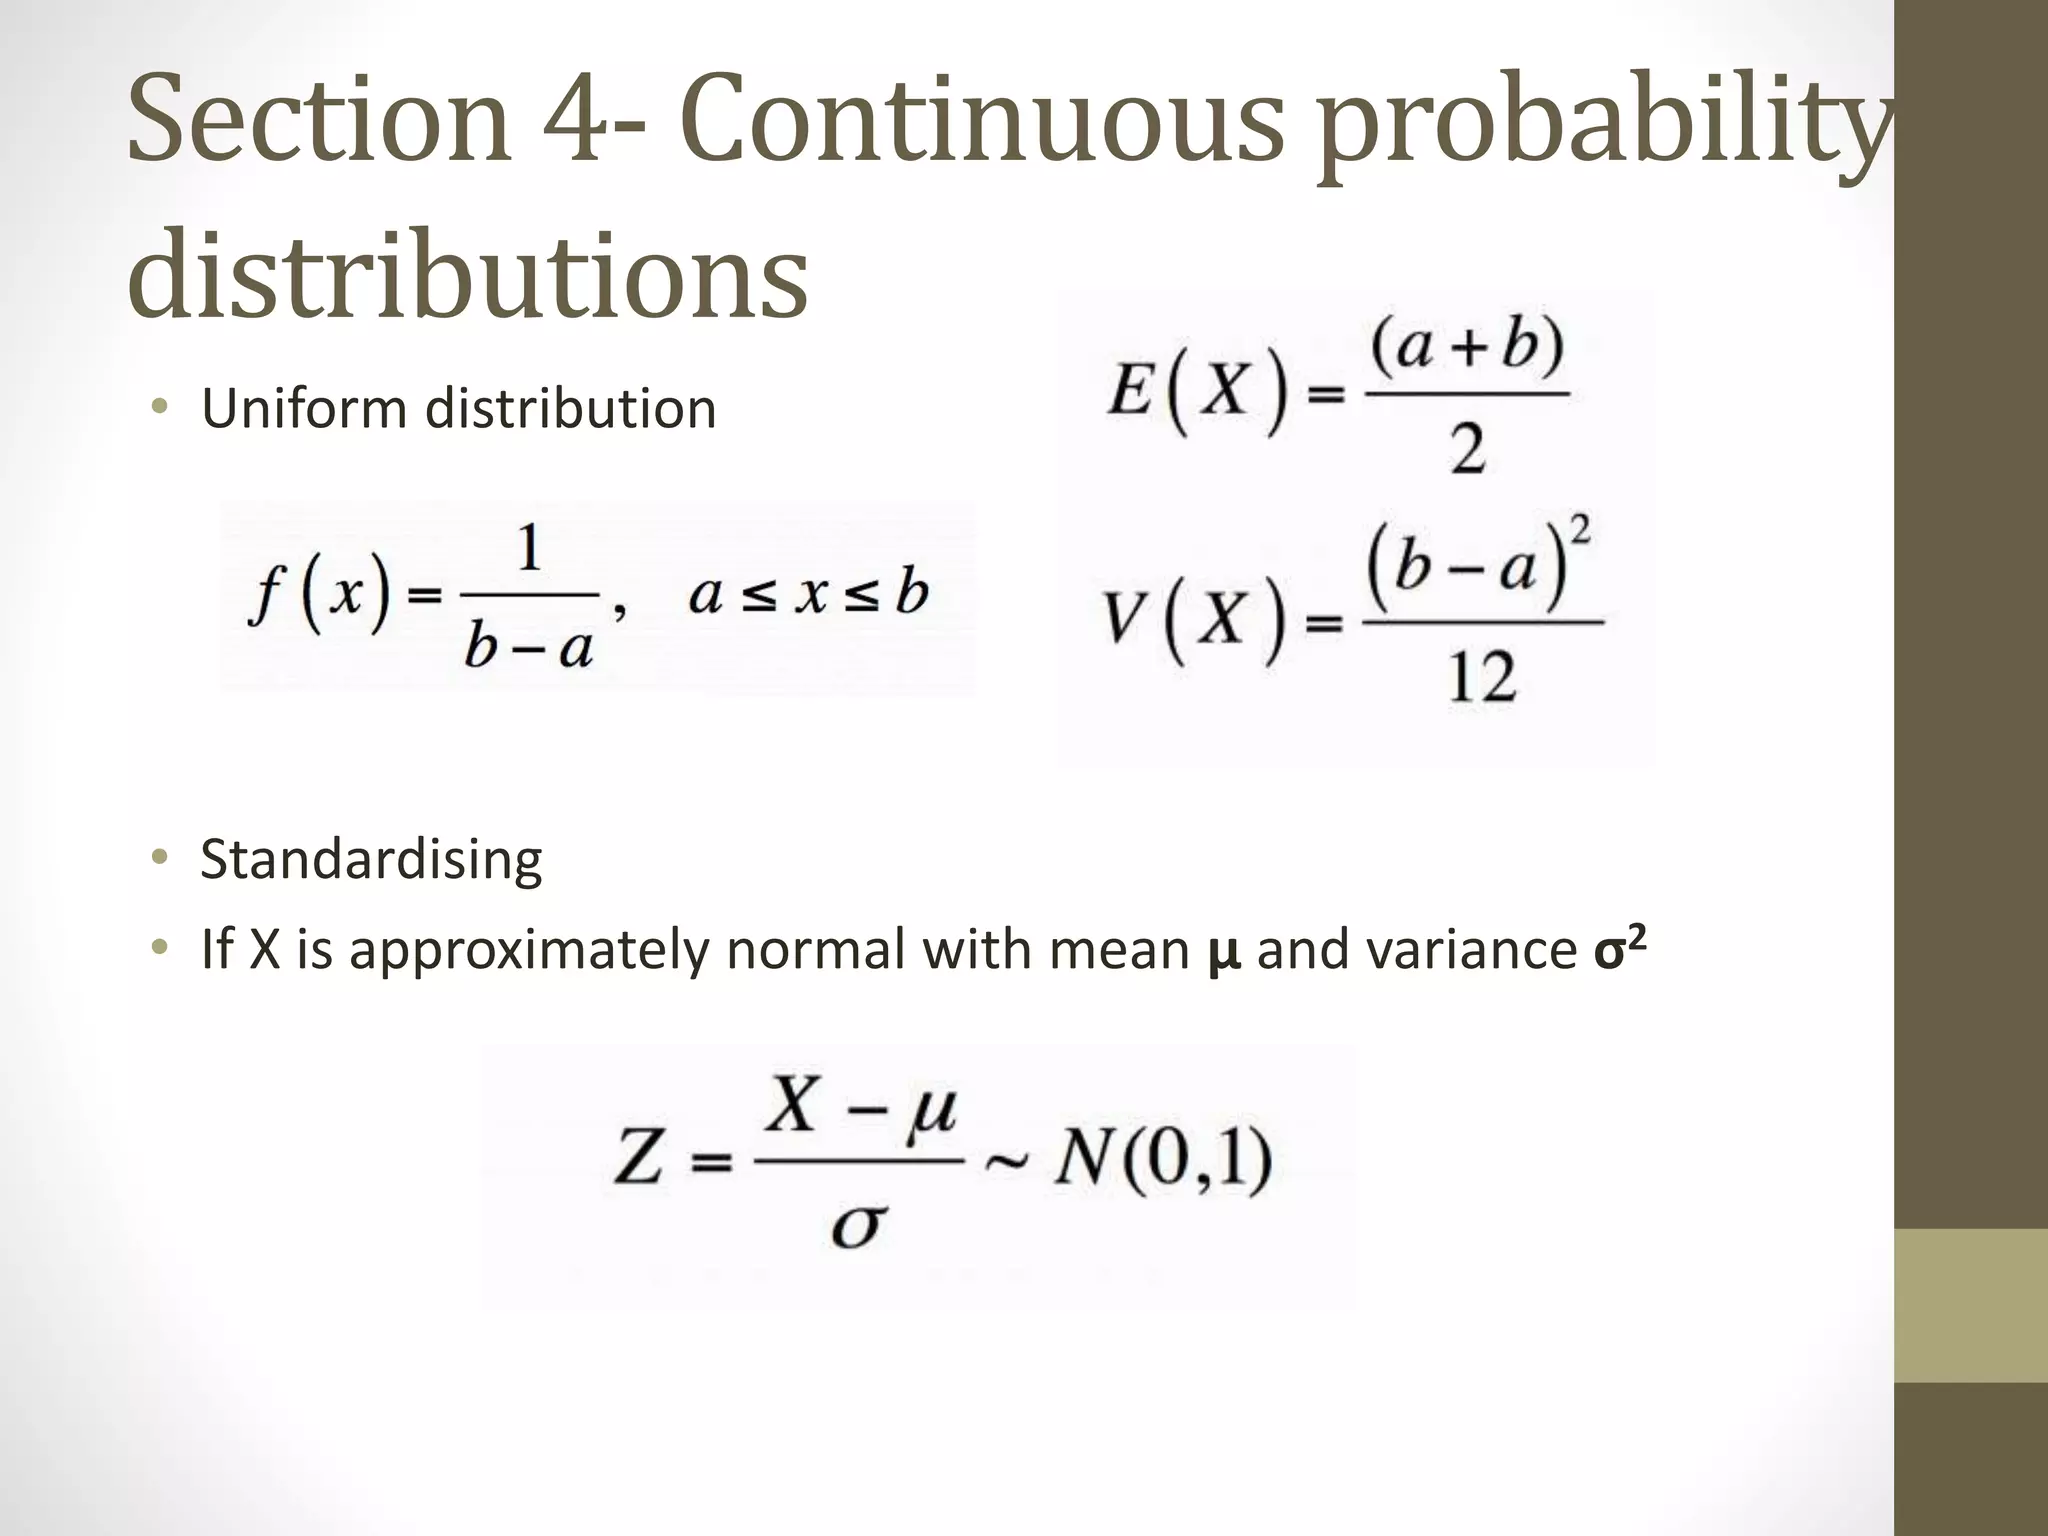
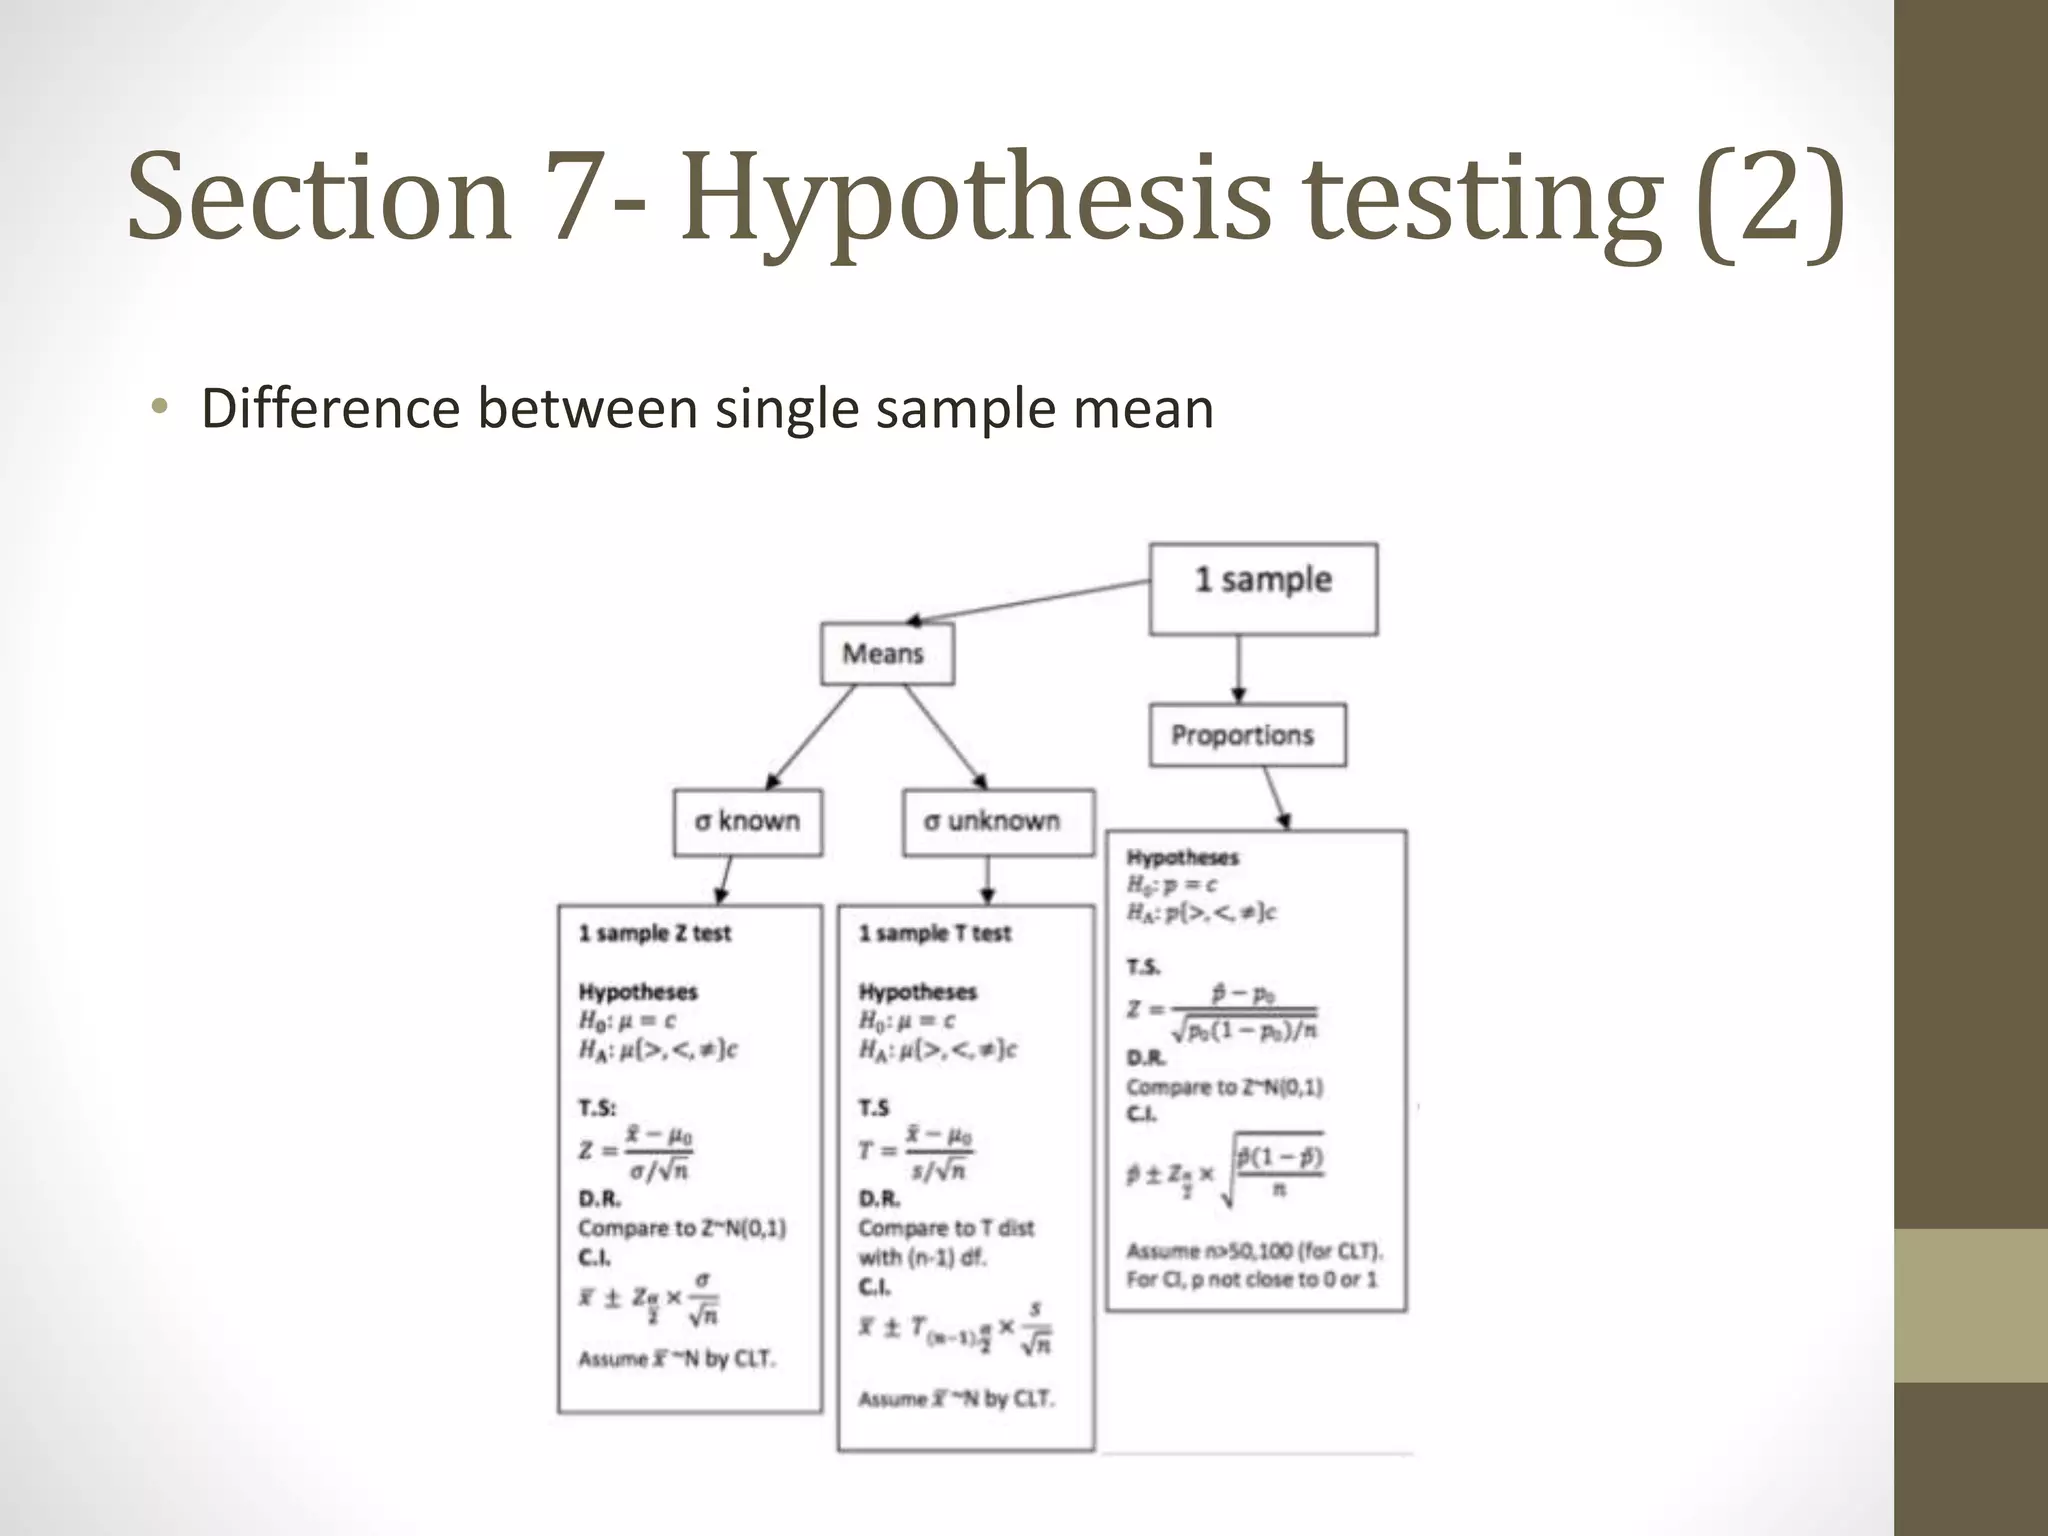
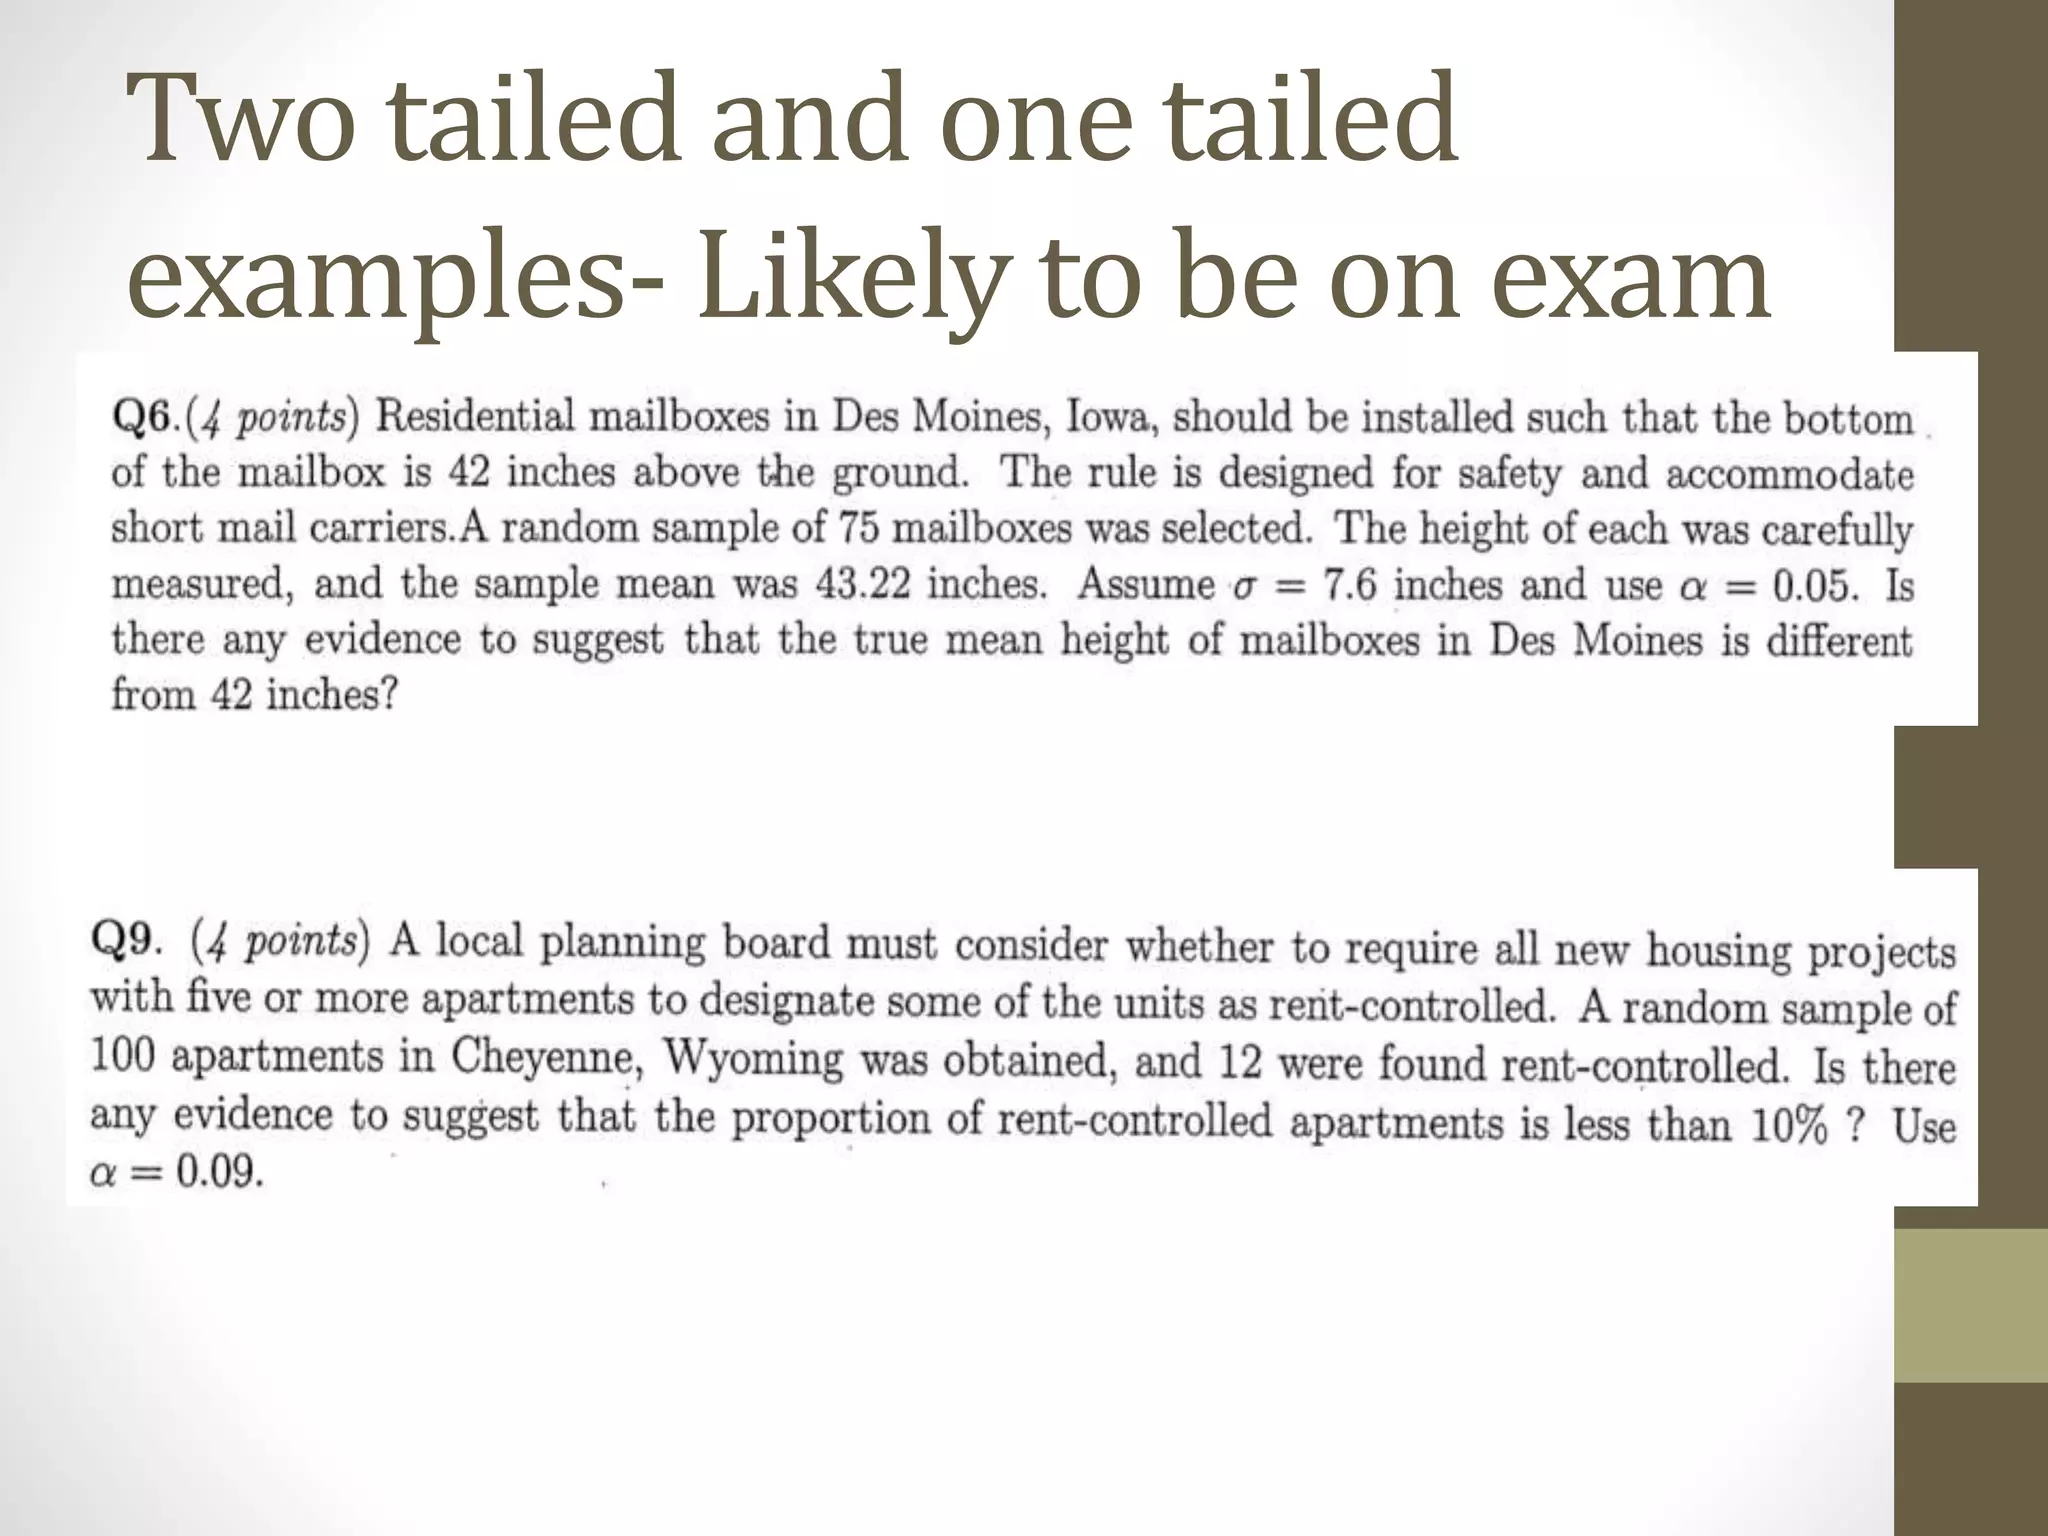
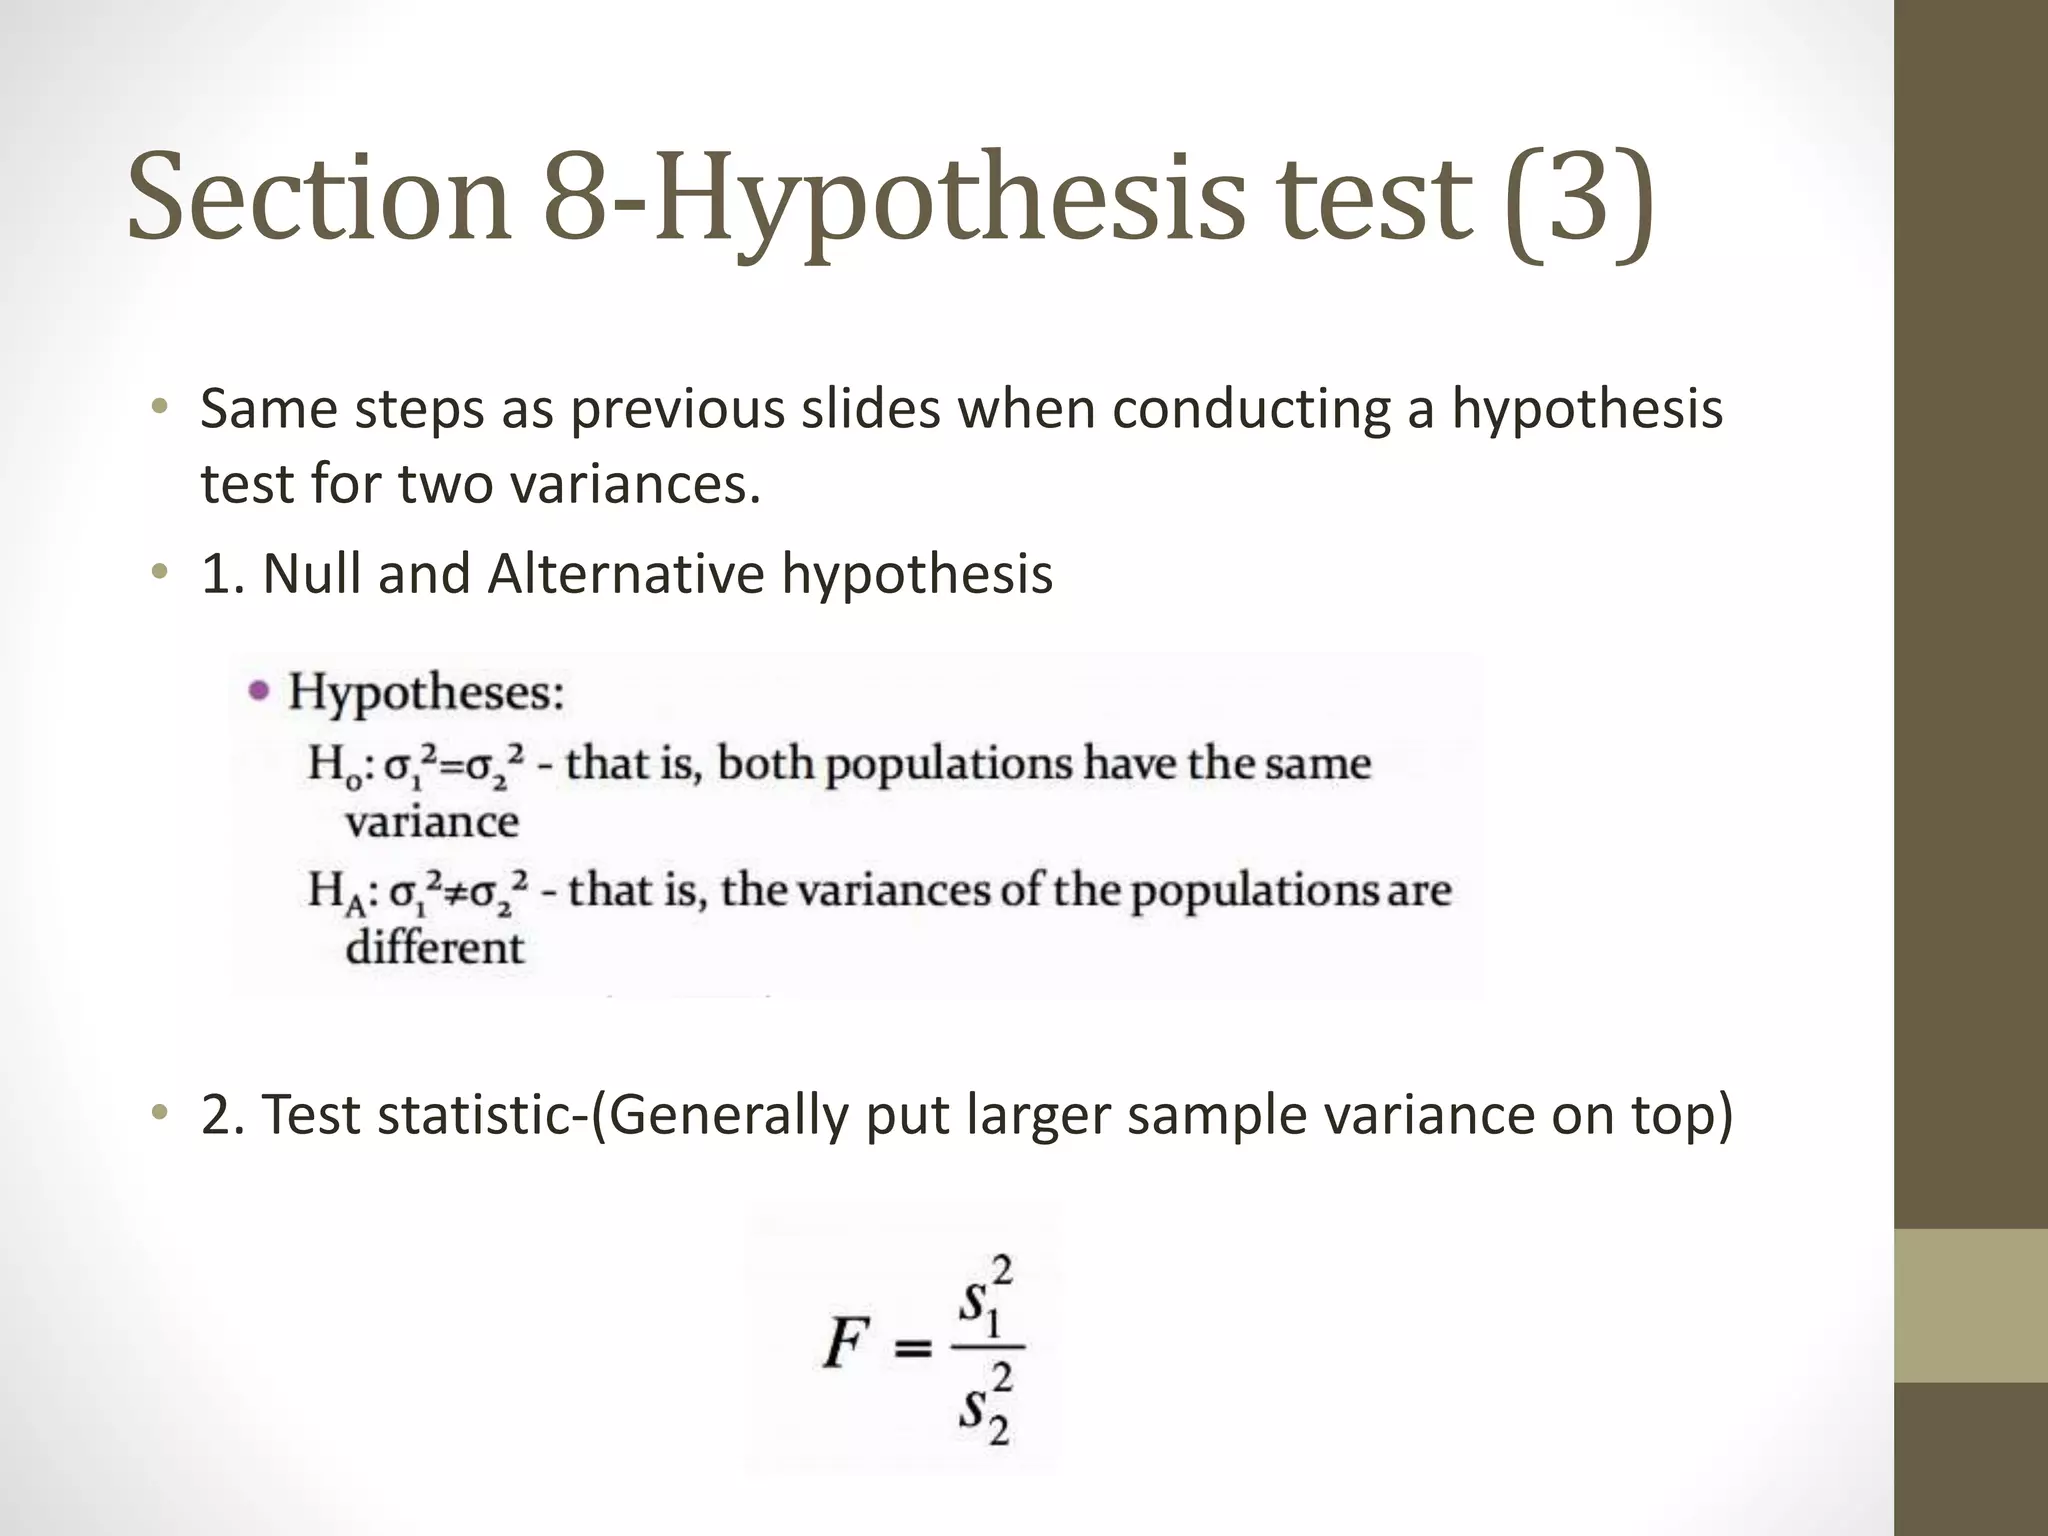
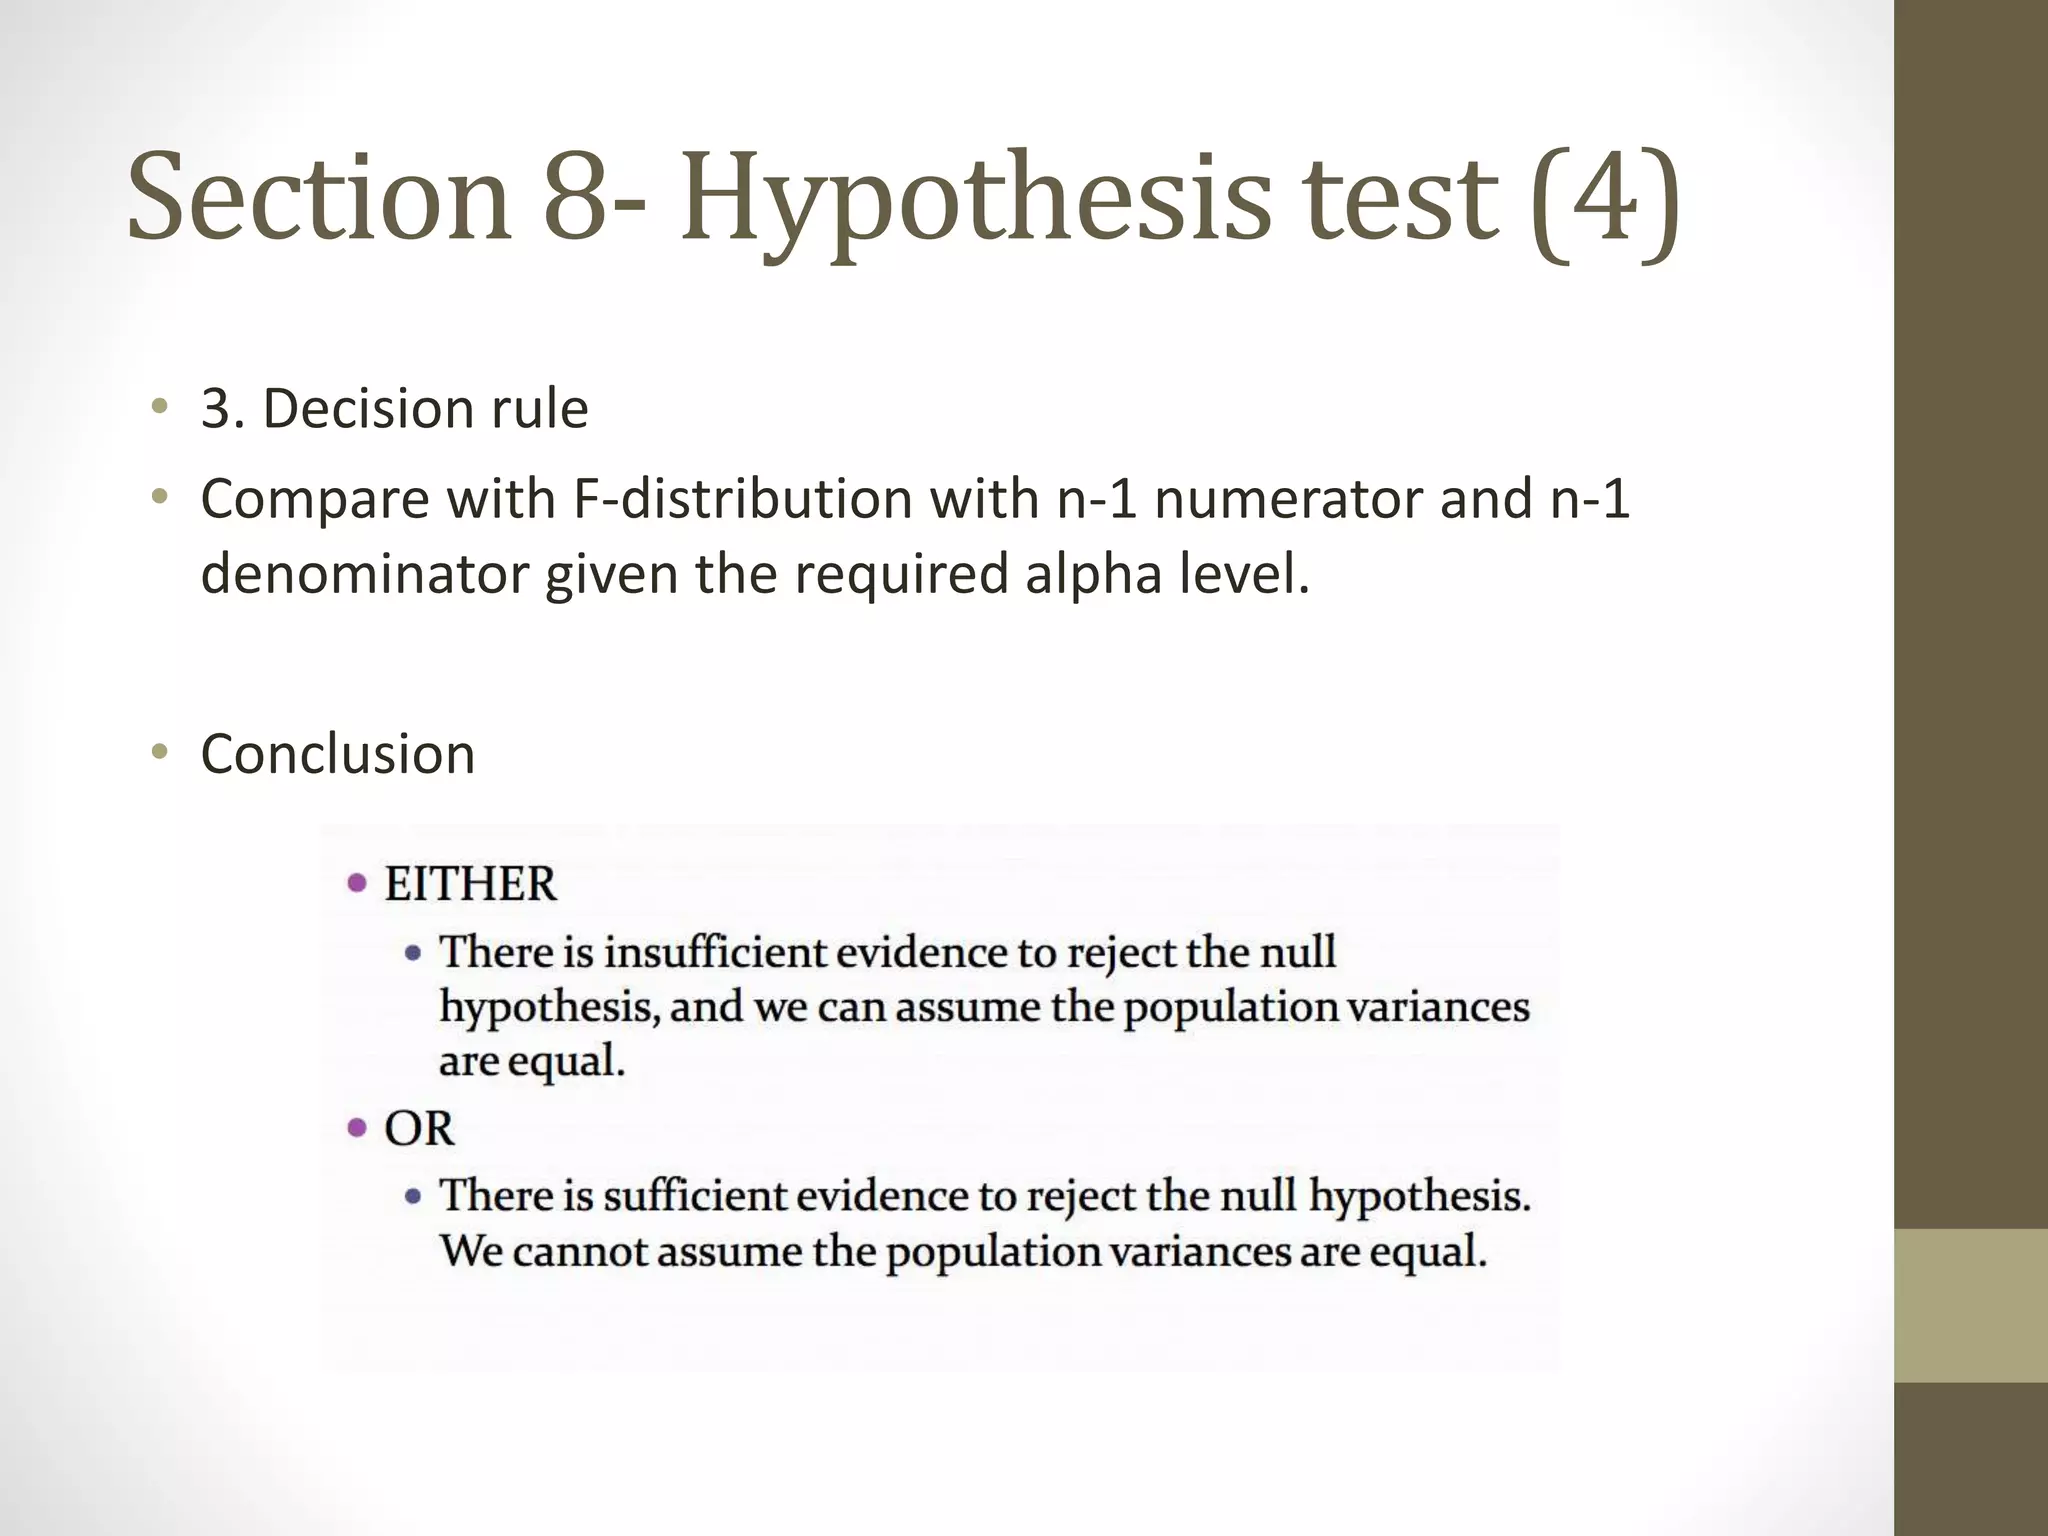
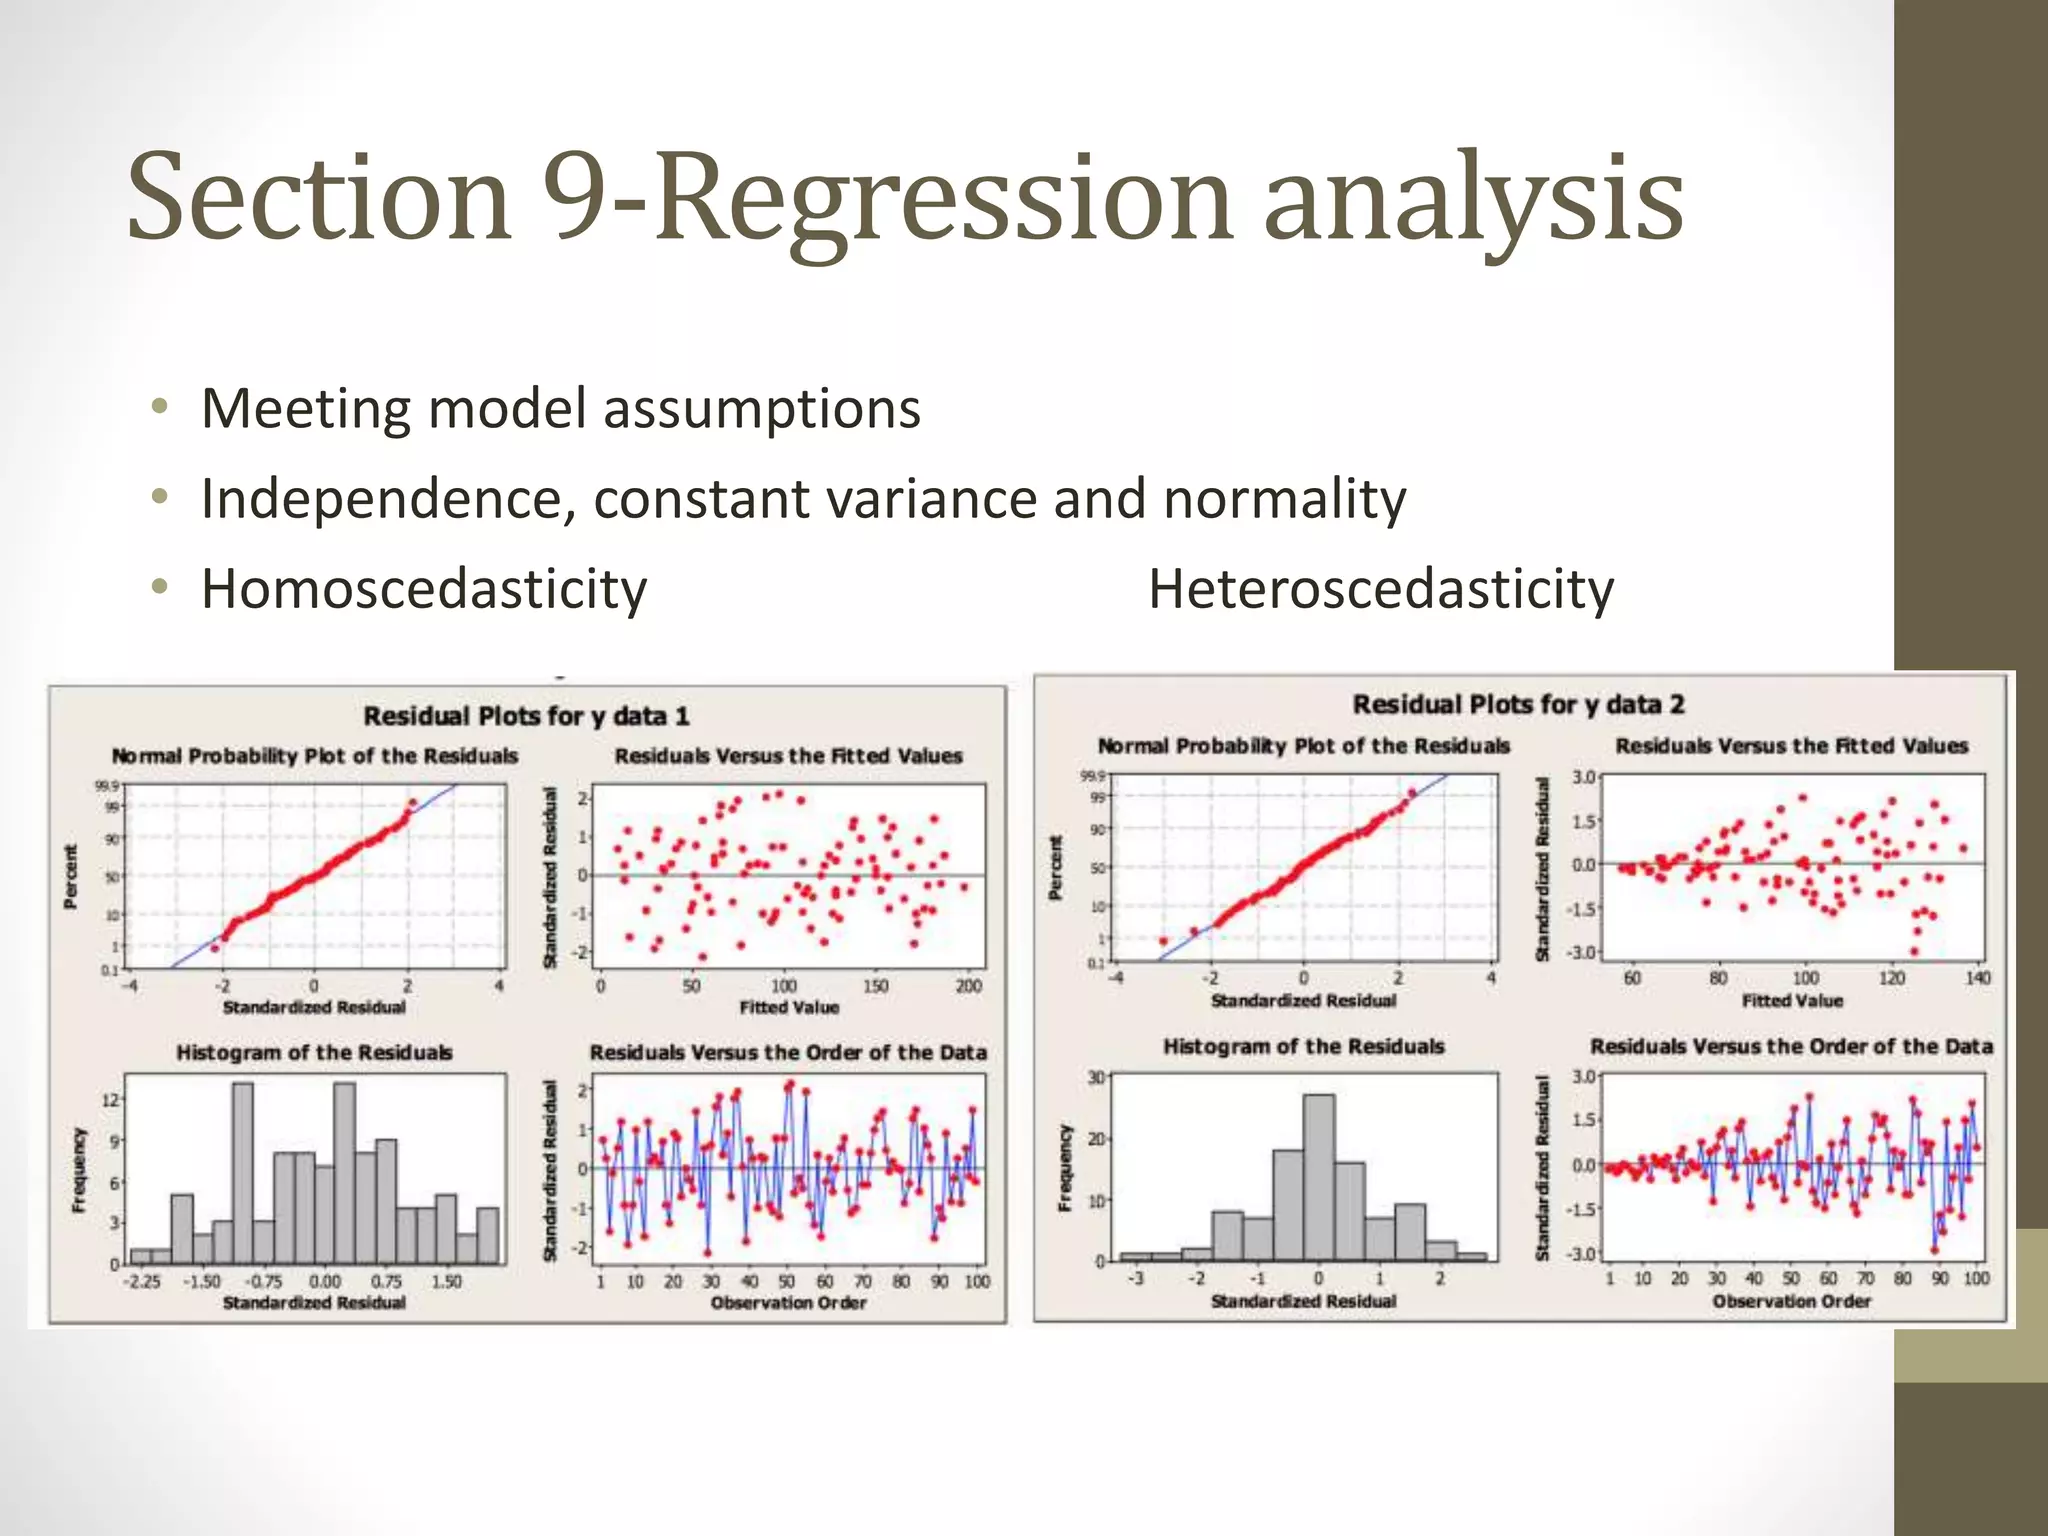
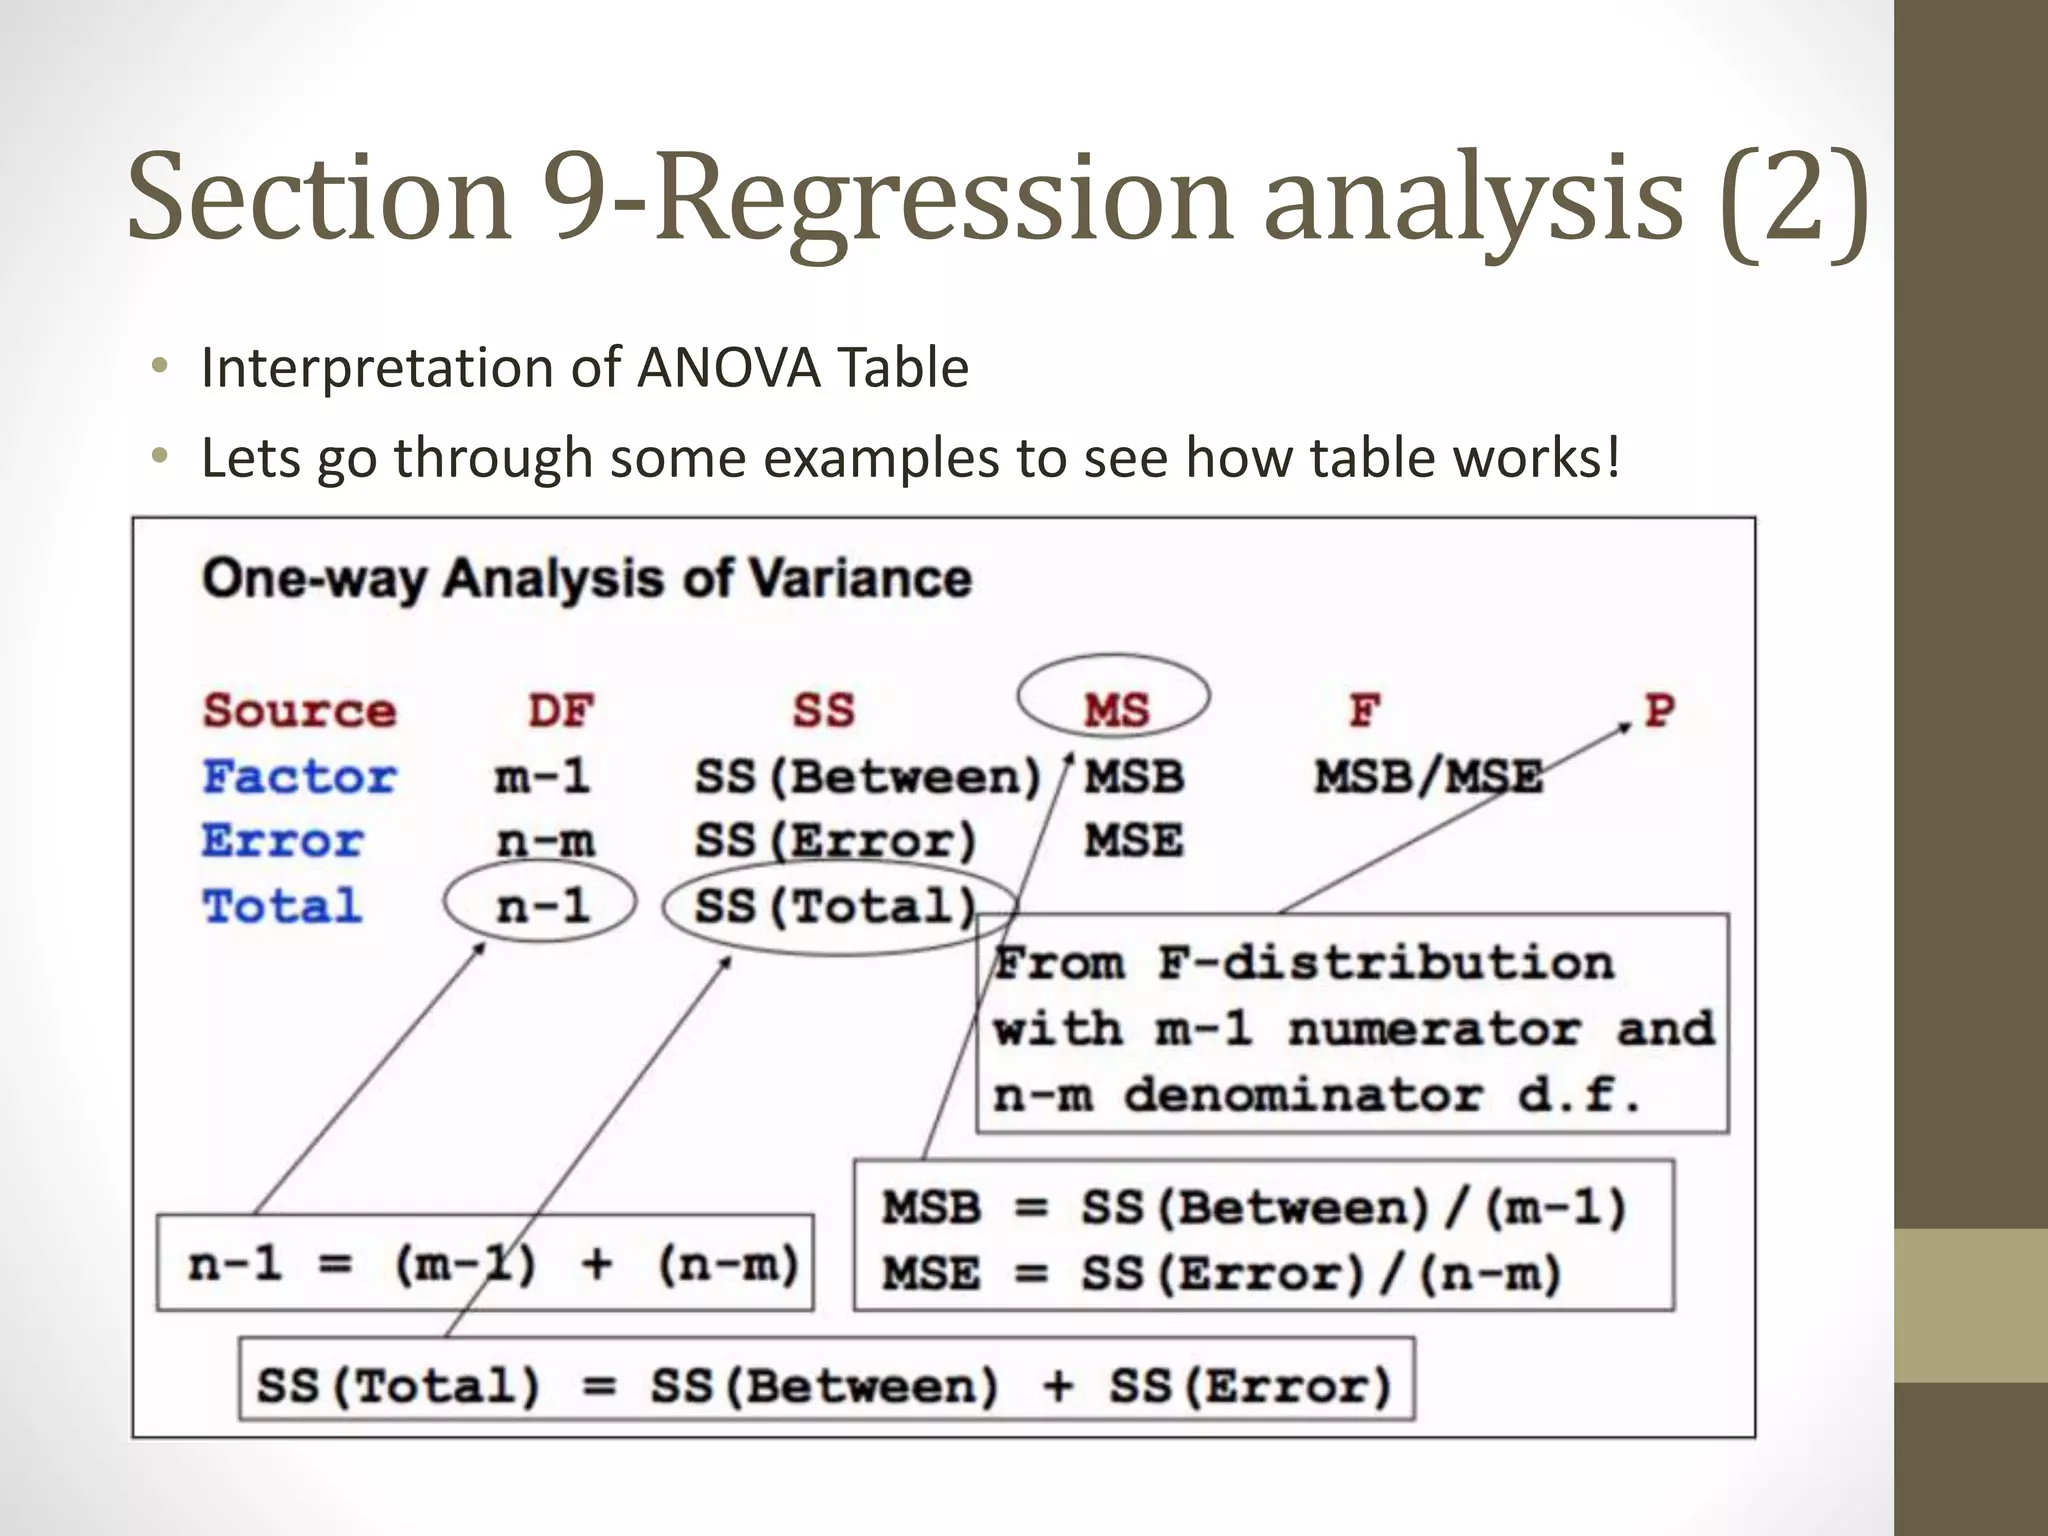
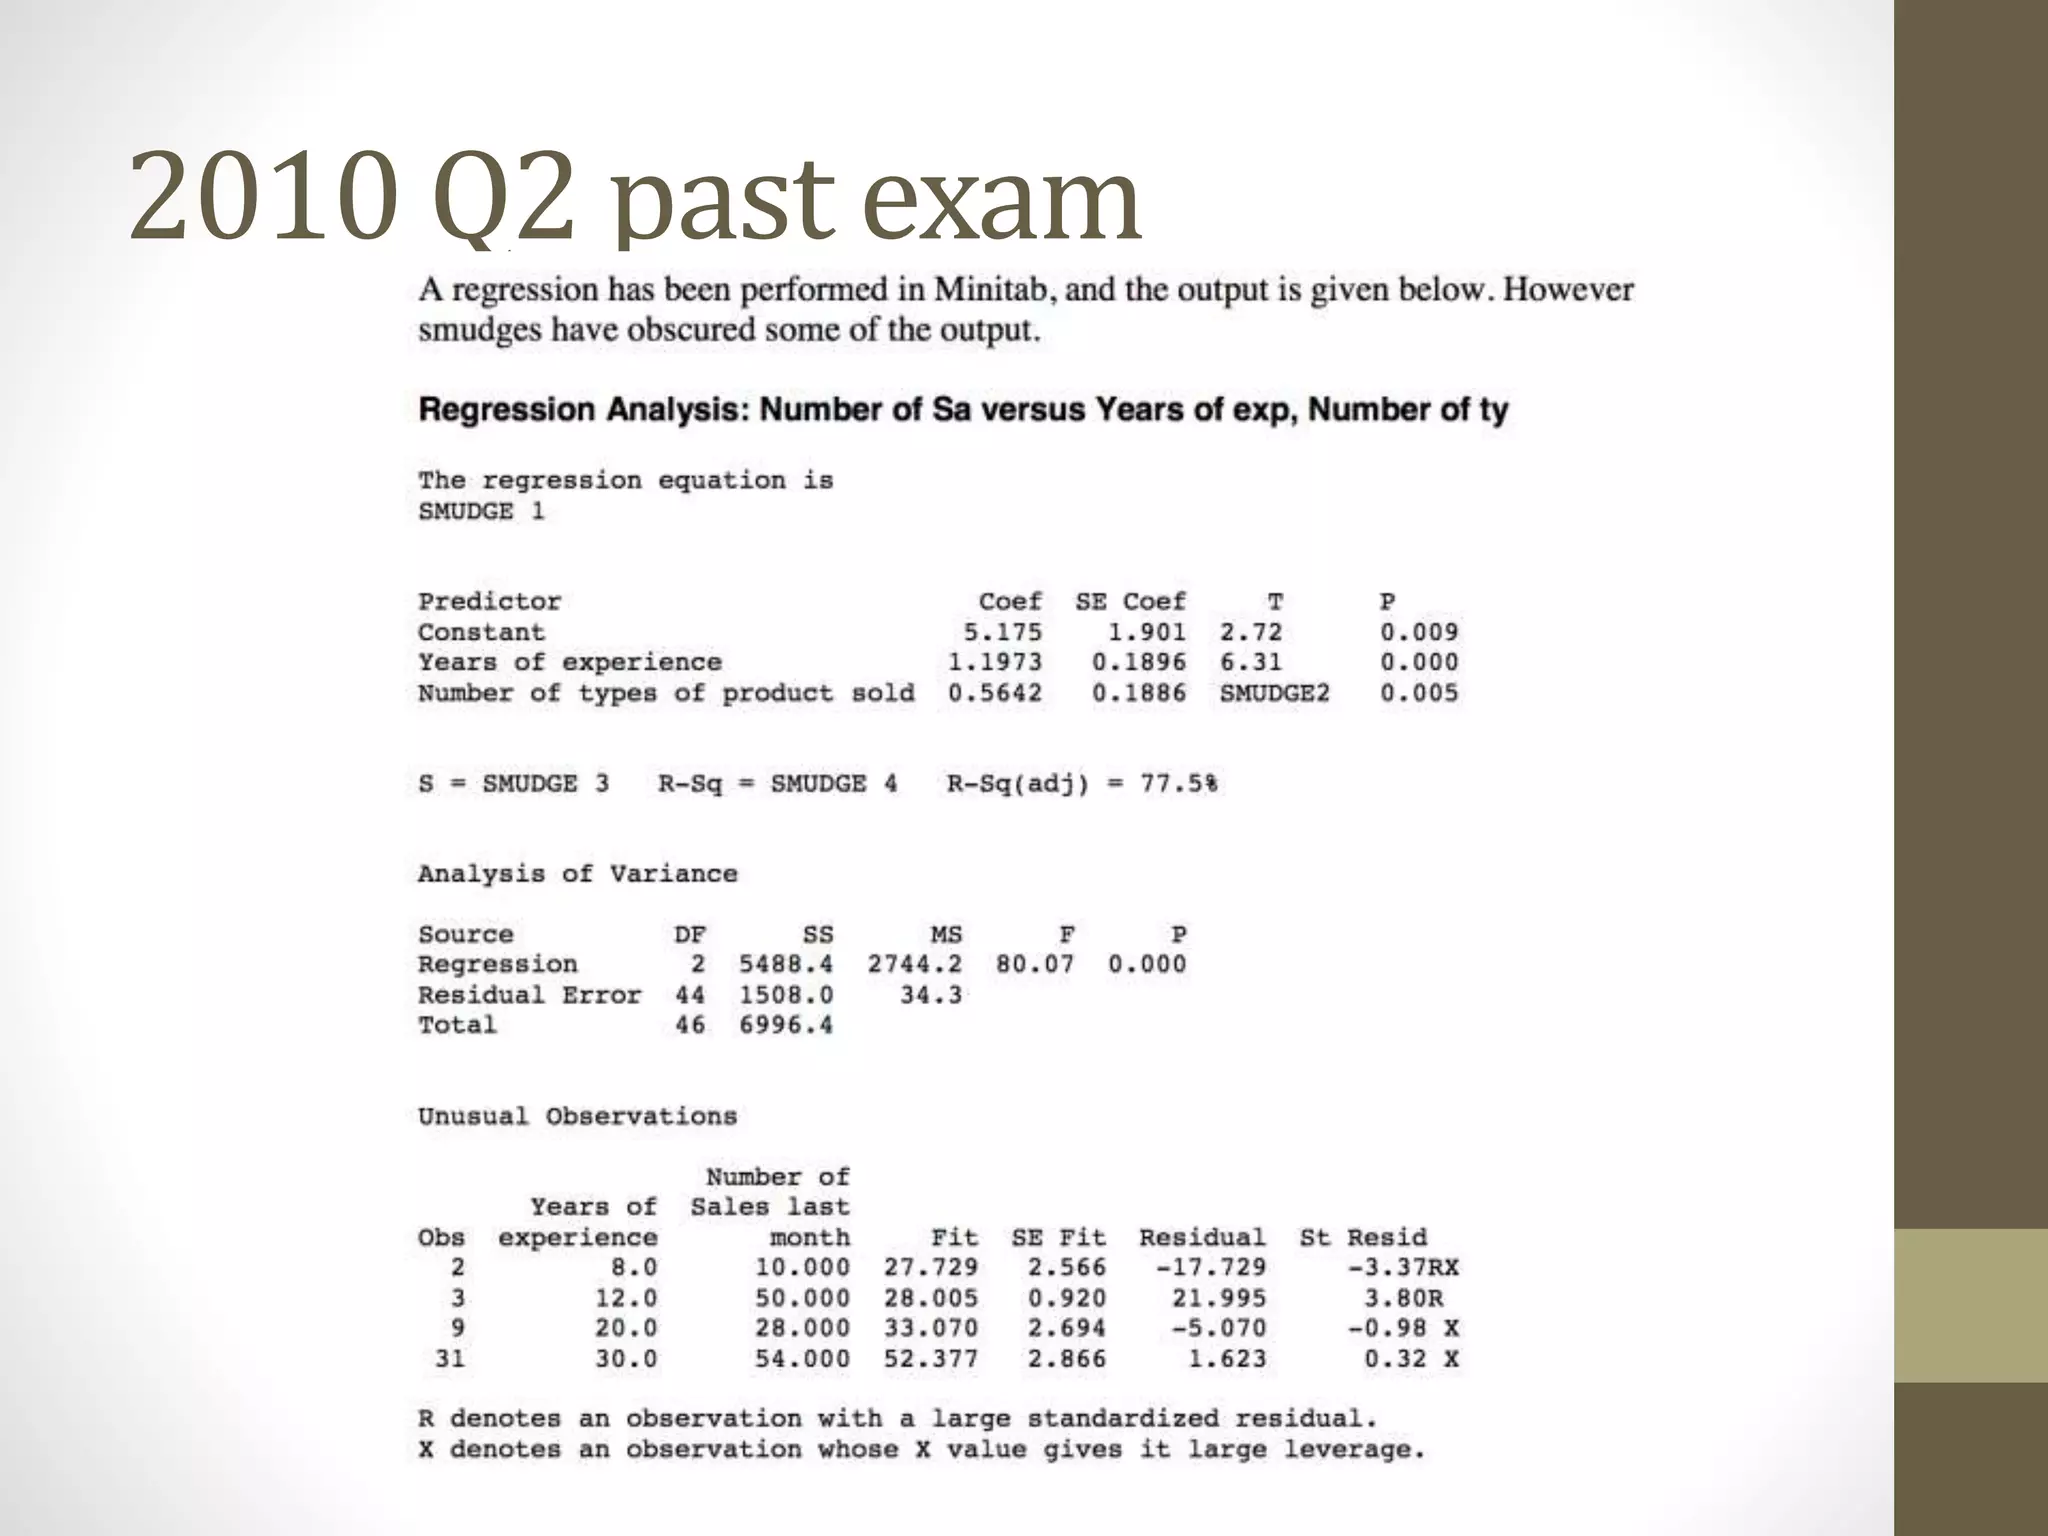
STAT1008
TUTORIAL
Jiabin Zhong
u5565270@uds.anu.edu.au
Overview
• Key points from each of the sections+ examples for harder
sections
• Example questions from previous exams
• Challenging questions students found hard
• General hints and tips throughout the presentation
Section 1-Data collection
• Probability VS non probability sampling
• Comparison of sampling techniques
Section 2-Variables, Data and
Statistics
• Mean and Variance
• Covariance and Correlation
Section 3-Probability (1)
• Recommend Venn Diagrams when approaching simple
probability questions.
• Key relationships
• (1)
• (2)
• (3)Conditional:
• (4)Independence:
• (5)Multiplication rule:
Section 3-Probability (2)
• Rules for expectation: Rules for variance:
Binomial Tables:
• Example: Find P(-2<Z<2)
•
Probability examples
Section 4- Continuous probability
distributions
• Uniform distribution
• Standardising
• If X is approximately normal with mean μ and variance σ2
Uniform problem examples
Section 5-Sampling Distributions
• Central Limit Theorem: If X is a random variable with a mean µ
and variance σ²,
• CLT holds for all large samples. E.g.: n ≥ 50.
• REMEMBER: some questions will give variance instead of std.
dev. to mislead you. Be sure to convert.
 
2
,
~ 0,1 as .
X N
n
X
Z N n
n




 
  
 

  
Section 6- Interval estimation
• 100(1-α)% Confidence Interval: (Refer to normal tables)
• An alpha of 0.05 means for a repeated sampling , 95% of such
intervals created would contain the true population mean.
/2 /2
/2
100(1 )%
100(1 )% CI:
P x Z x Z
n n
x Z
n
 

 
 


 
      
 
 
Section 7- Hypothesis testing (1)
• Two tailed H0= C, HA ≠ C
• One tailed H0=C, HA>C (or HA<C)
• TS (know variance): Compare with Z-Standard normal
distribution
• TS (unknown variance): Compare with t-distribution with n-1
degrees of freedom
• Give appropriate conclusion
Section 7- Hypothesis testing (2)
• Difference between single sample mean
Two tailed and one tailed
examples- Likely to be on exam
Section 8-Hypothesis test (3)
• Same steps as previous slides when conducting a hypothesis
test for two variances.
• 1. Null and Alternative hypothesis
• 2. Test statistic-(Generally put larger sample variance on top)
Section 8- Hypothesis test (4)
• 3. Decision rule
• Compare with F-distribution with n-1 numerator and n-1
denominator given the required alpha level.
• Conclusion
Section 9-Regression analysis
• Meeting model assumptions
• Independence, constant variance and normality
• Homoscedasticity Heteroscedasticity
Section 9-Regression analysis (2)
• Interpretation of ANOVA Table
• Lets go through some examples to see how table works!
2010 Q2 past exam
Other questions
• 2013 Q1
Good luck for your exam!!!•

Stat1008 Tutorial

  • 1.
  • 2.
    Overview • Key pointsfrom each of the sections+ examples for harder sections • Example questions from previous exams • Challenging questions students found hard • General hints and tips throughout the presentation
  • 3.
    Section 1-Data collection •Probability VS non probability sampling • Comparison of sampling techniques
  • 4.
    Section 2-Variables, Dataand Statistics • Mean and Variance • Covariance and Correlation
  • 5.
    Section 3-Probability (1) •Recommend Venn Diagrams when approaching simple probability questions. • Key relationships • (1) • (2) • (3)Conditional: • (4)Independence: • (5)Multiplication rule:
  • 6.
    Section 3-Probability (2) •Rules for expectation: Rules for variance: Binomial Tables: • Example: Find P(-2<Z<2) •
  • 7.
  • 8.
    Section 4- Continuousprobability distributions • Uniform distribution • Standardising • If X is approximately normal with mean μ and variance σ2
  • 9.
  • 10.
    Section 5-Sampling Distributions •Central Limit Theorem: If X is a random variable with a mean µ and variance σ², • CLT holds for all large samples. E.g.: n ≥ 50. • REMEMBER: some questions will give variance instead of std. dev. to mislead you. Be sure to convert.   2 , ~ 0,1 as . X N n X Z N n n               
  • 11.
    Section 6- Intervalestimation • 100(1-α)% Confidence Interval: (Refer to normal tables) • An alpha of 0.05 means for a repeated sampling , 95% of such intervals created would contain the true population mean. /2 /2 /2 100(1 )% 100(1 )% CI: P x Z x Z n n x Z n                      
  • 12.
    Section 7- Hypothesistesting (1) • Two tailed H0= C, HA ≠ C • One tailed H0=C, HA>C (or HA<C) • TS (know variance): Compare with Z-Standard normal distribution • TS (unknown variance): Compare with t-distribution with n-1 degrees of freedom • Give appropriate conclusion
  • 13.
    Section 7- Hypothesistesting (2) • Difference between single sample mean
  • 14.
    Two tailed andone tailed examples- Likely to be on exam
  • 15.
    Section 8-Hypothesis test(3) • Same steps as previous slides when conducting a hypothesis test for two variances. • 1. Null and Alternative hypothesis • 2. Test statistic-(Generally put larger sample variance on top)
  • 16.
    Section 8- Hypothesistest (4) • 3. Decision rule • Compare with F-distribution with n-1 numerator and n-1 denominator given the required alpha level. • Conclusion
  • 17.
    Section 9-Regression analysis •Meeting model assumptions • Independence, constant variance and normality • Homoscedasticity Heteroscedasticity
  • 18.
    Section 9-Regression analysis(2) • Interpretation of ANOVA Table • Lets go through some examples to see how table works!
  • 19.
  • 22.
  • 23.
    Good luck foryour exam!!!•

Editor's Notes

  • #6 Draw Venn diagram
  • #7 P(Z<-2)=0.222 P(Z<2)=0.9778
  • #9 -Generally ask a uniform distribution problem for final exam
  • #15 Use alpha of 0.05 for Q9