Download to read offline
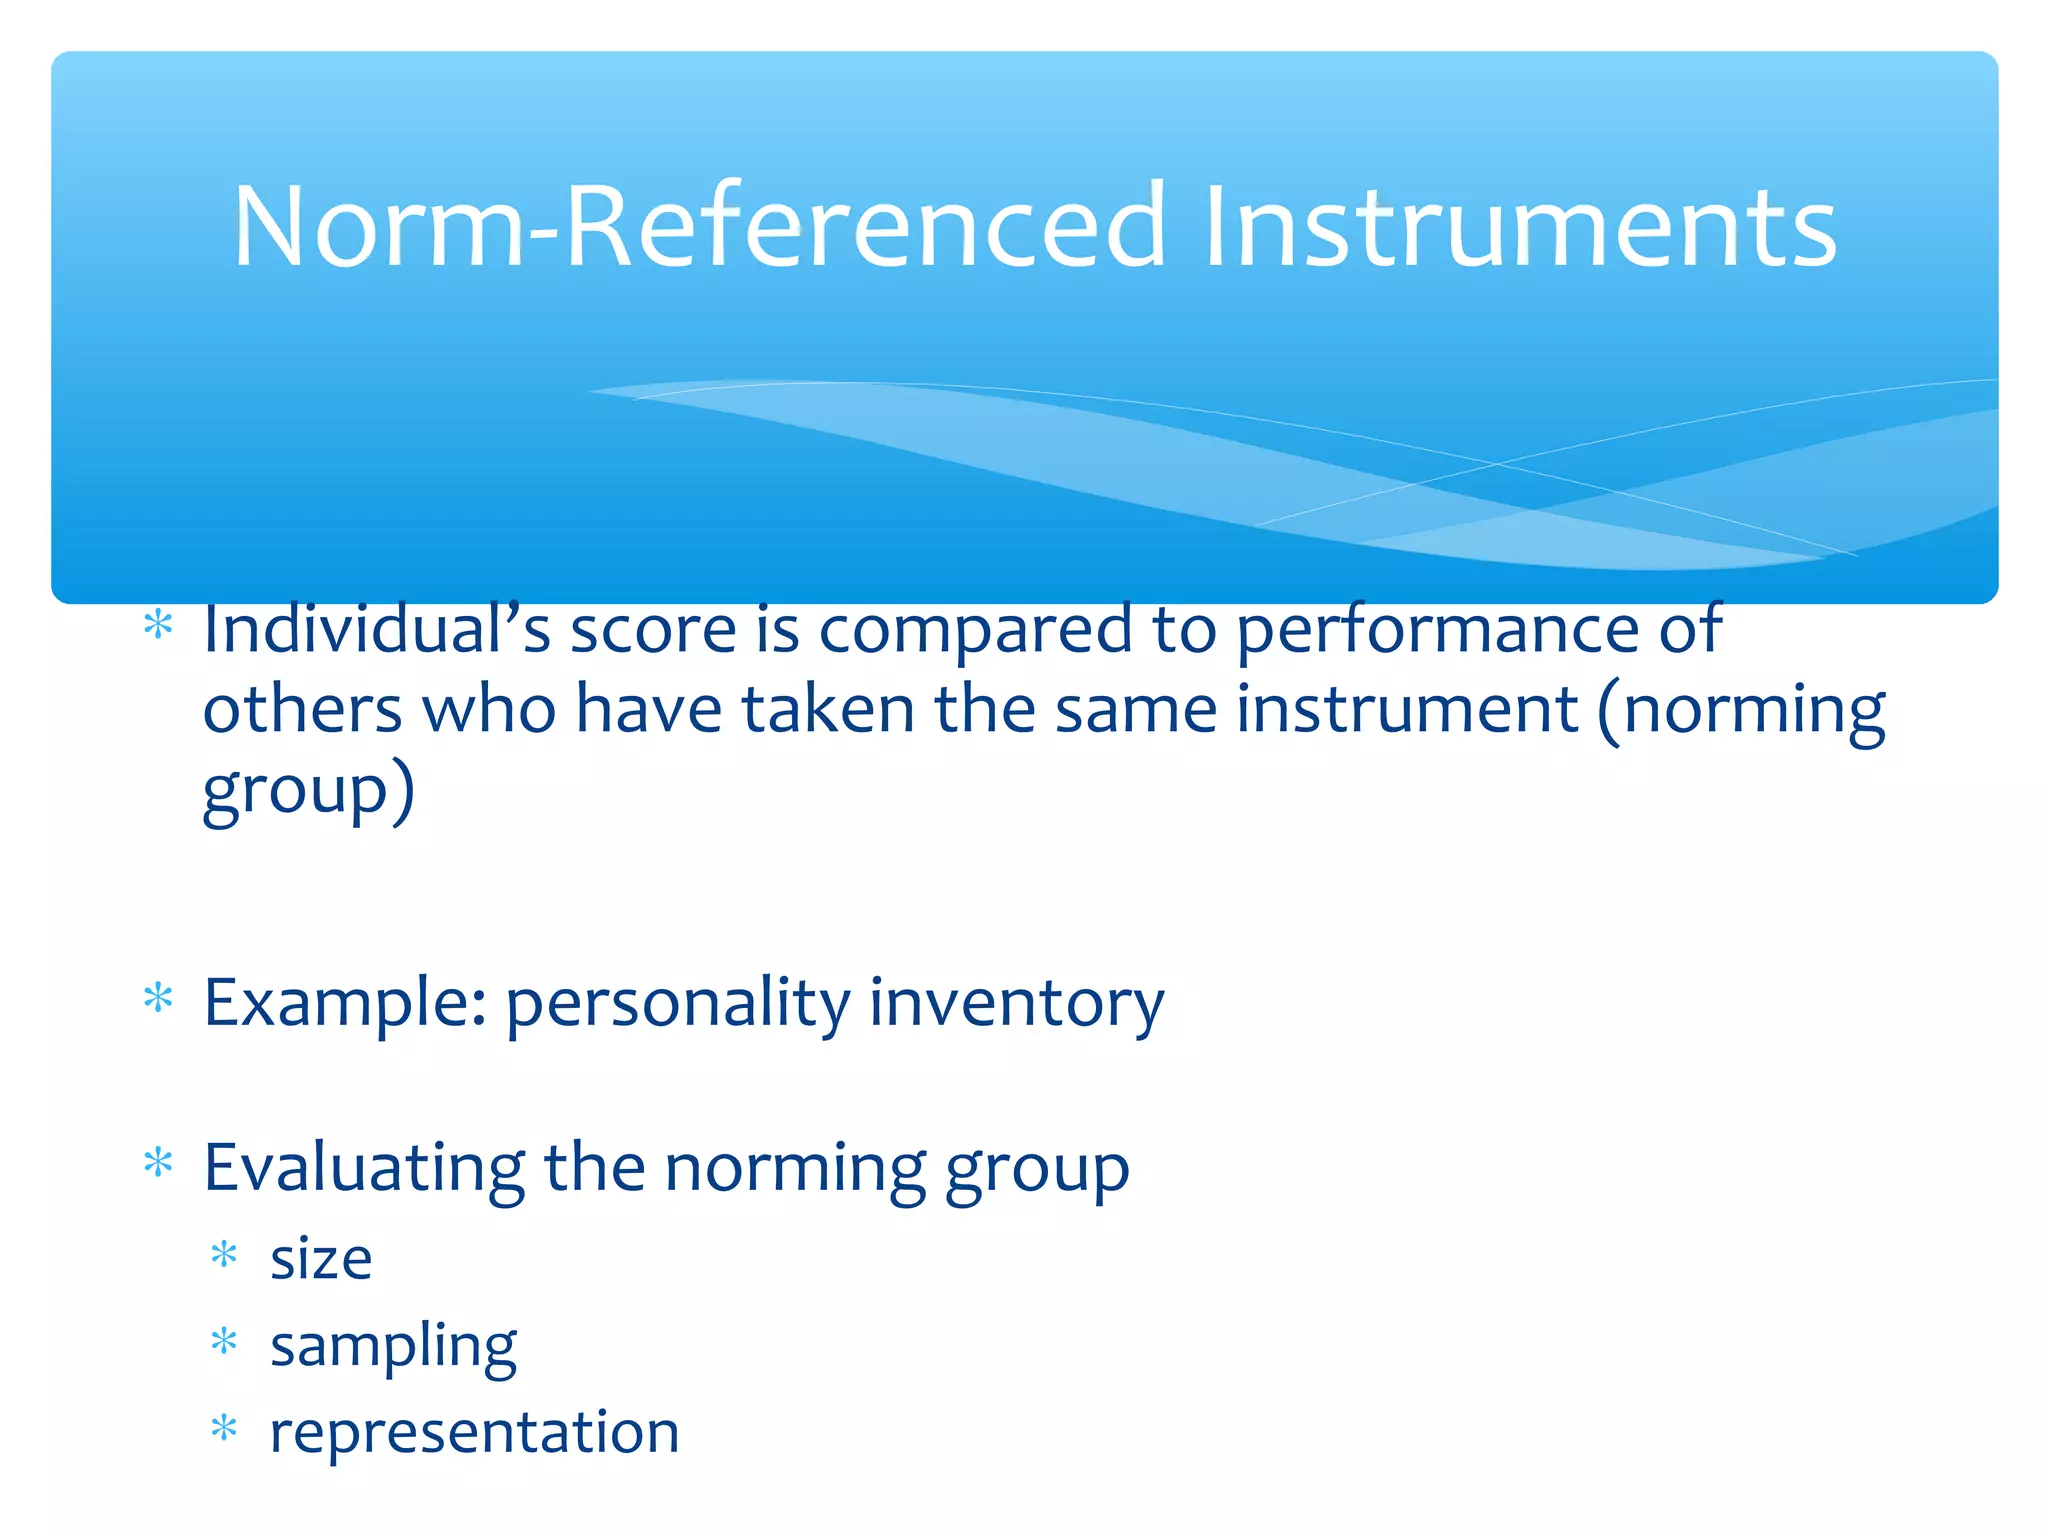
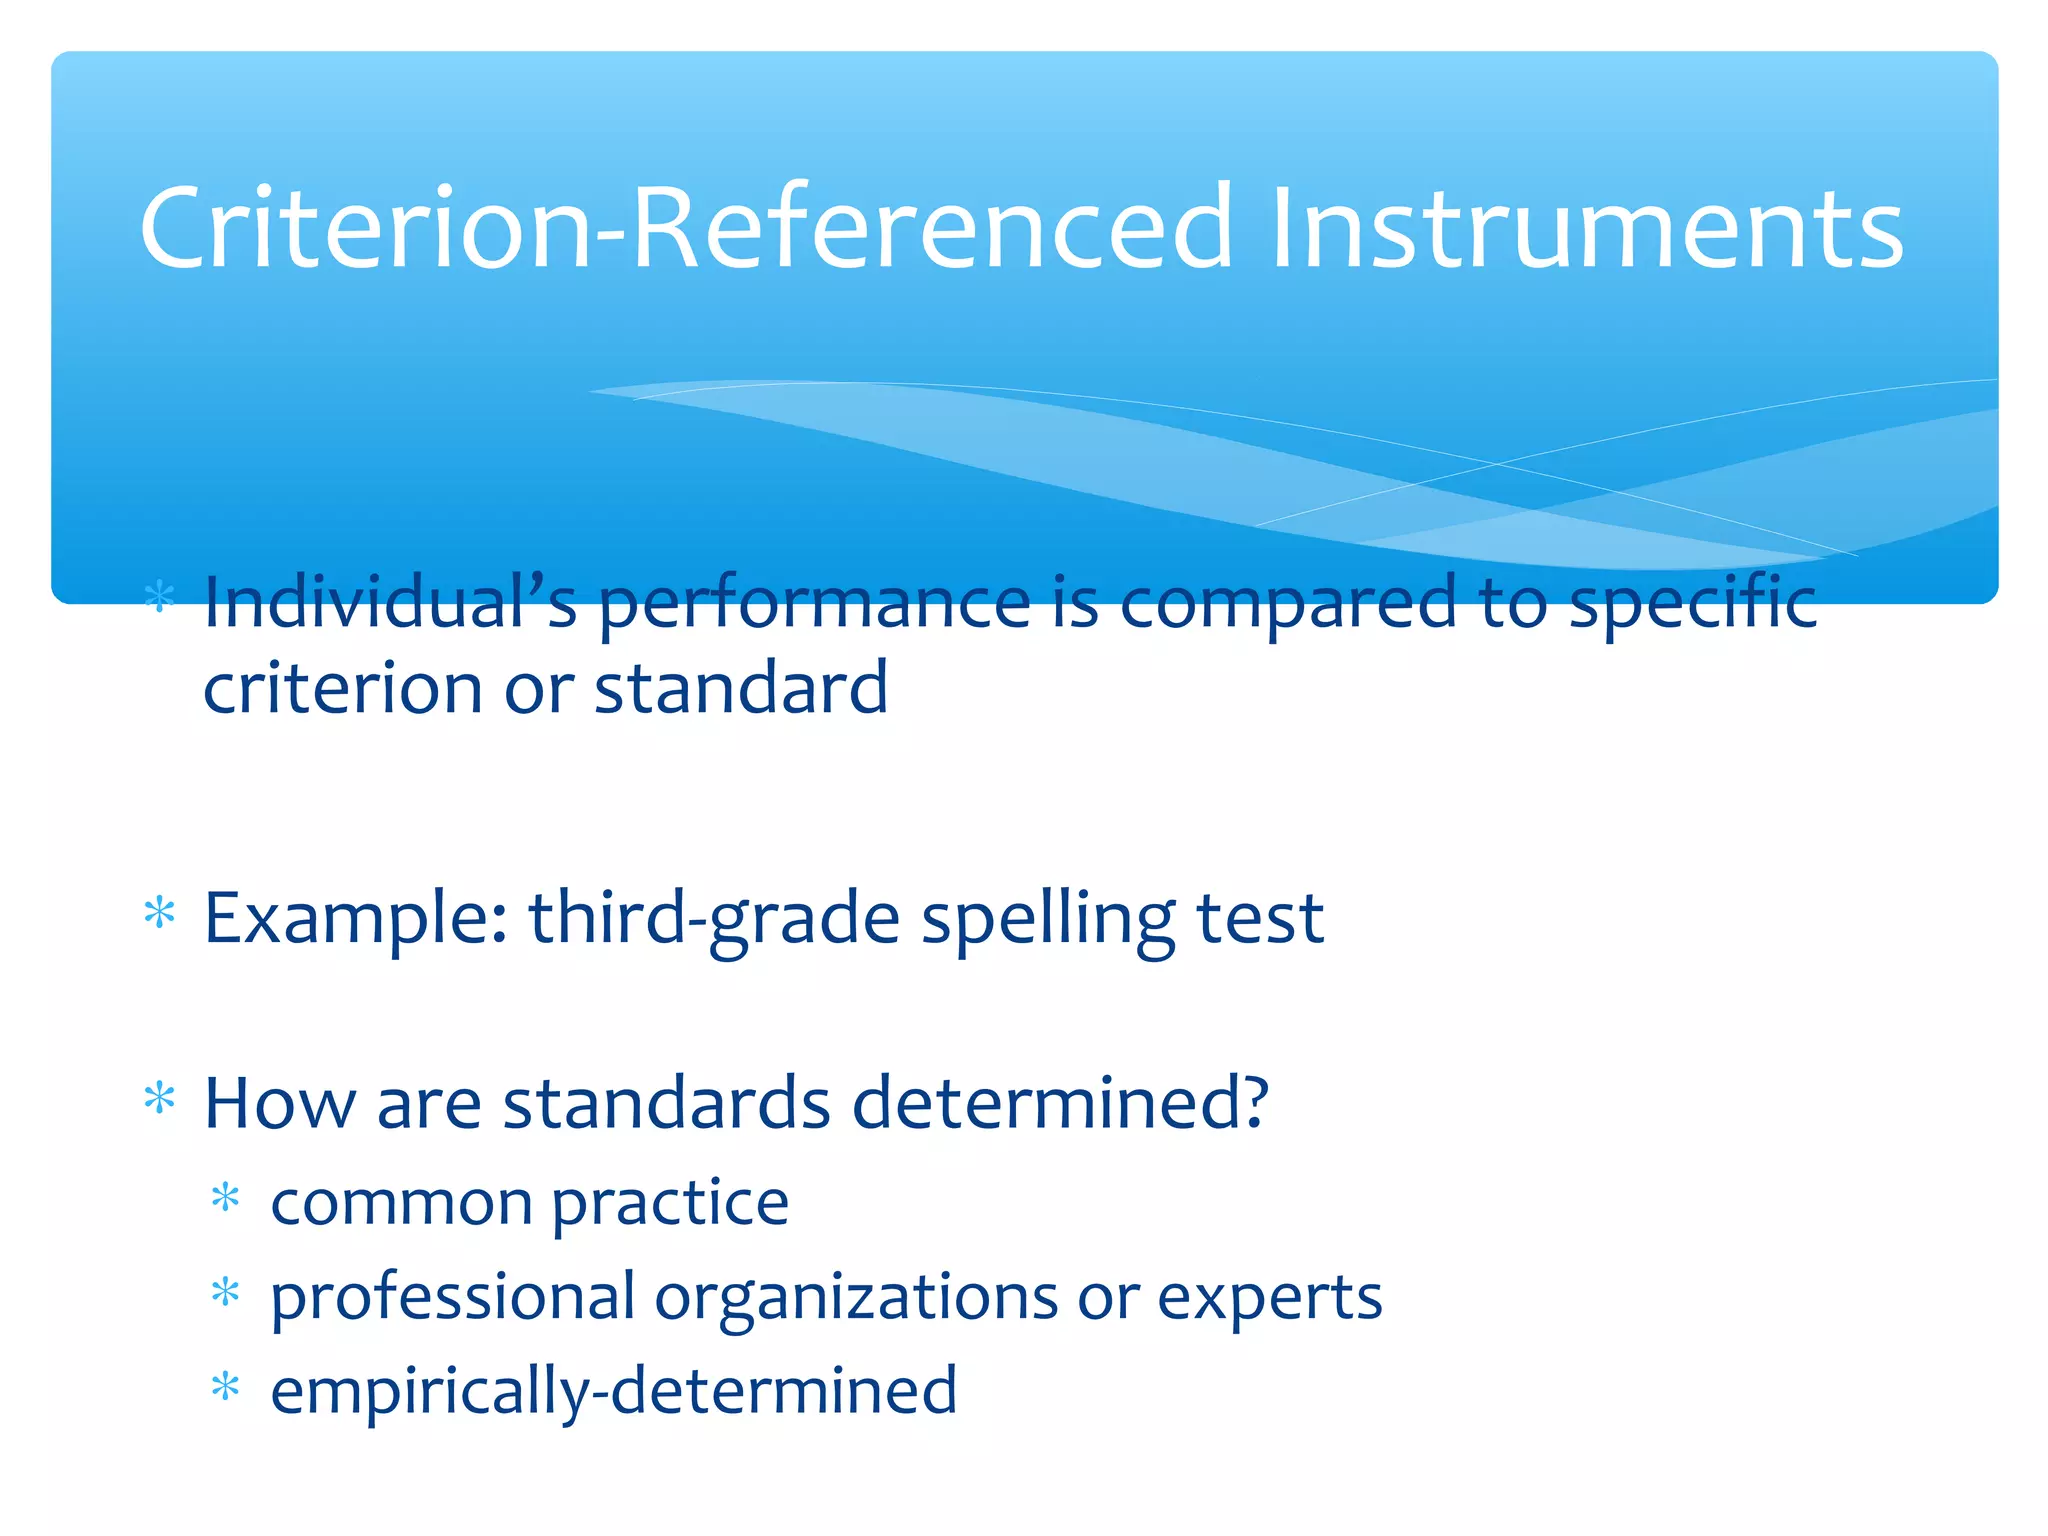
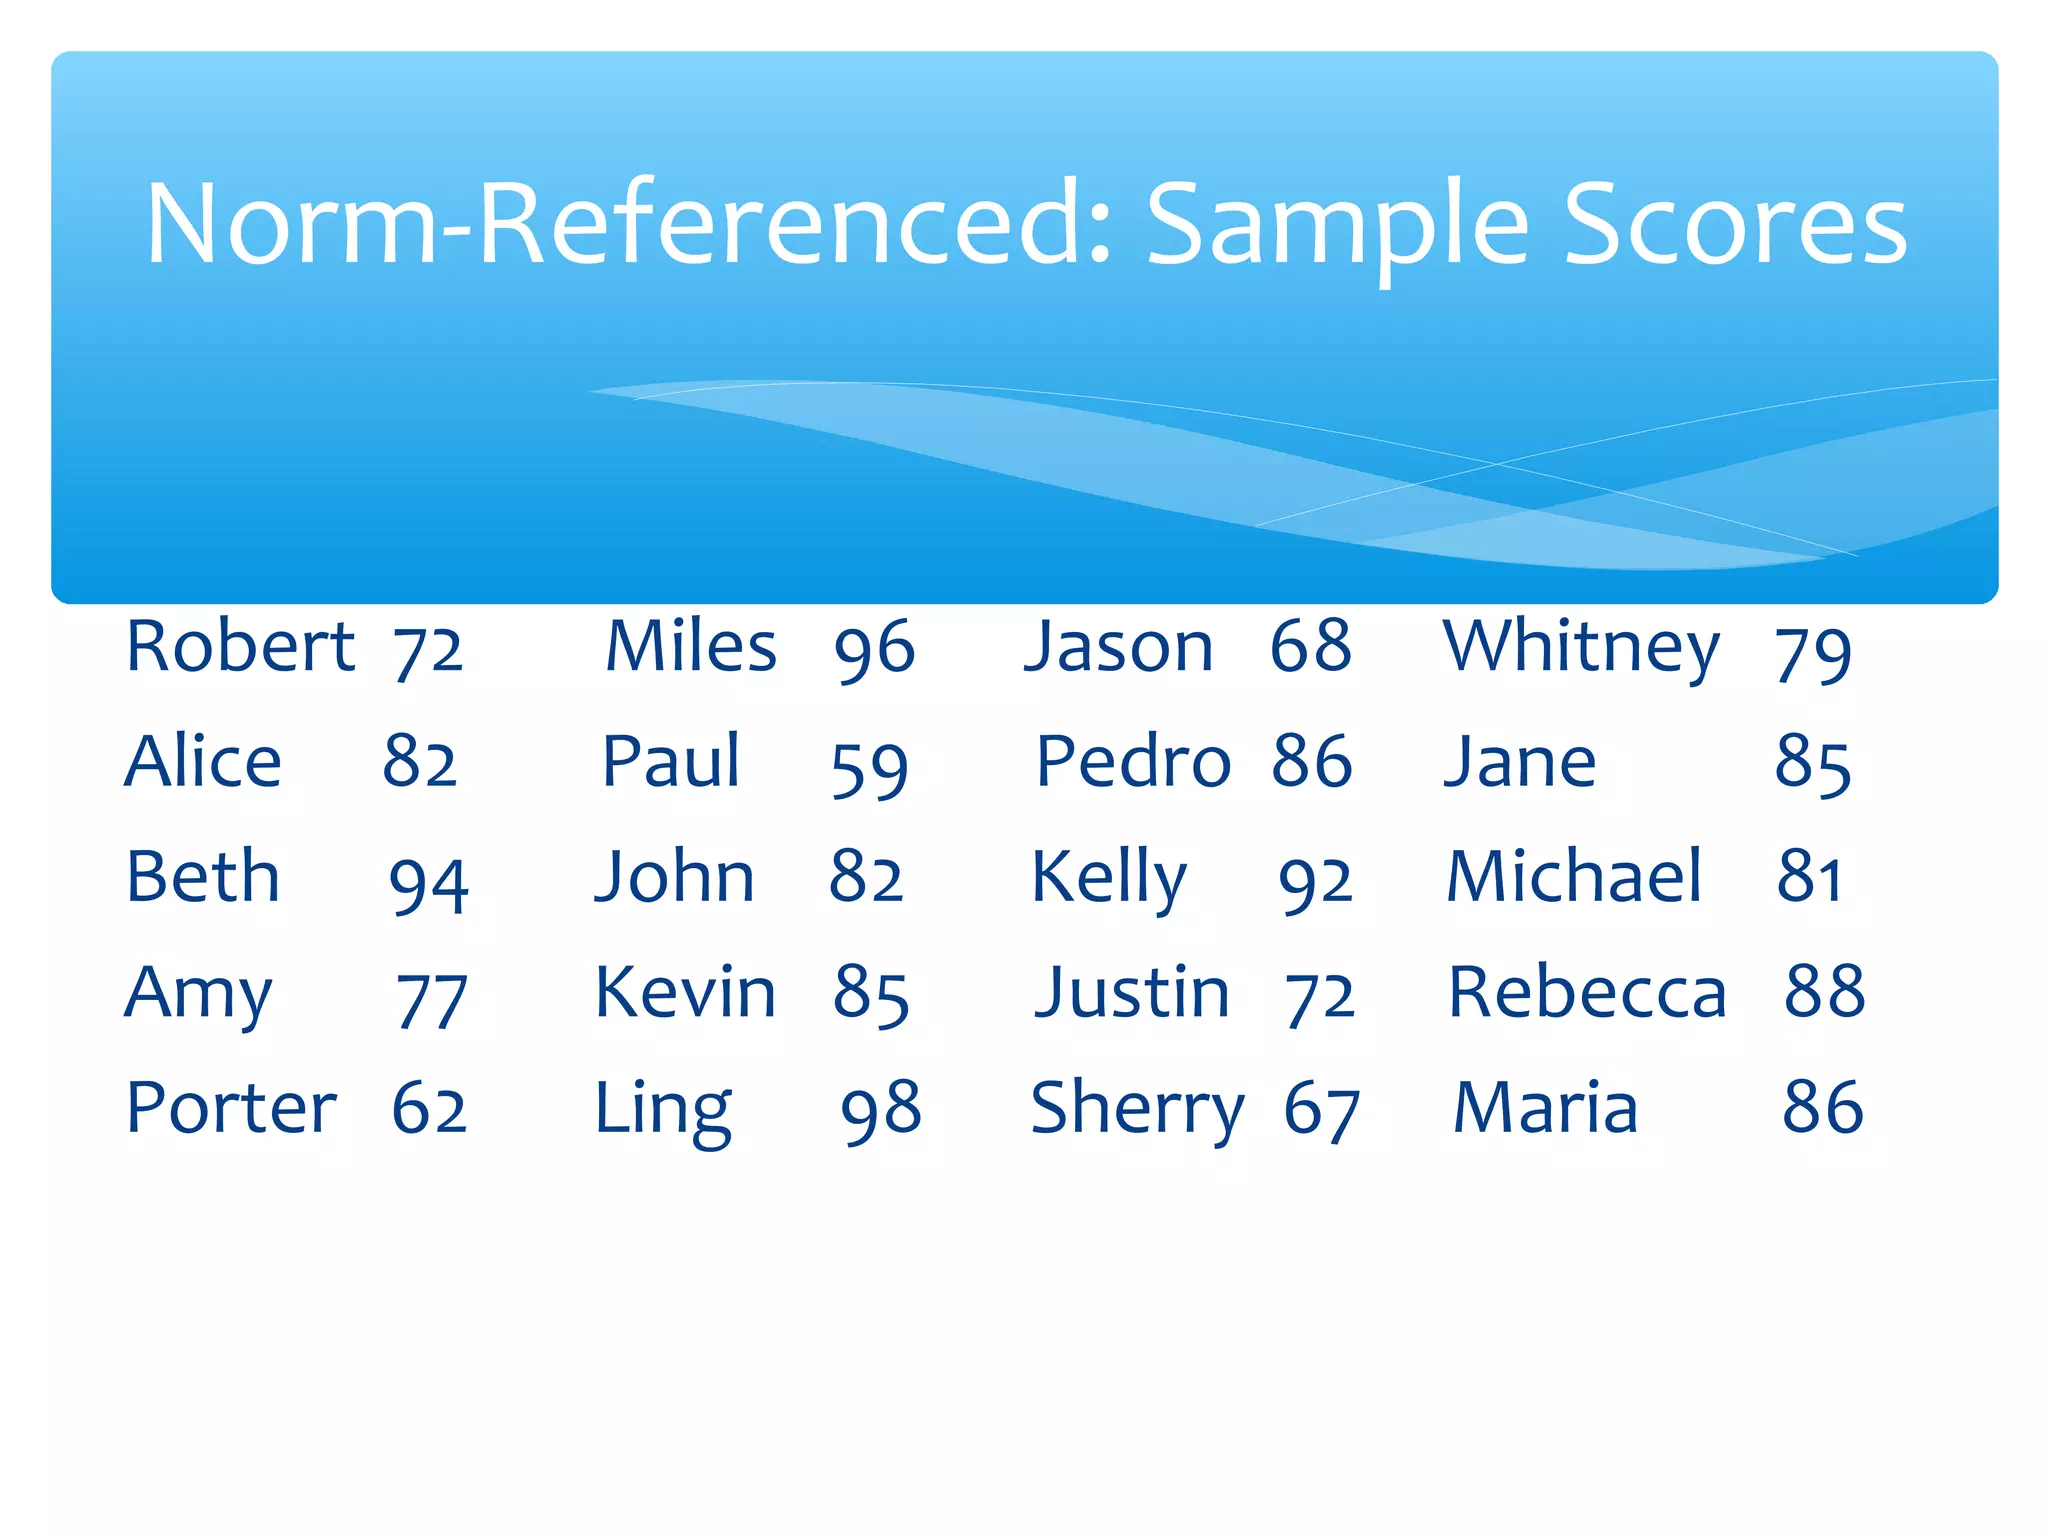
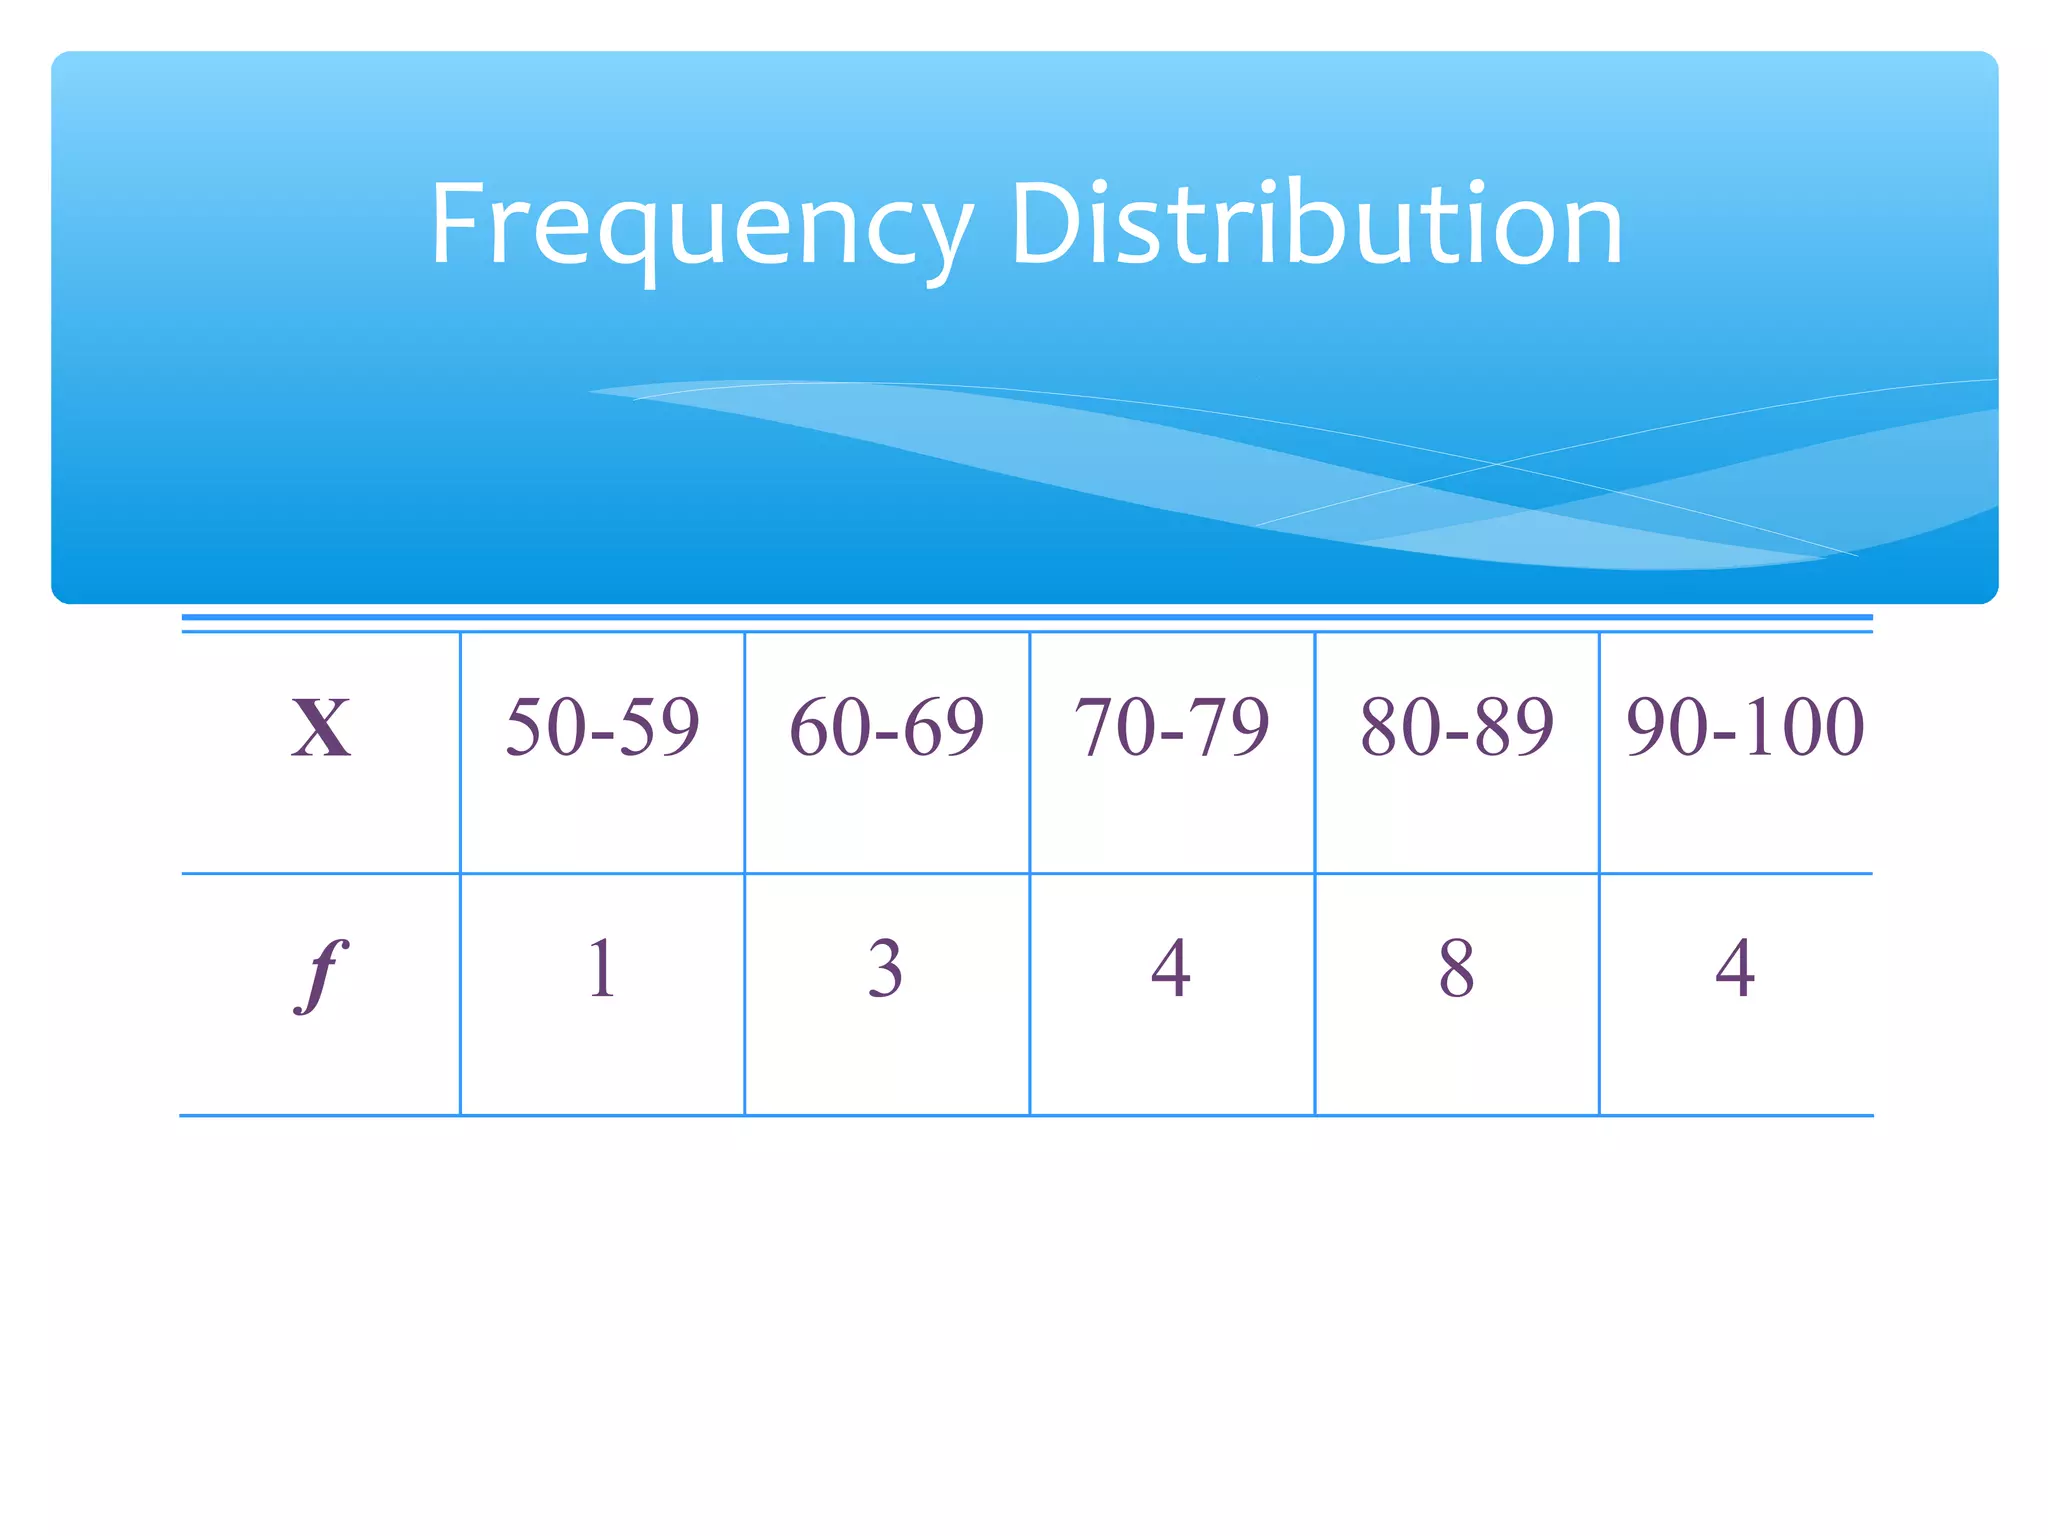
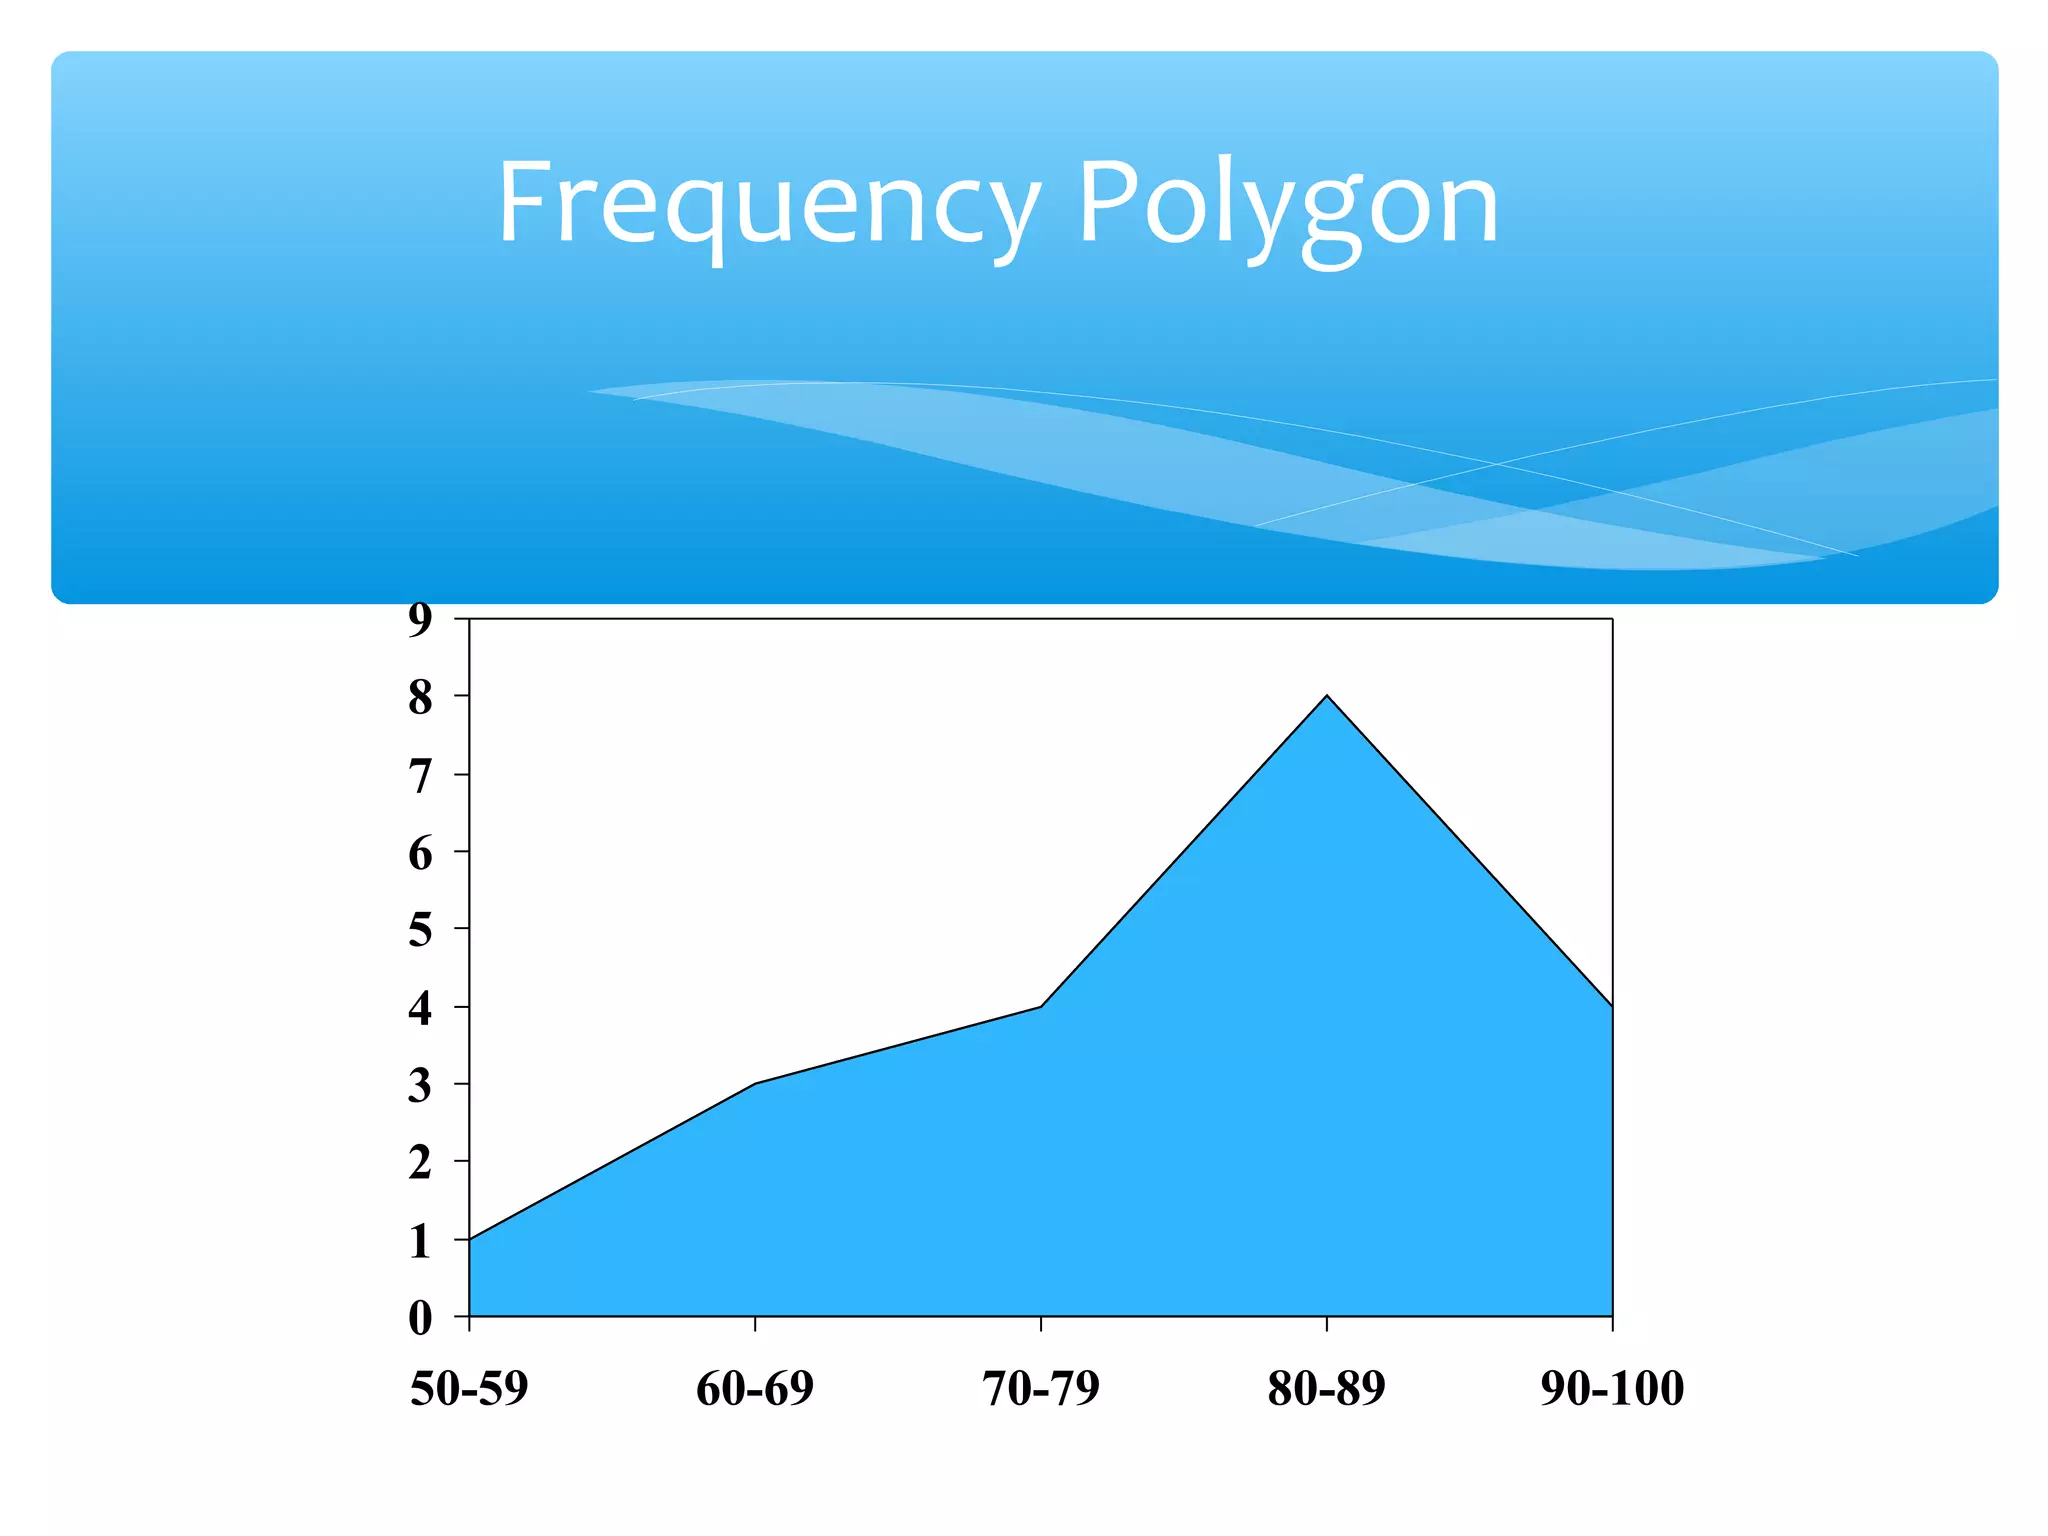
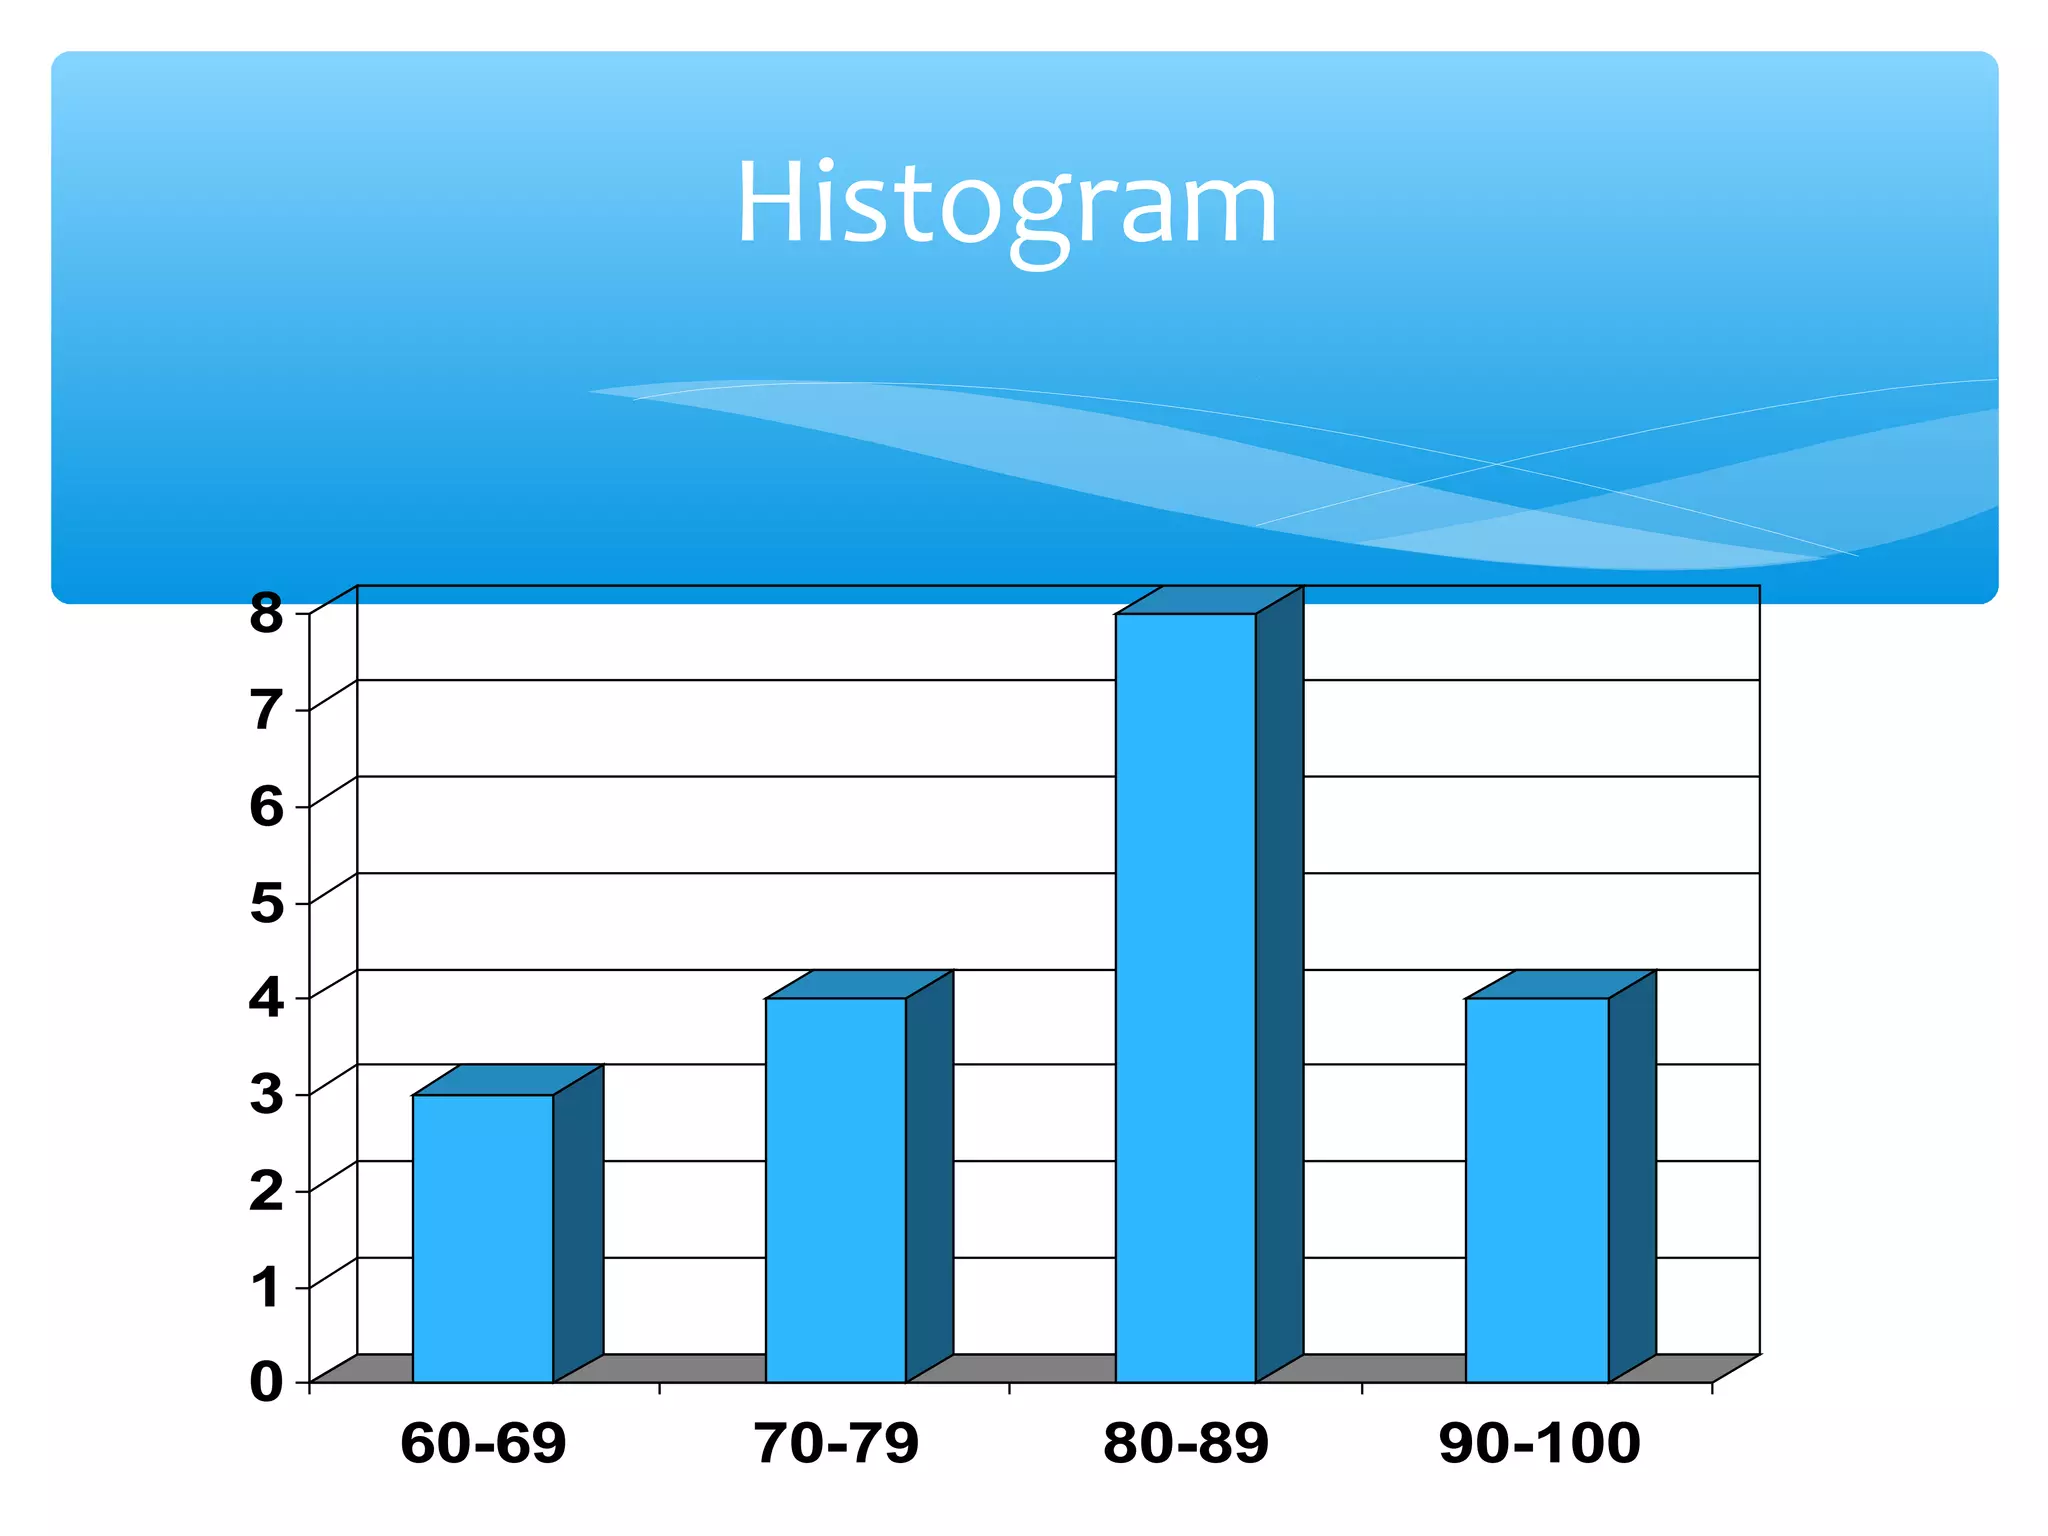
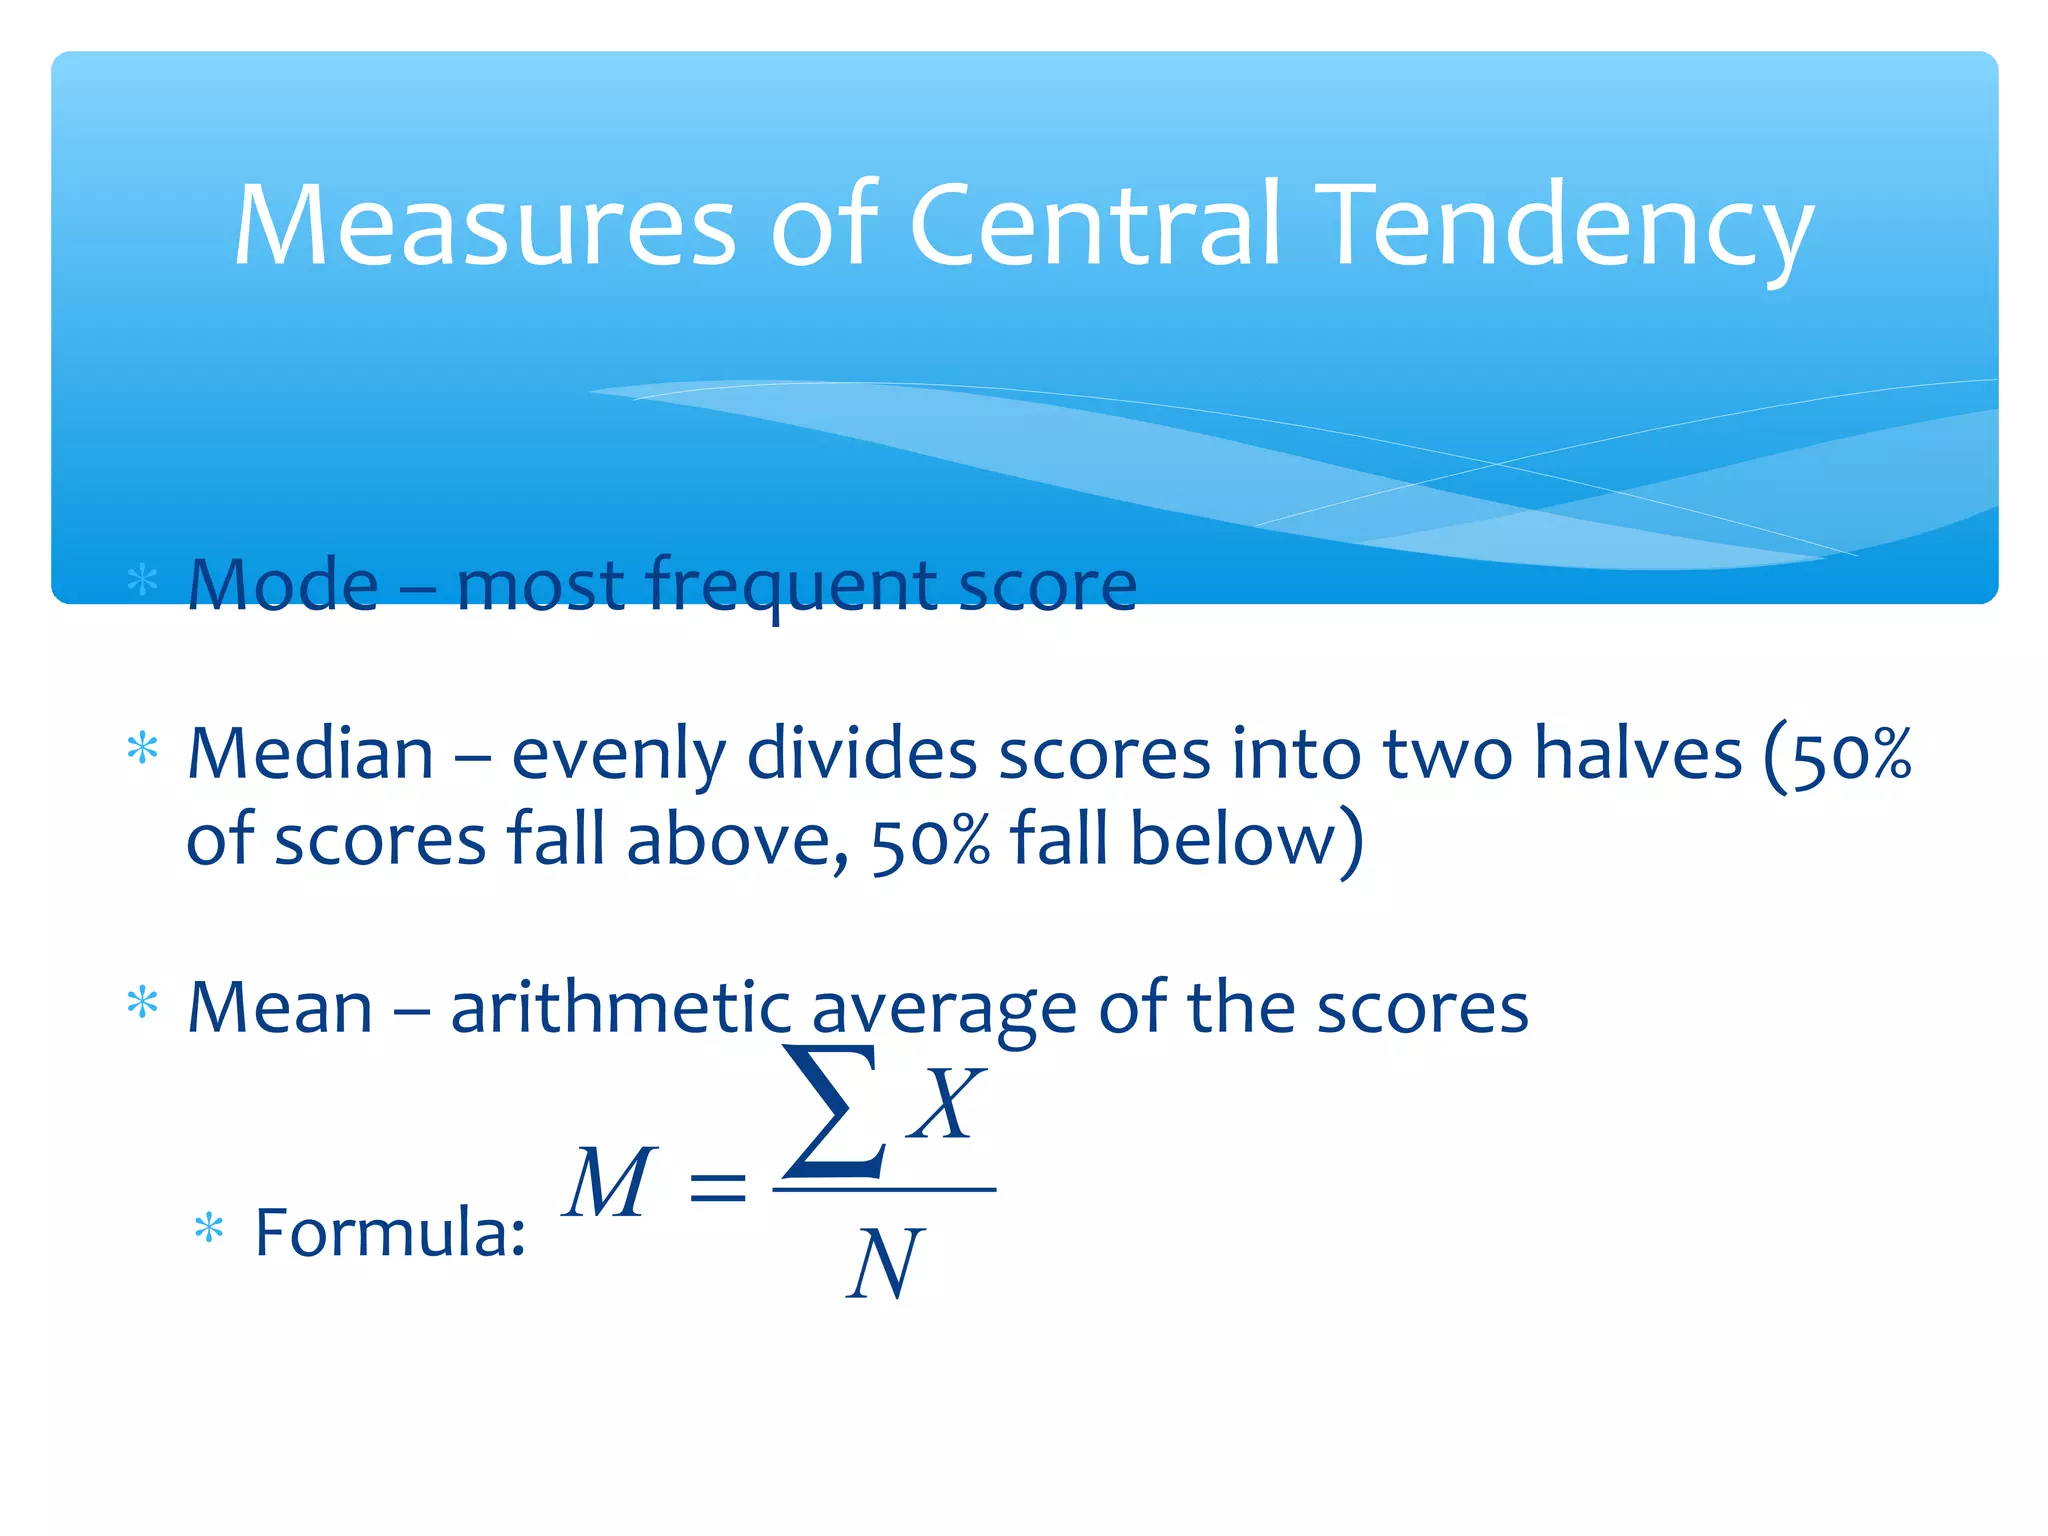
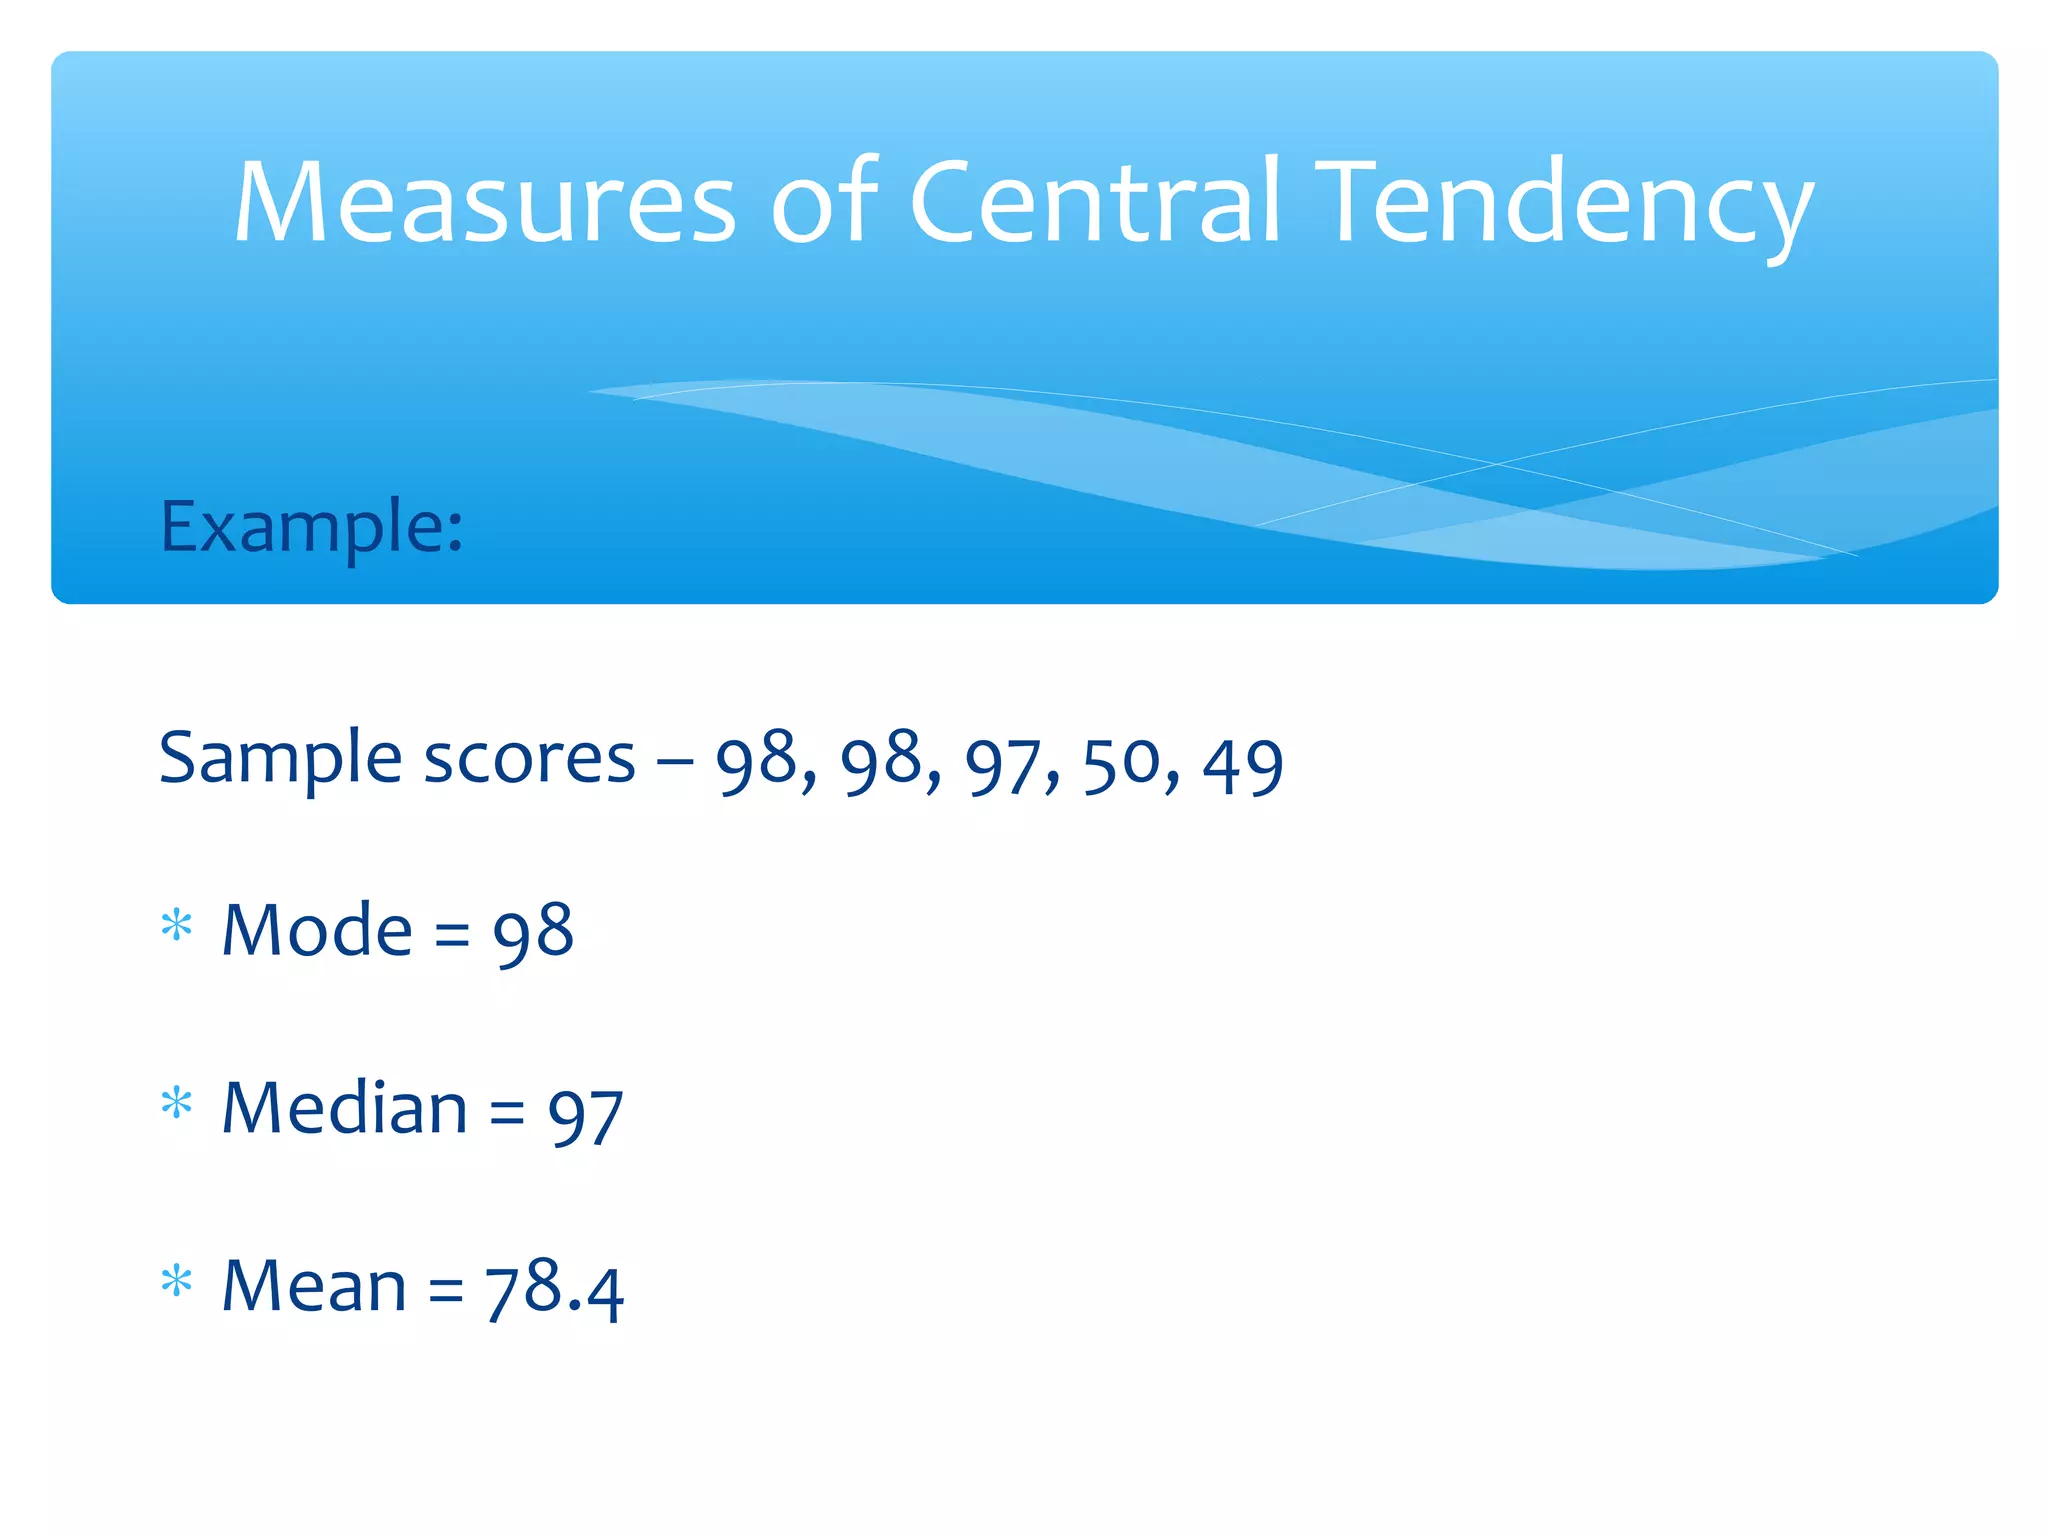
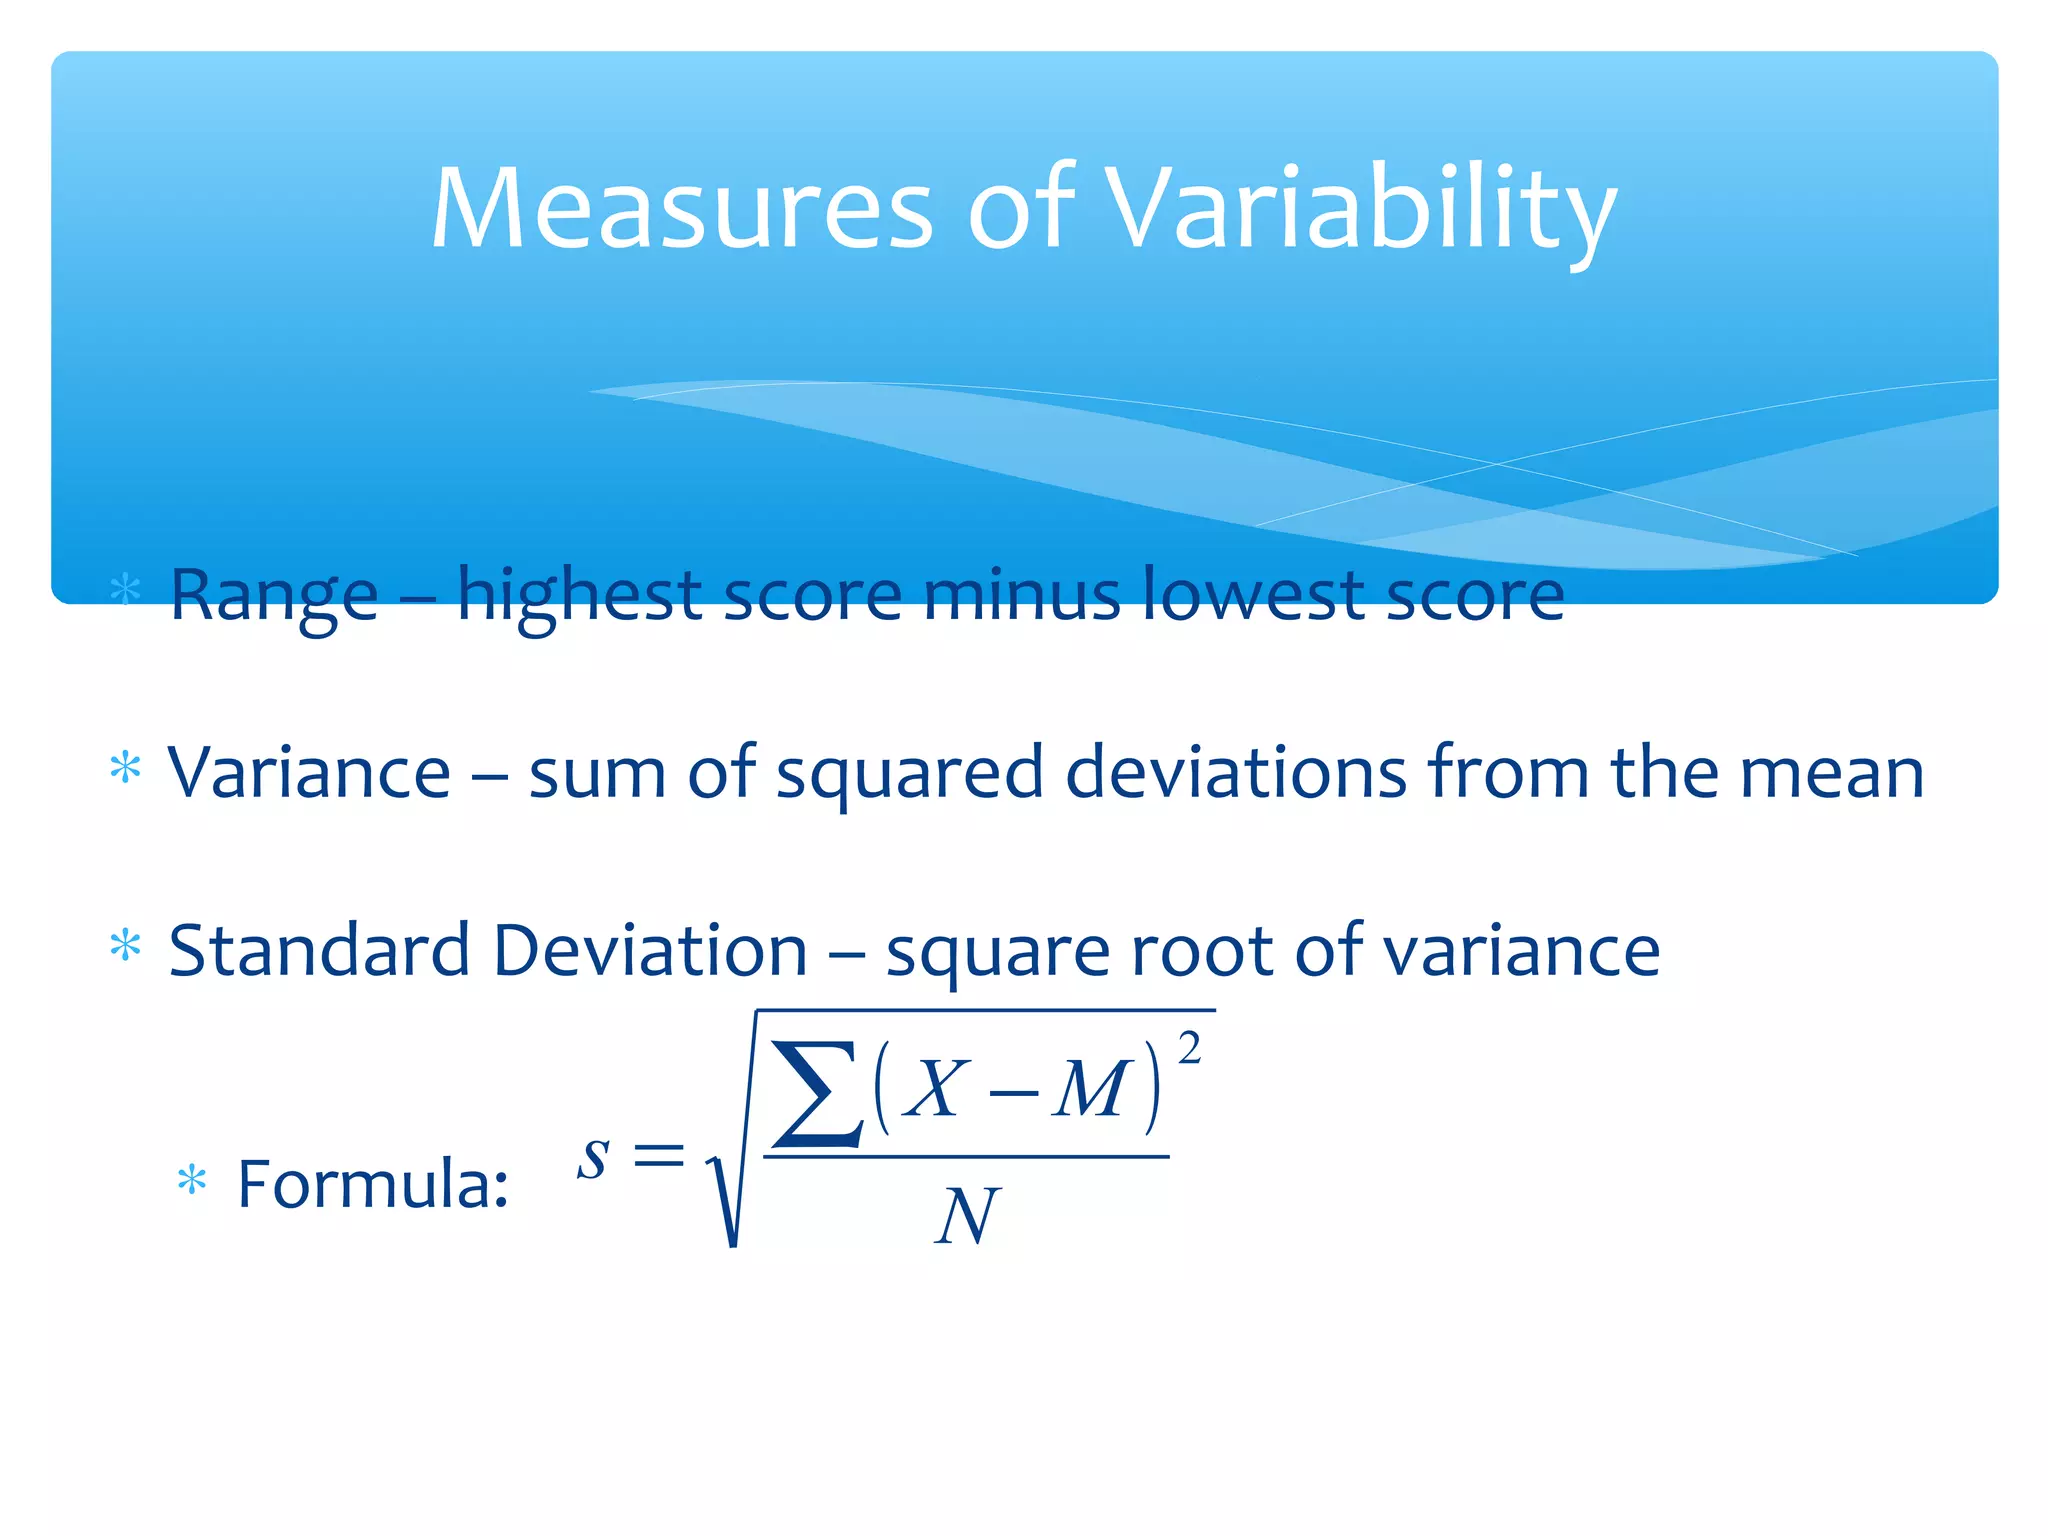
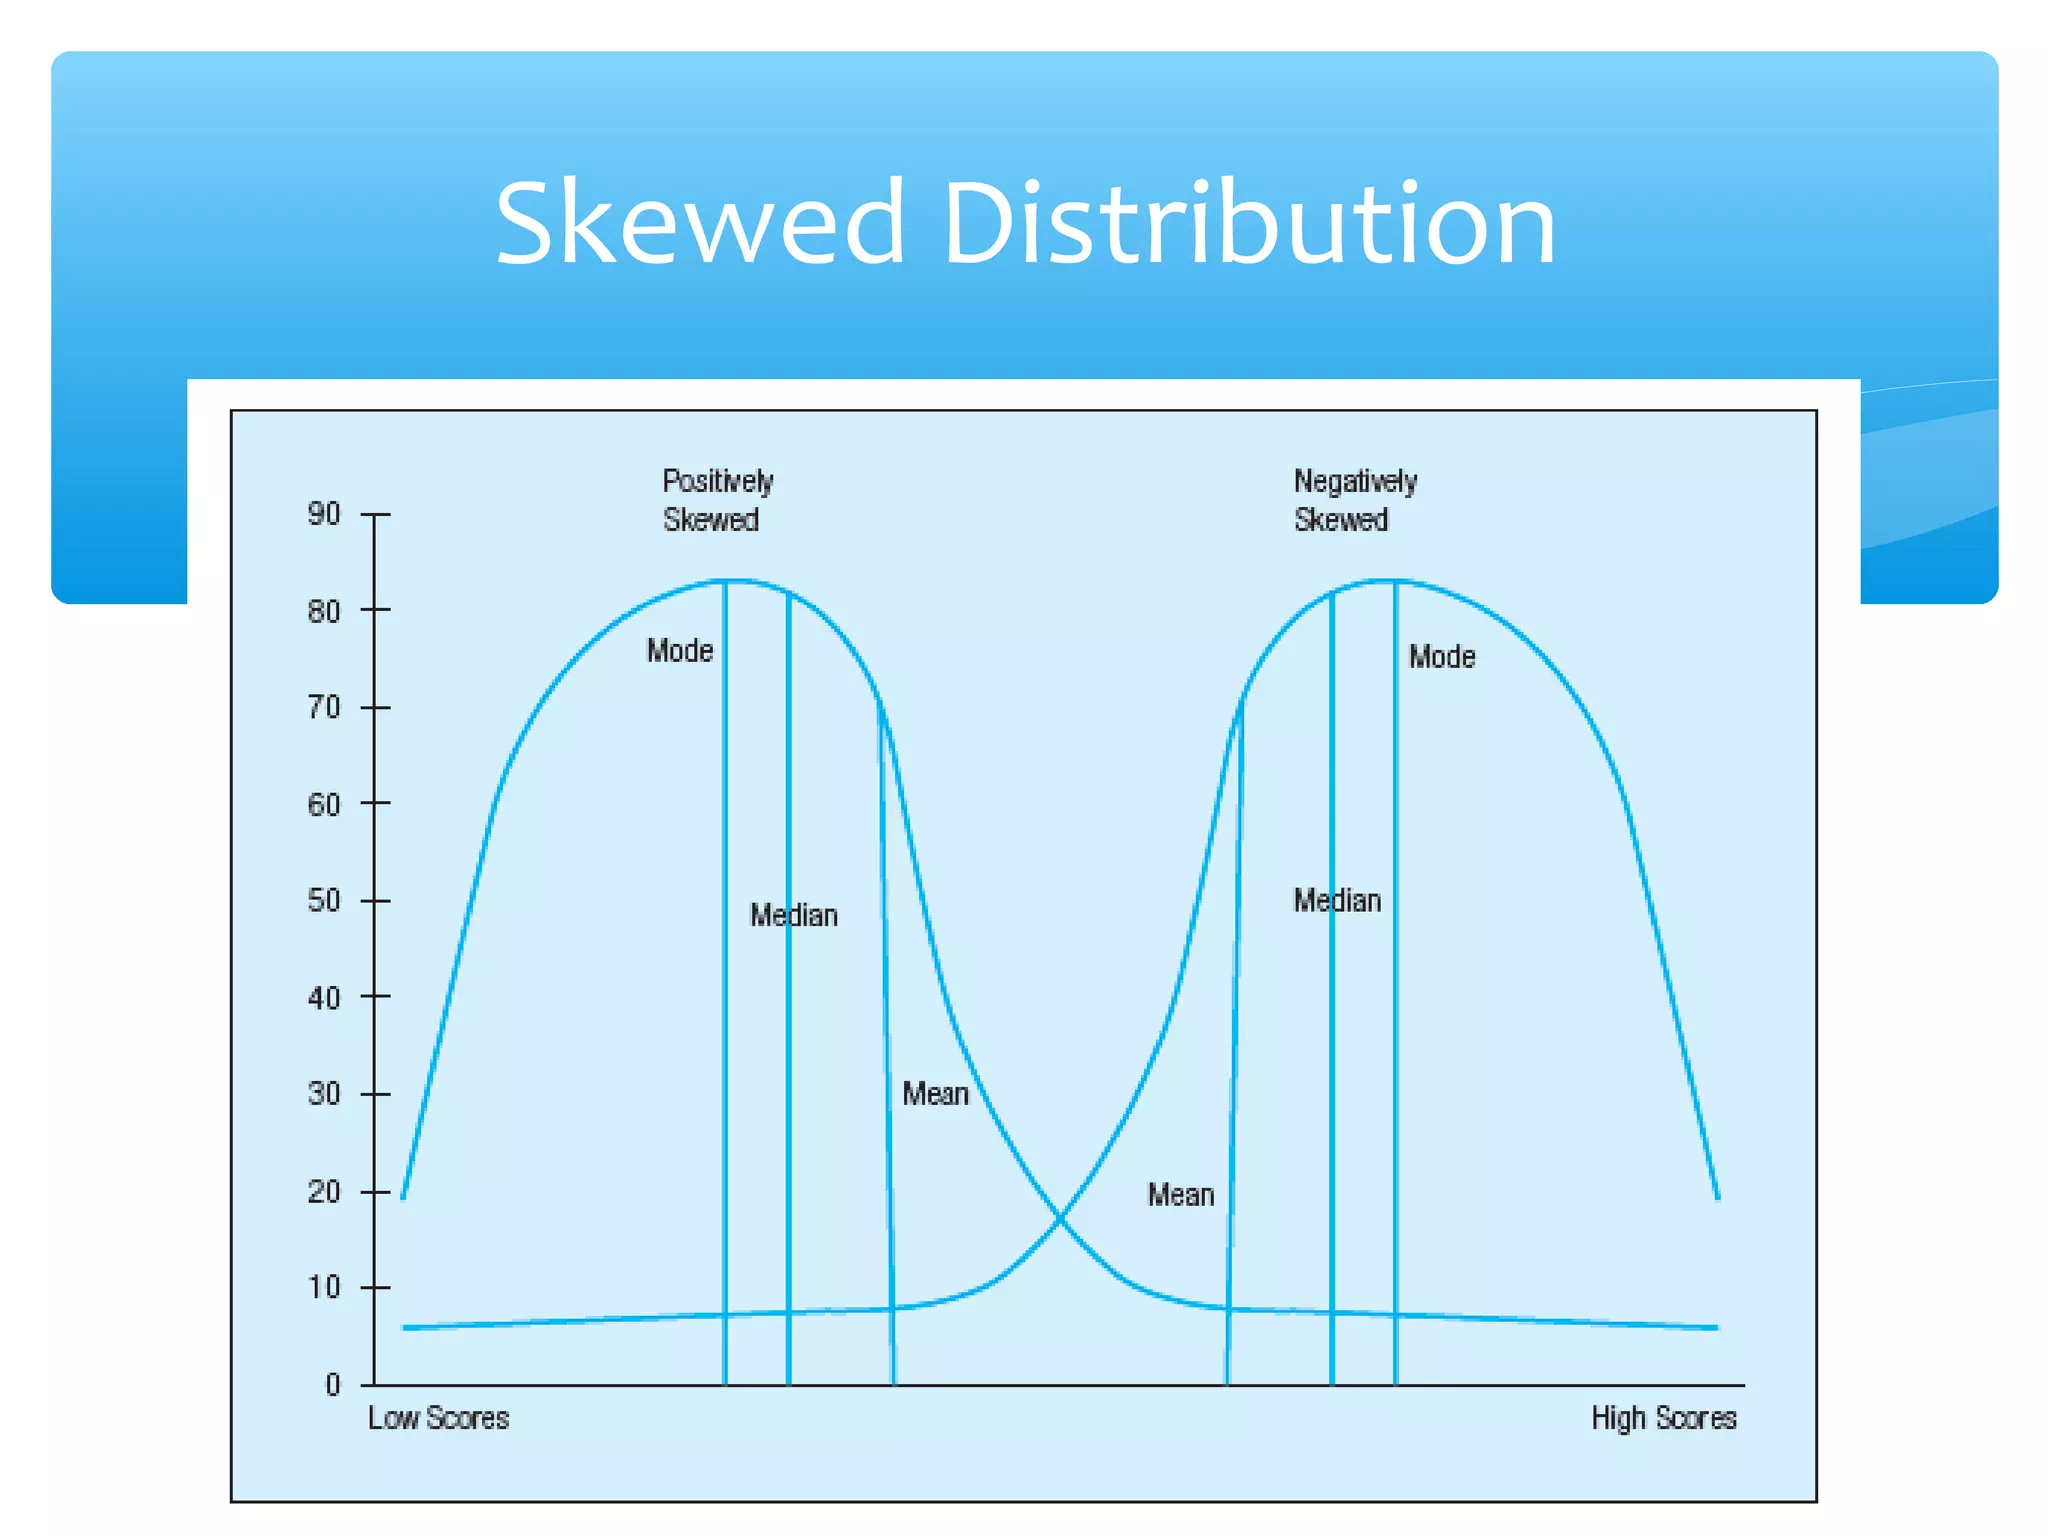
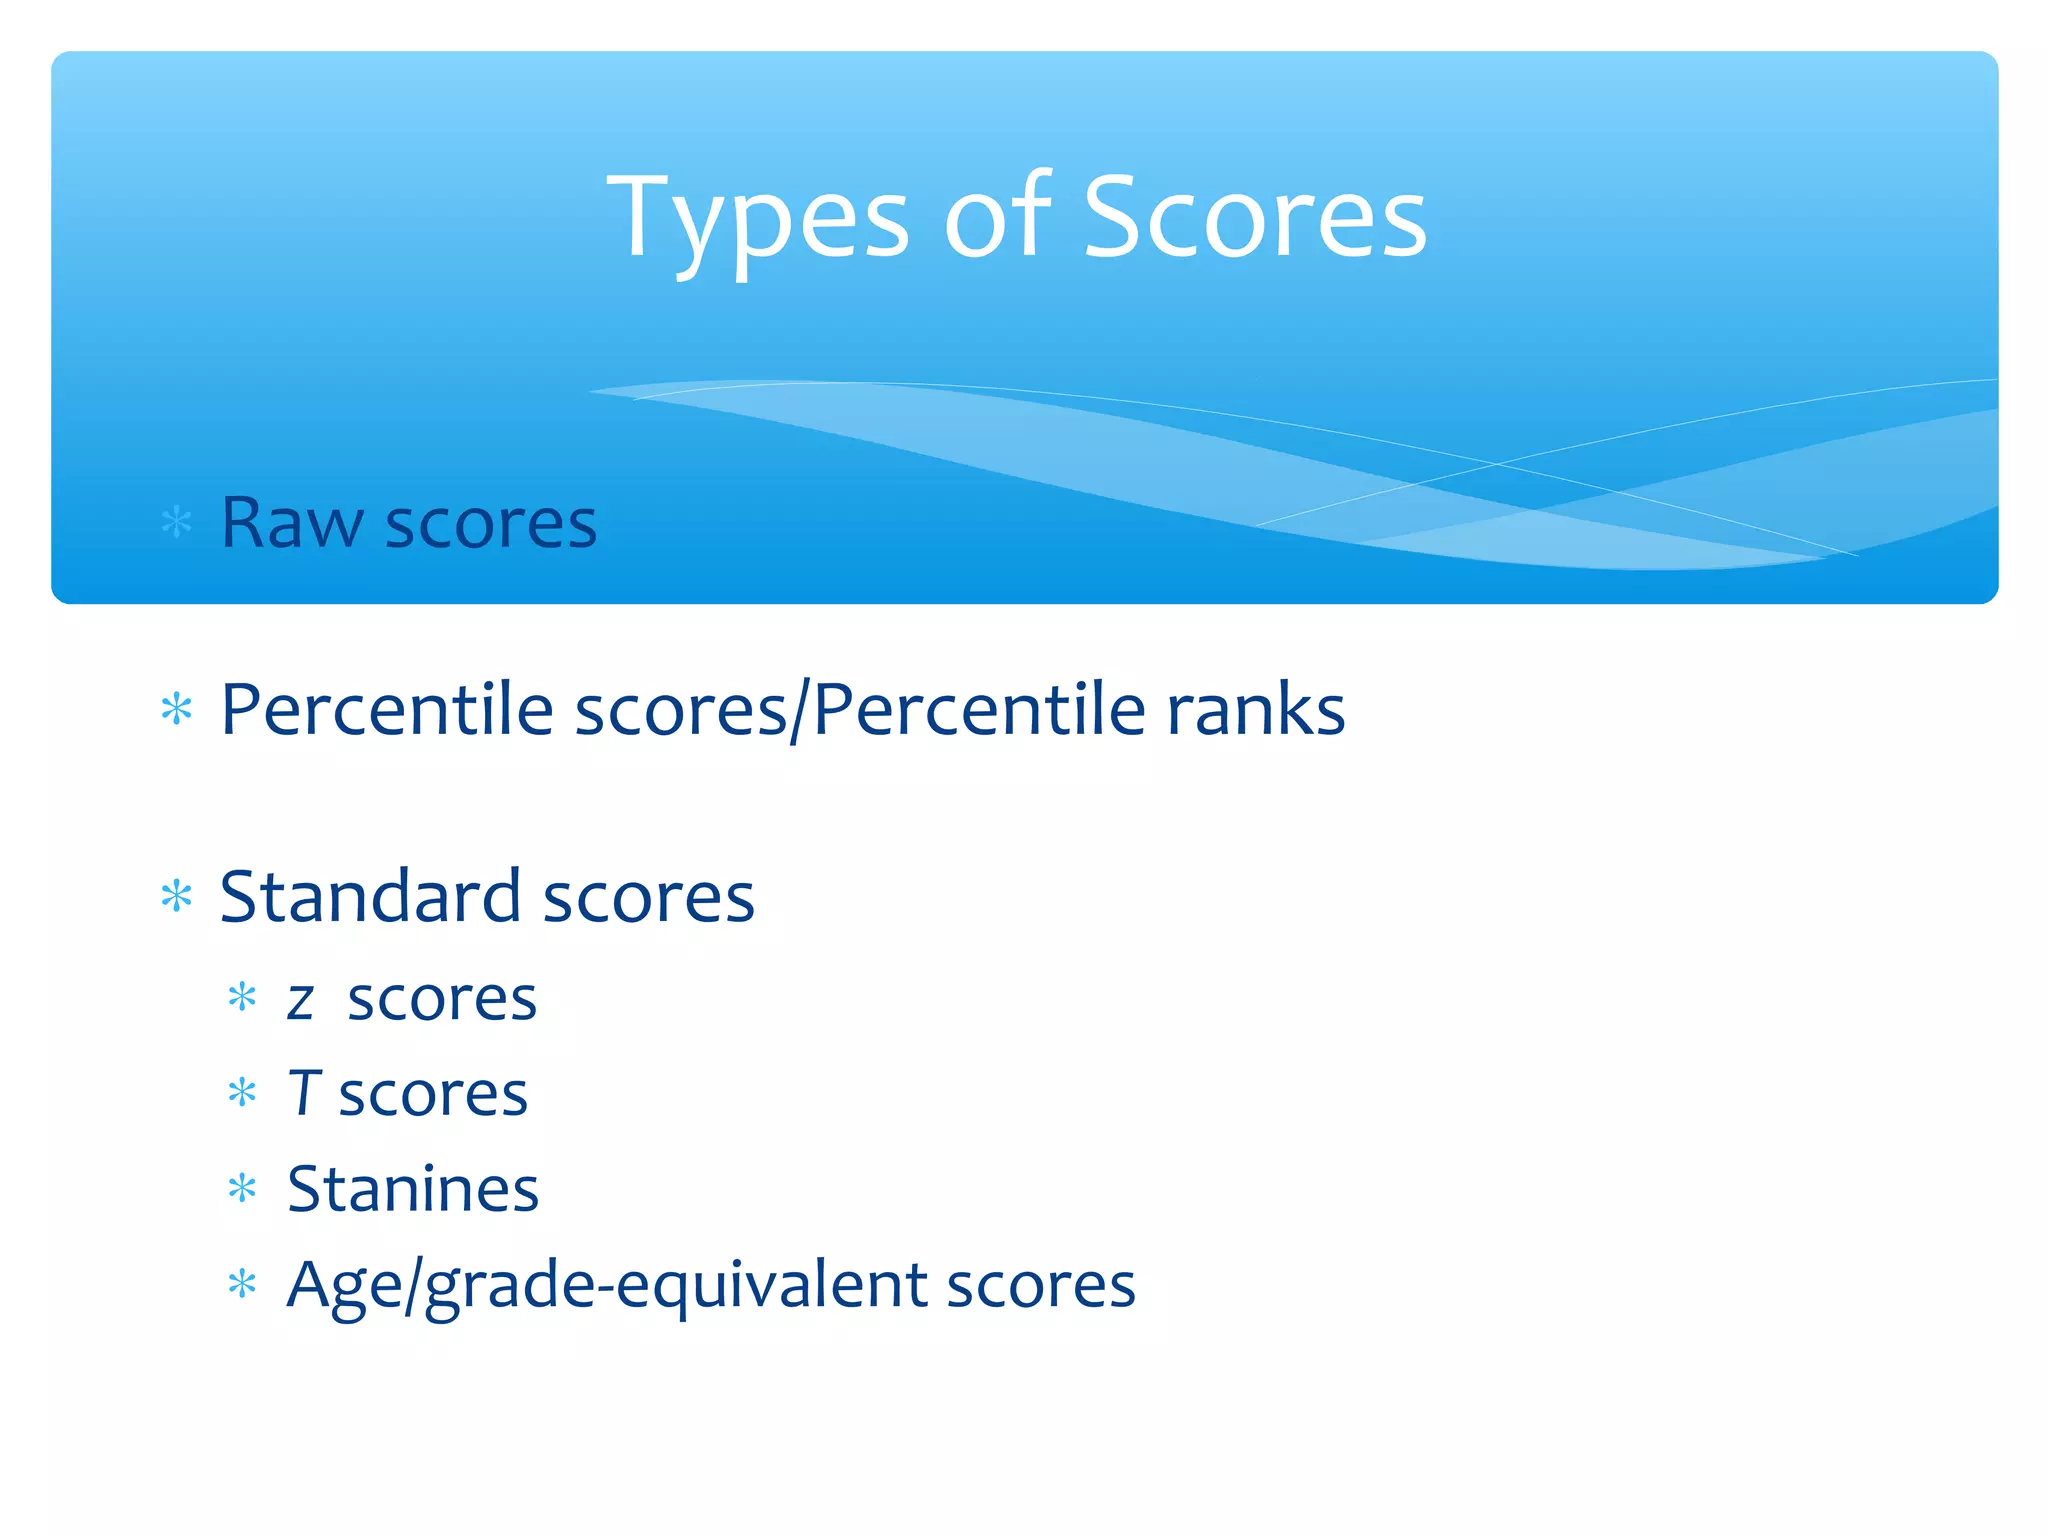
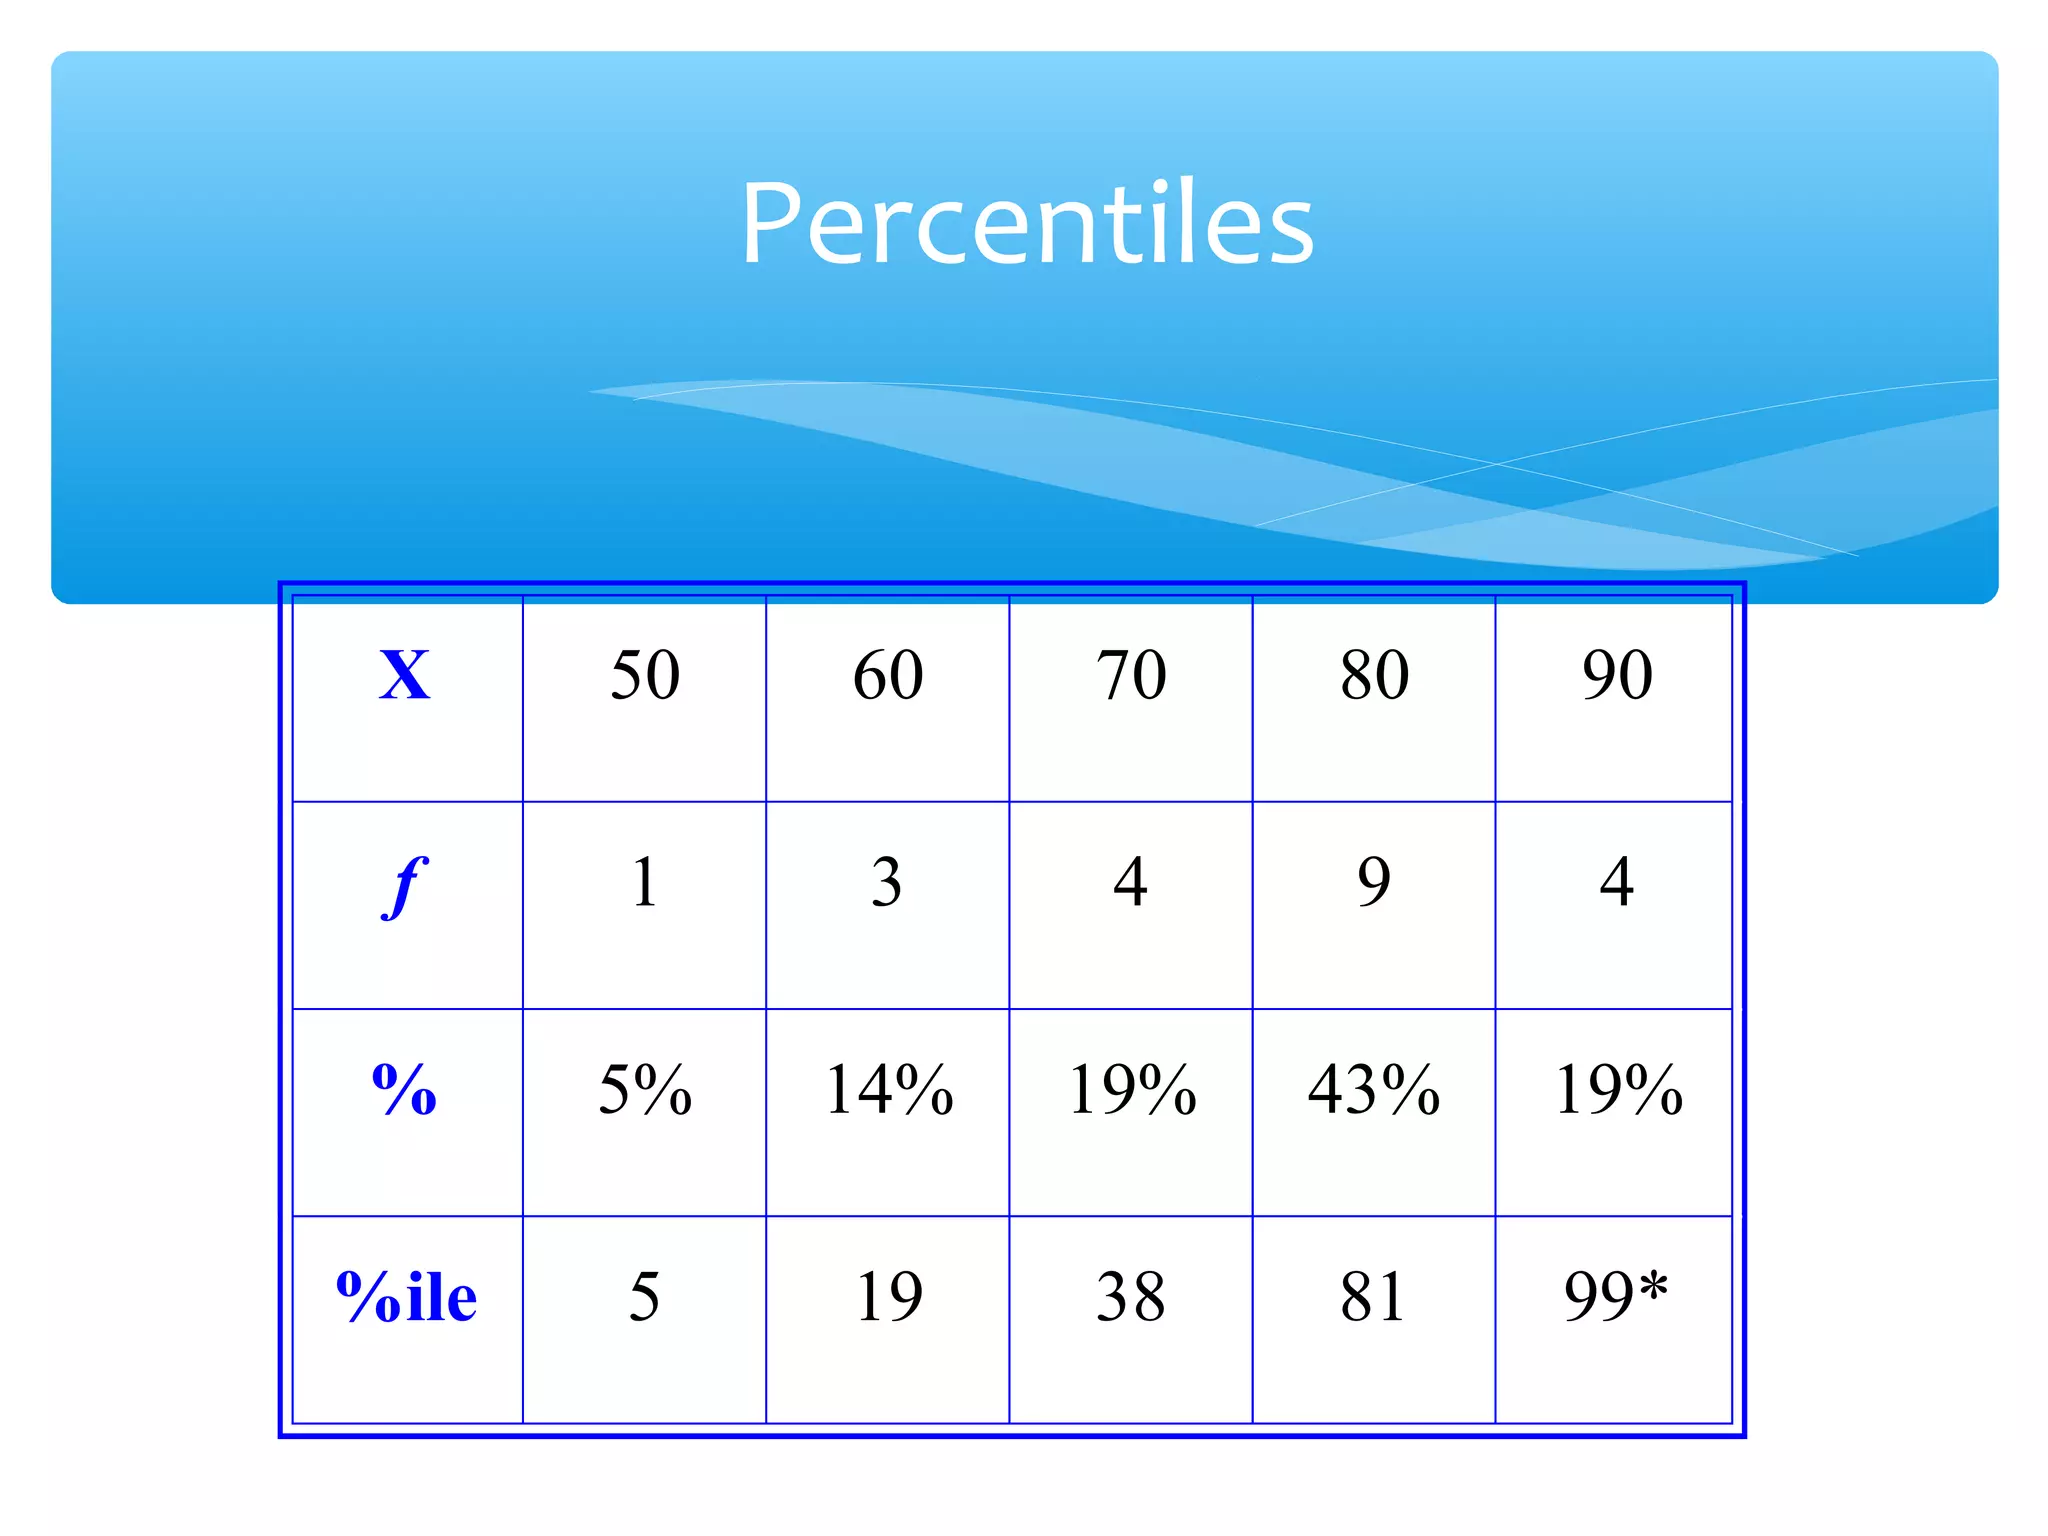
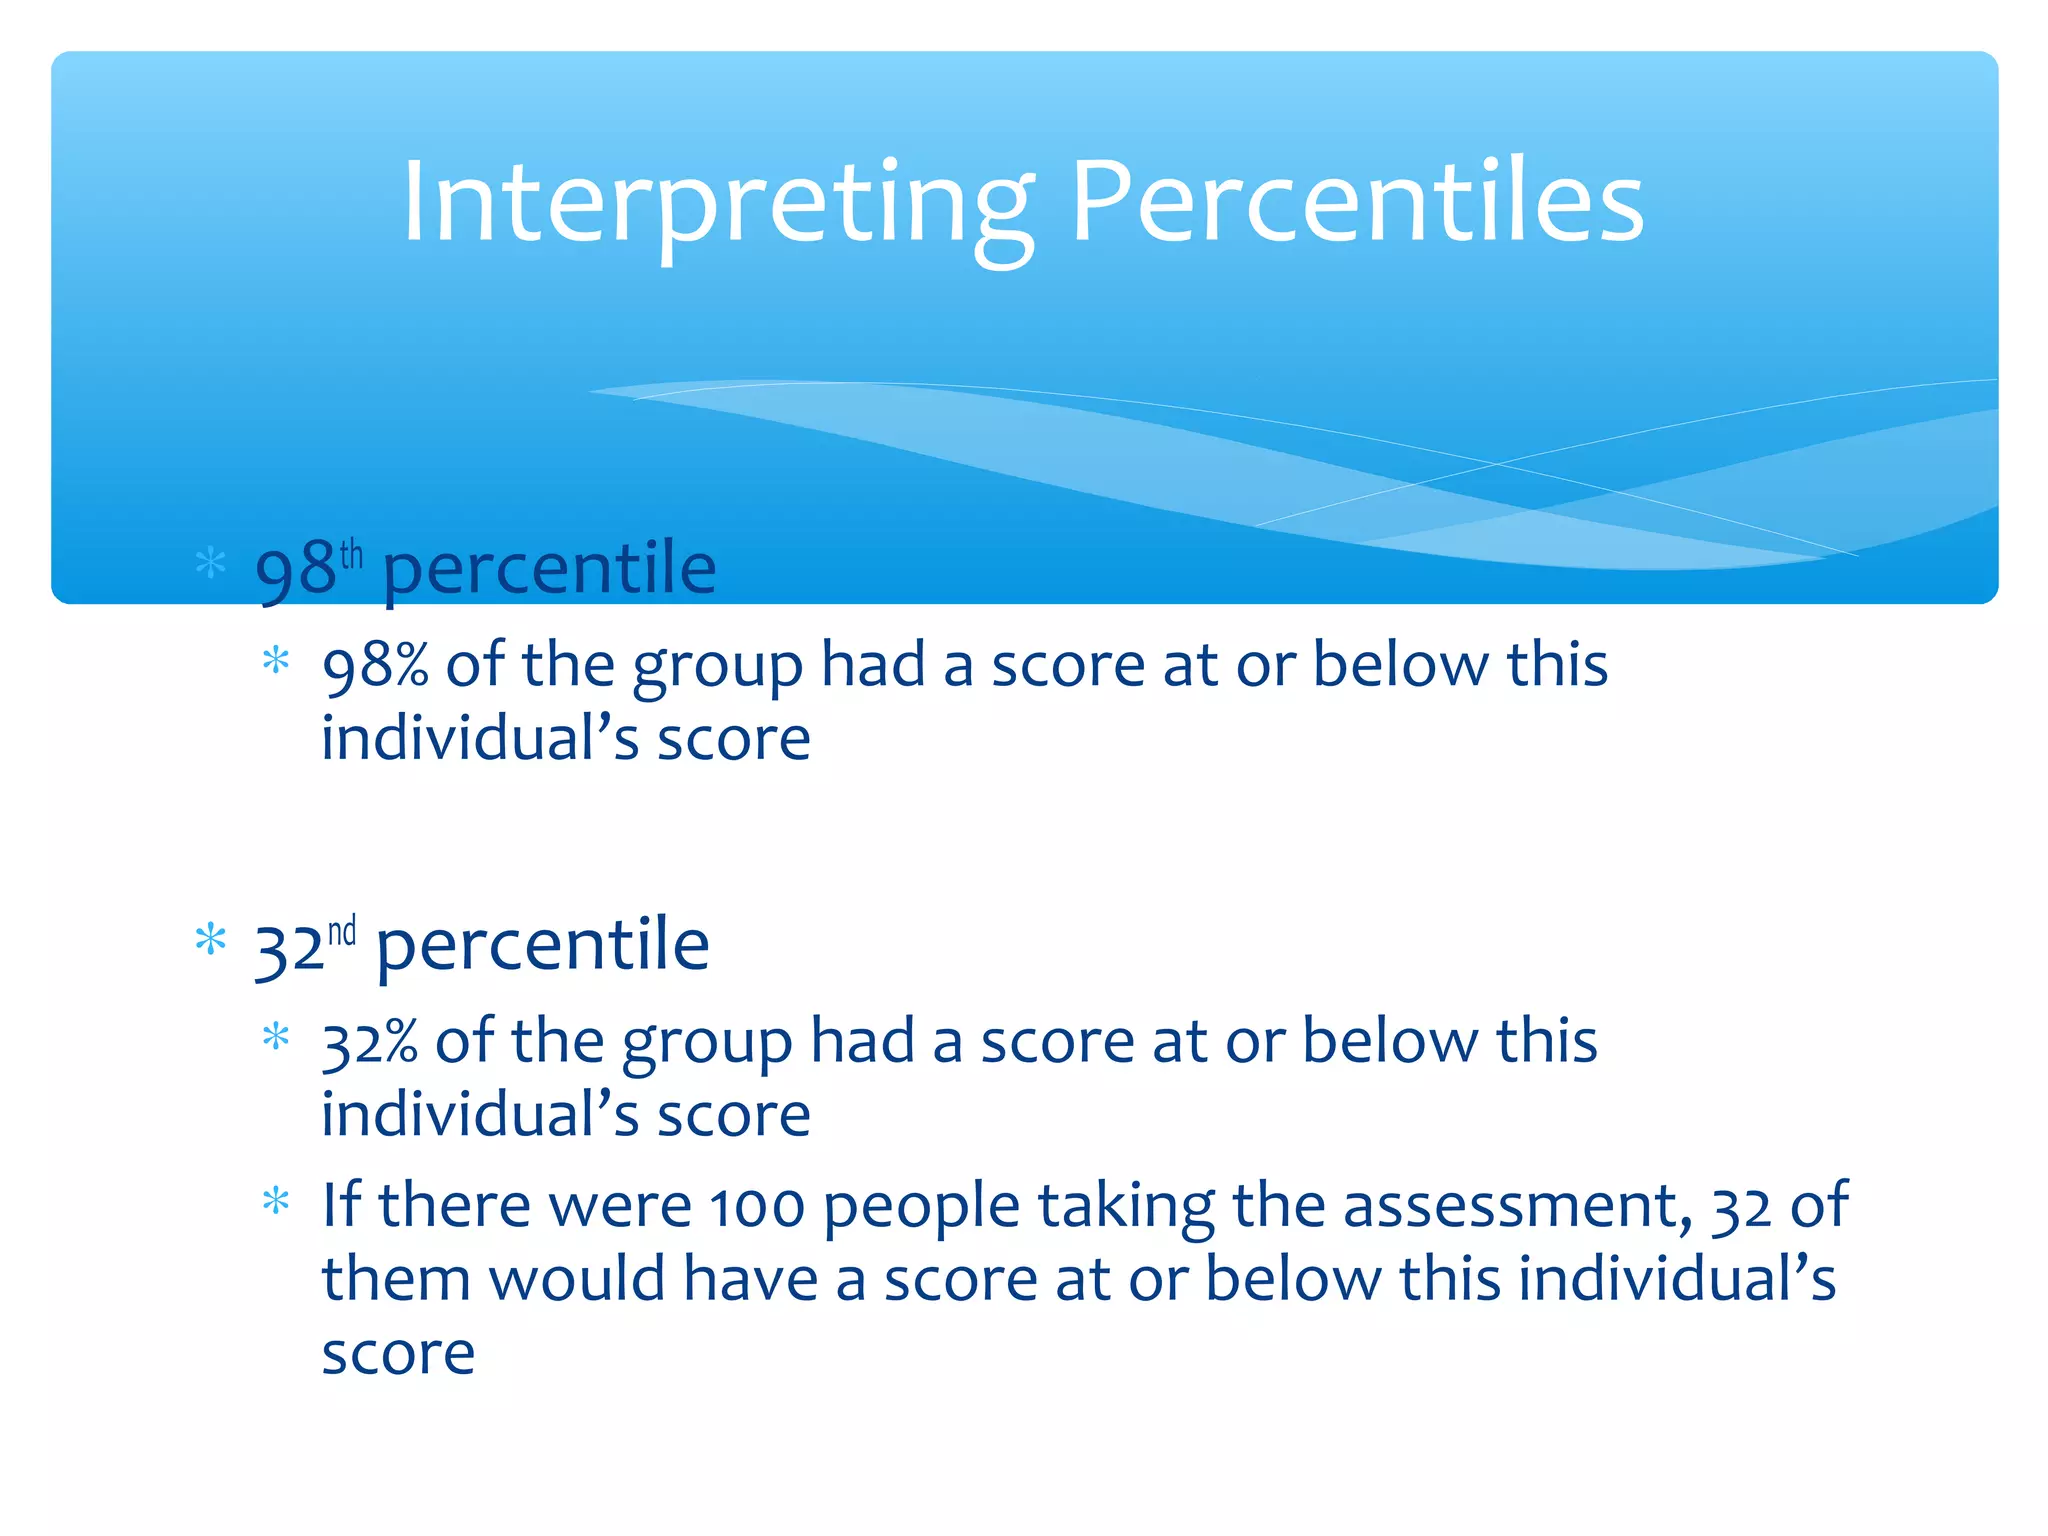
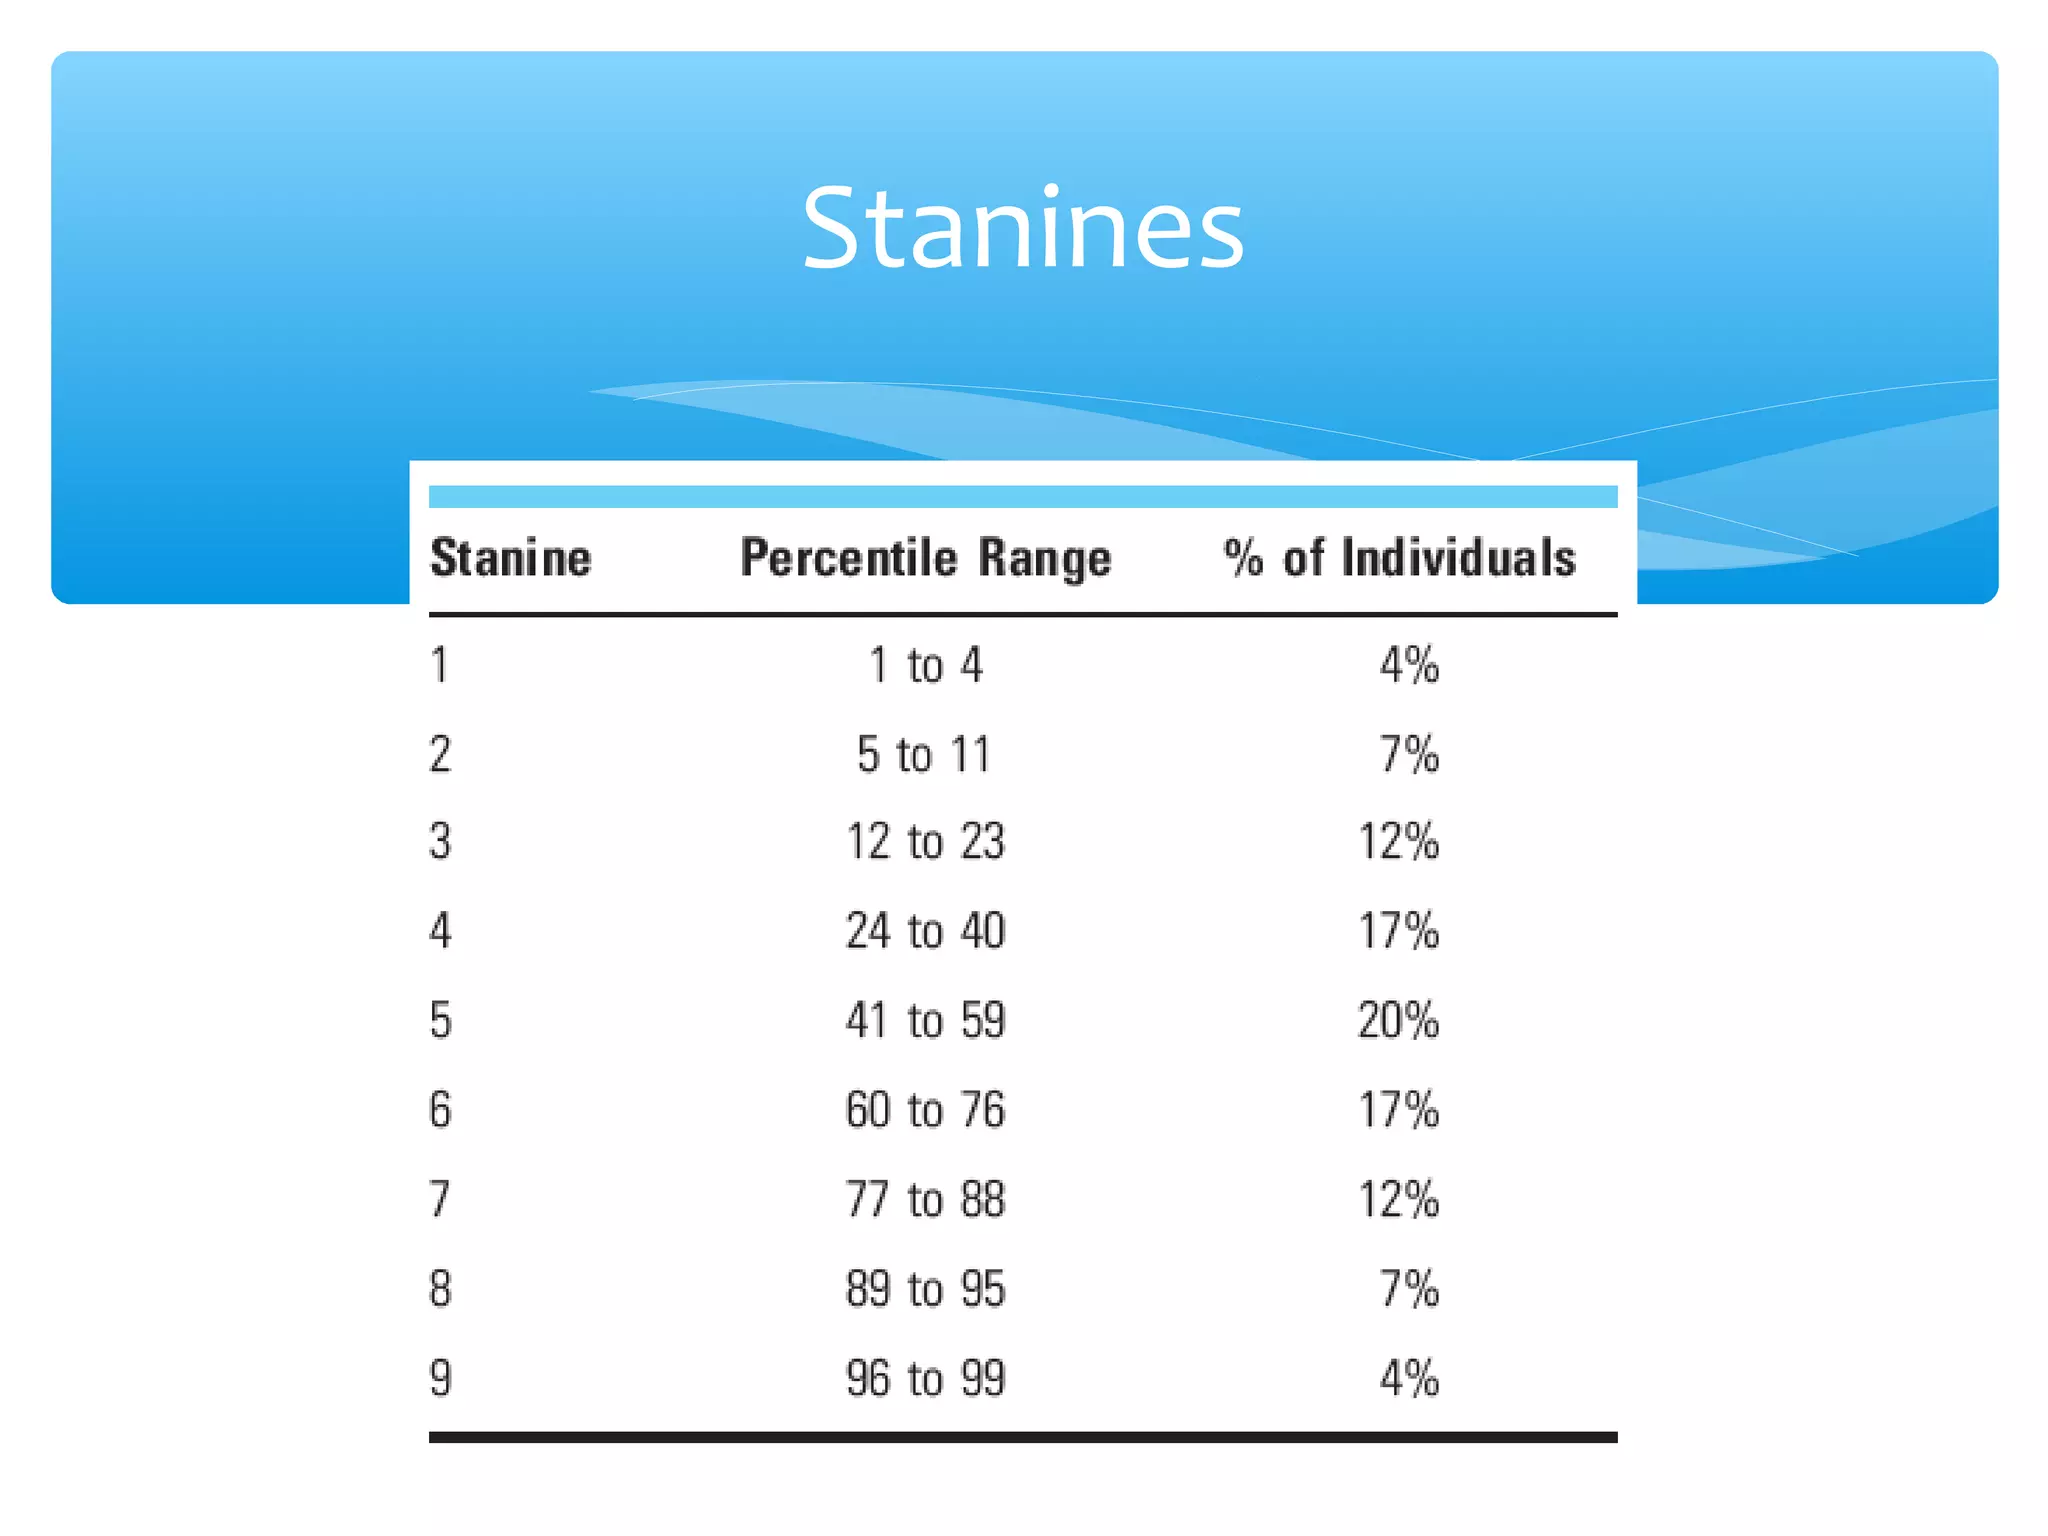
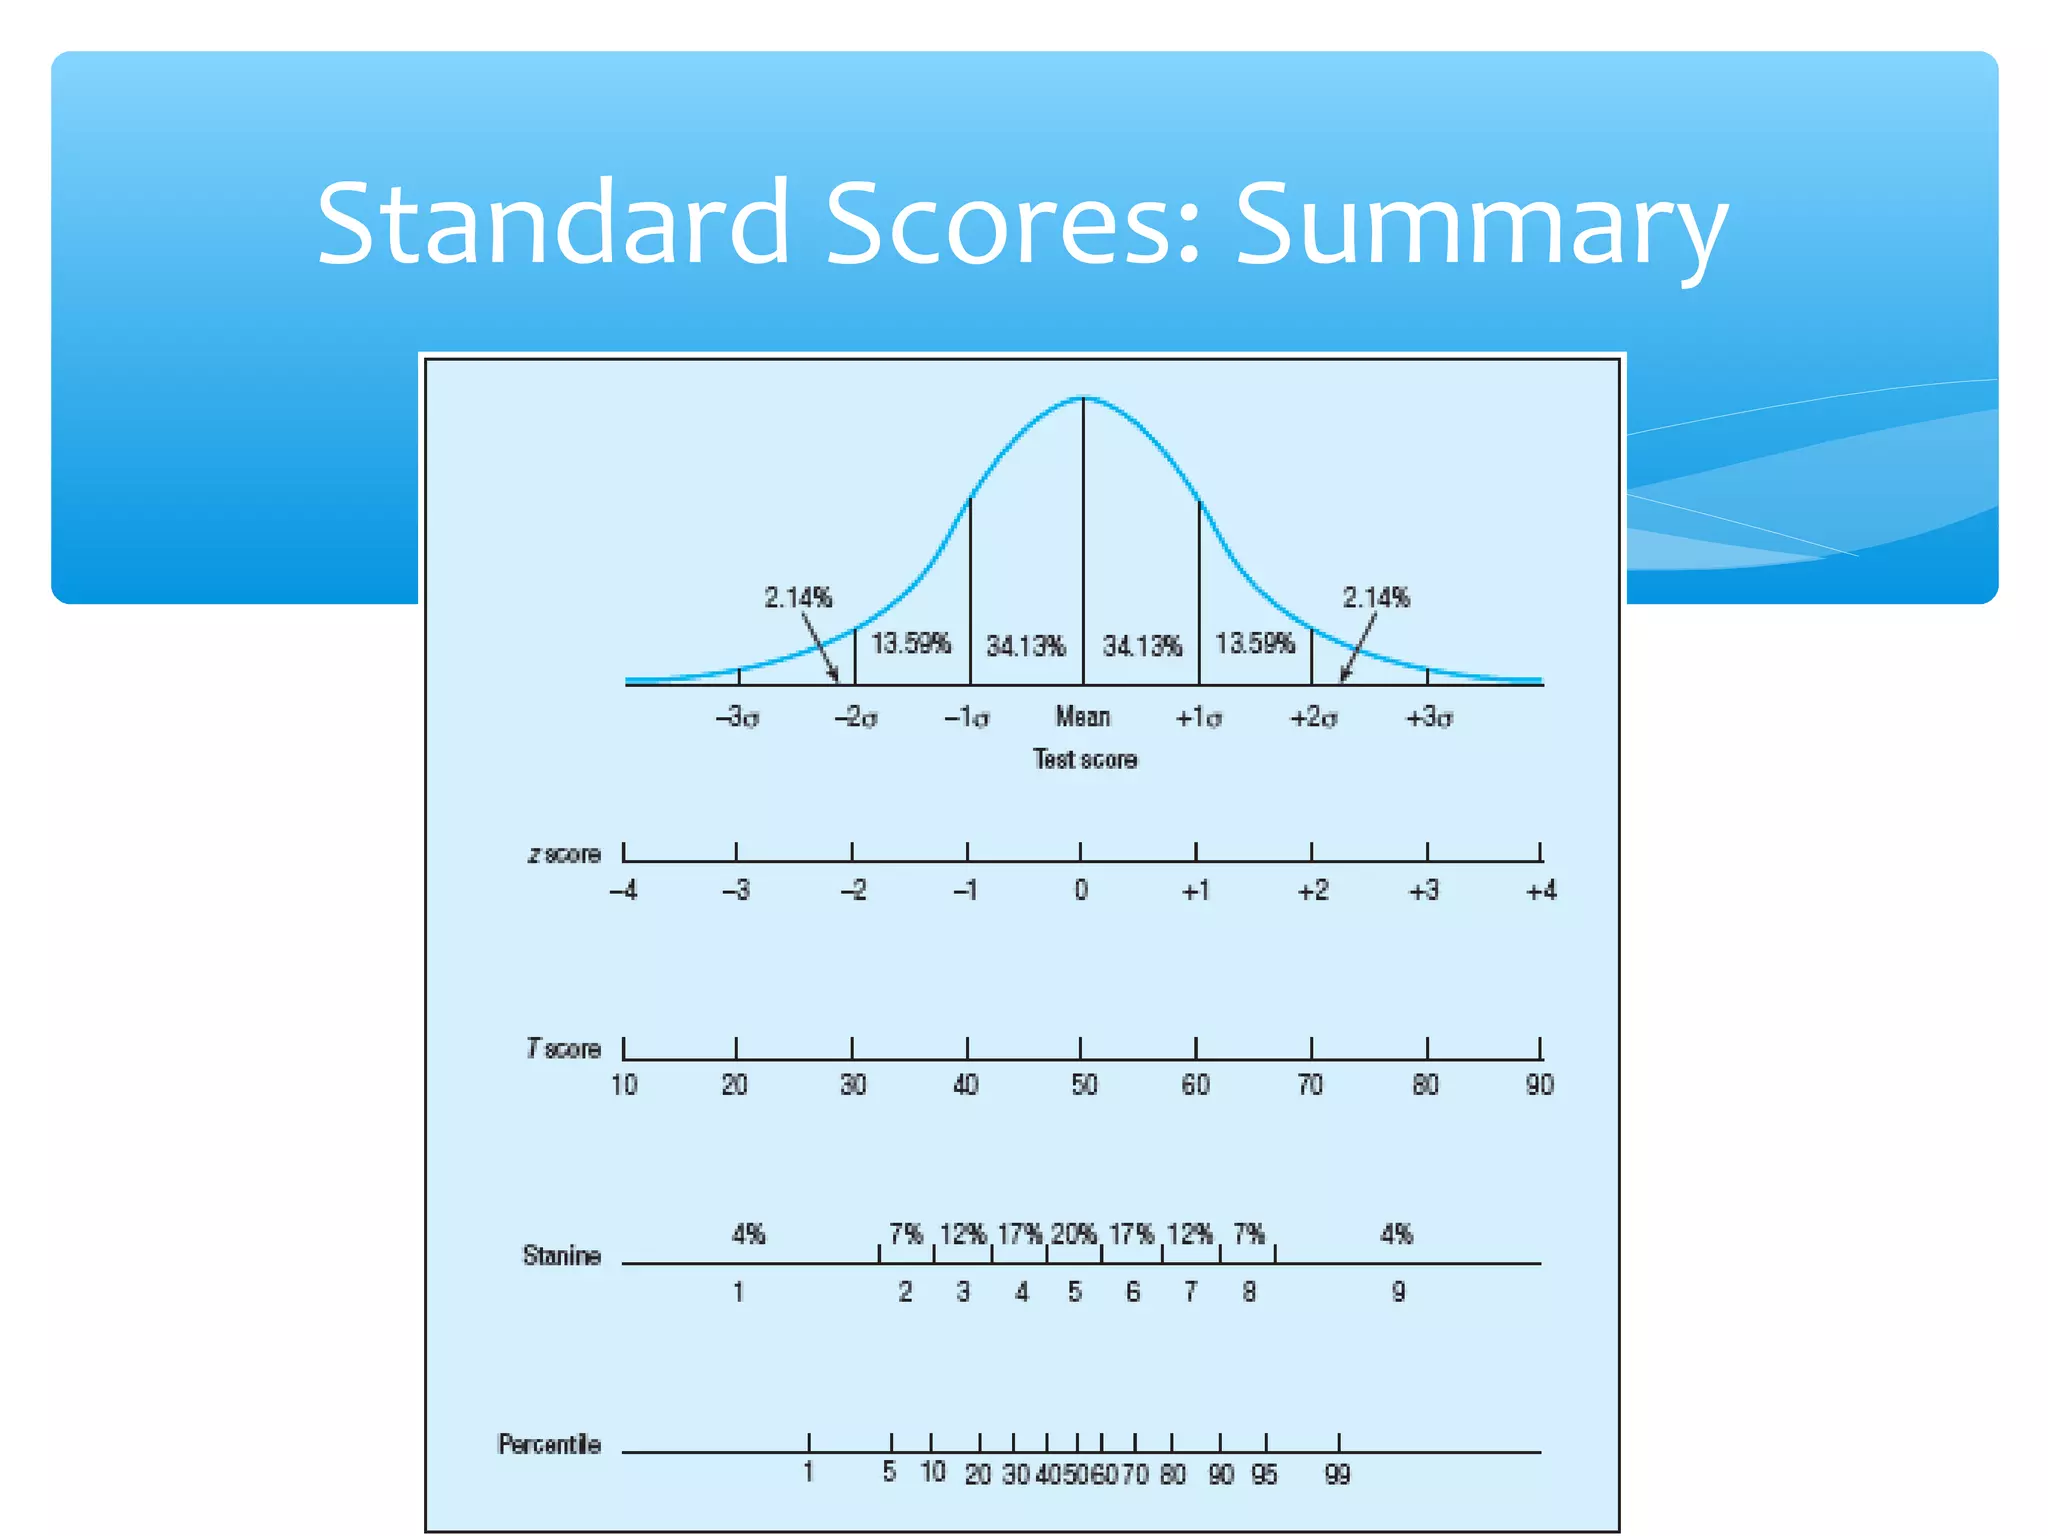

This document discusses key concepts in measurement scales and assessment instruments. It covers nominal, ordinal, interval, and ratio measurement scales. It describes norm-referenced instruments, which compare individuals to norms, and criterion-referenced instruments, which compare individuals to standards. It also discusses measures of central tendency like mean, median, and mode. Finally, it covers standard scores and different types of scores from assessments, as well as evaluating norming groups.


![Norms[1]](https://cdn.slidesharecdn.com/ss_thumbnails/norms1-110821093015-phpapp01-thumbnail.jpg?width=640&height=640&fit=bounds)


