Downloaded 11 times
![Formulae
For Group Data:
1. S.D( )= [ ∑f(x - x )2/N ]1/2 where N=Sum of frequency
Shortcut Method:
2. =h/N [N∑fu2 –(∑f.u)2 ]1/2 u=x-A/h
3. =[∑(x-x)2/n]1/2 n=no. of observation
](https://image.slidesharecdn.com/standarddeviation-141204213045-conversion-gate02/75/Standard-deviation-3-2048.jpg)
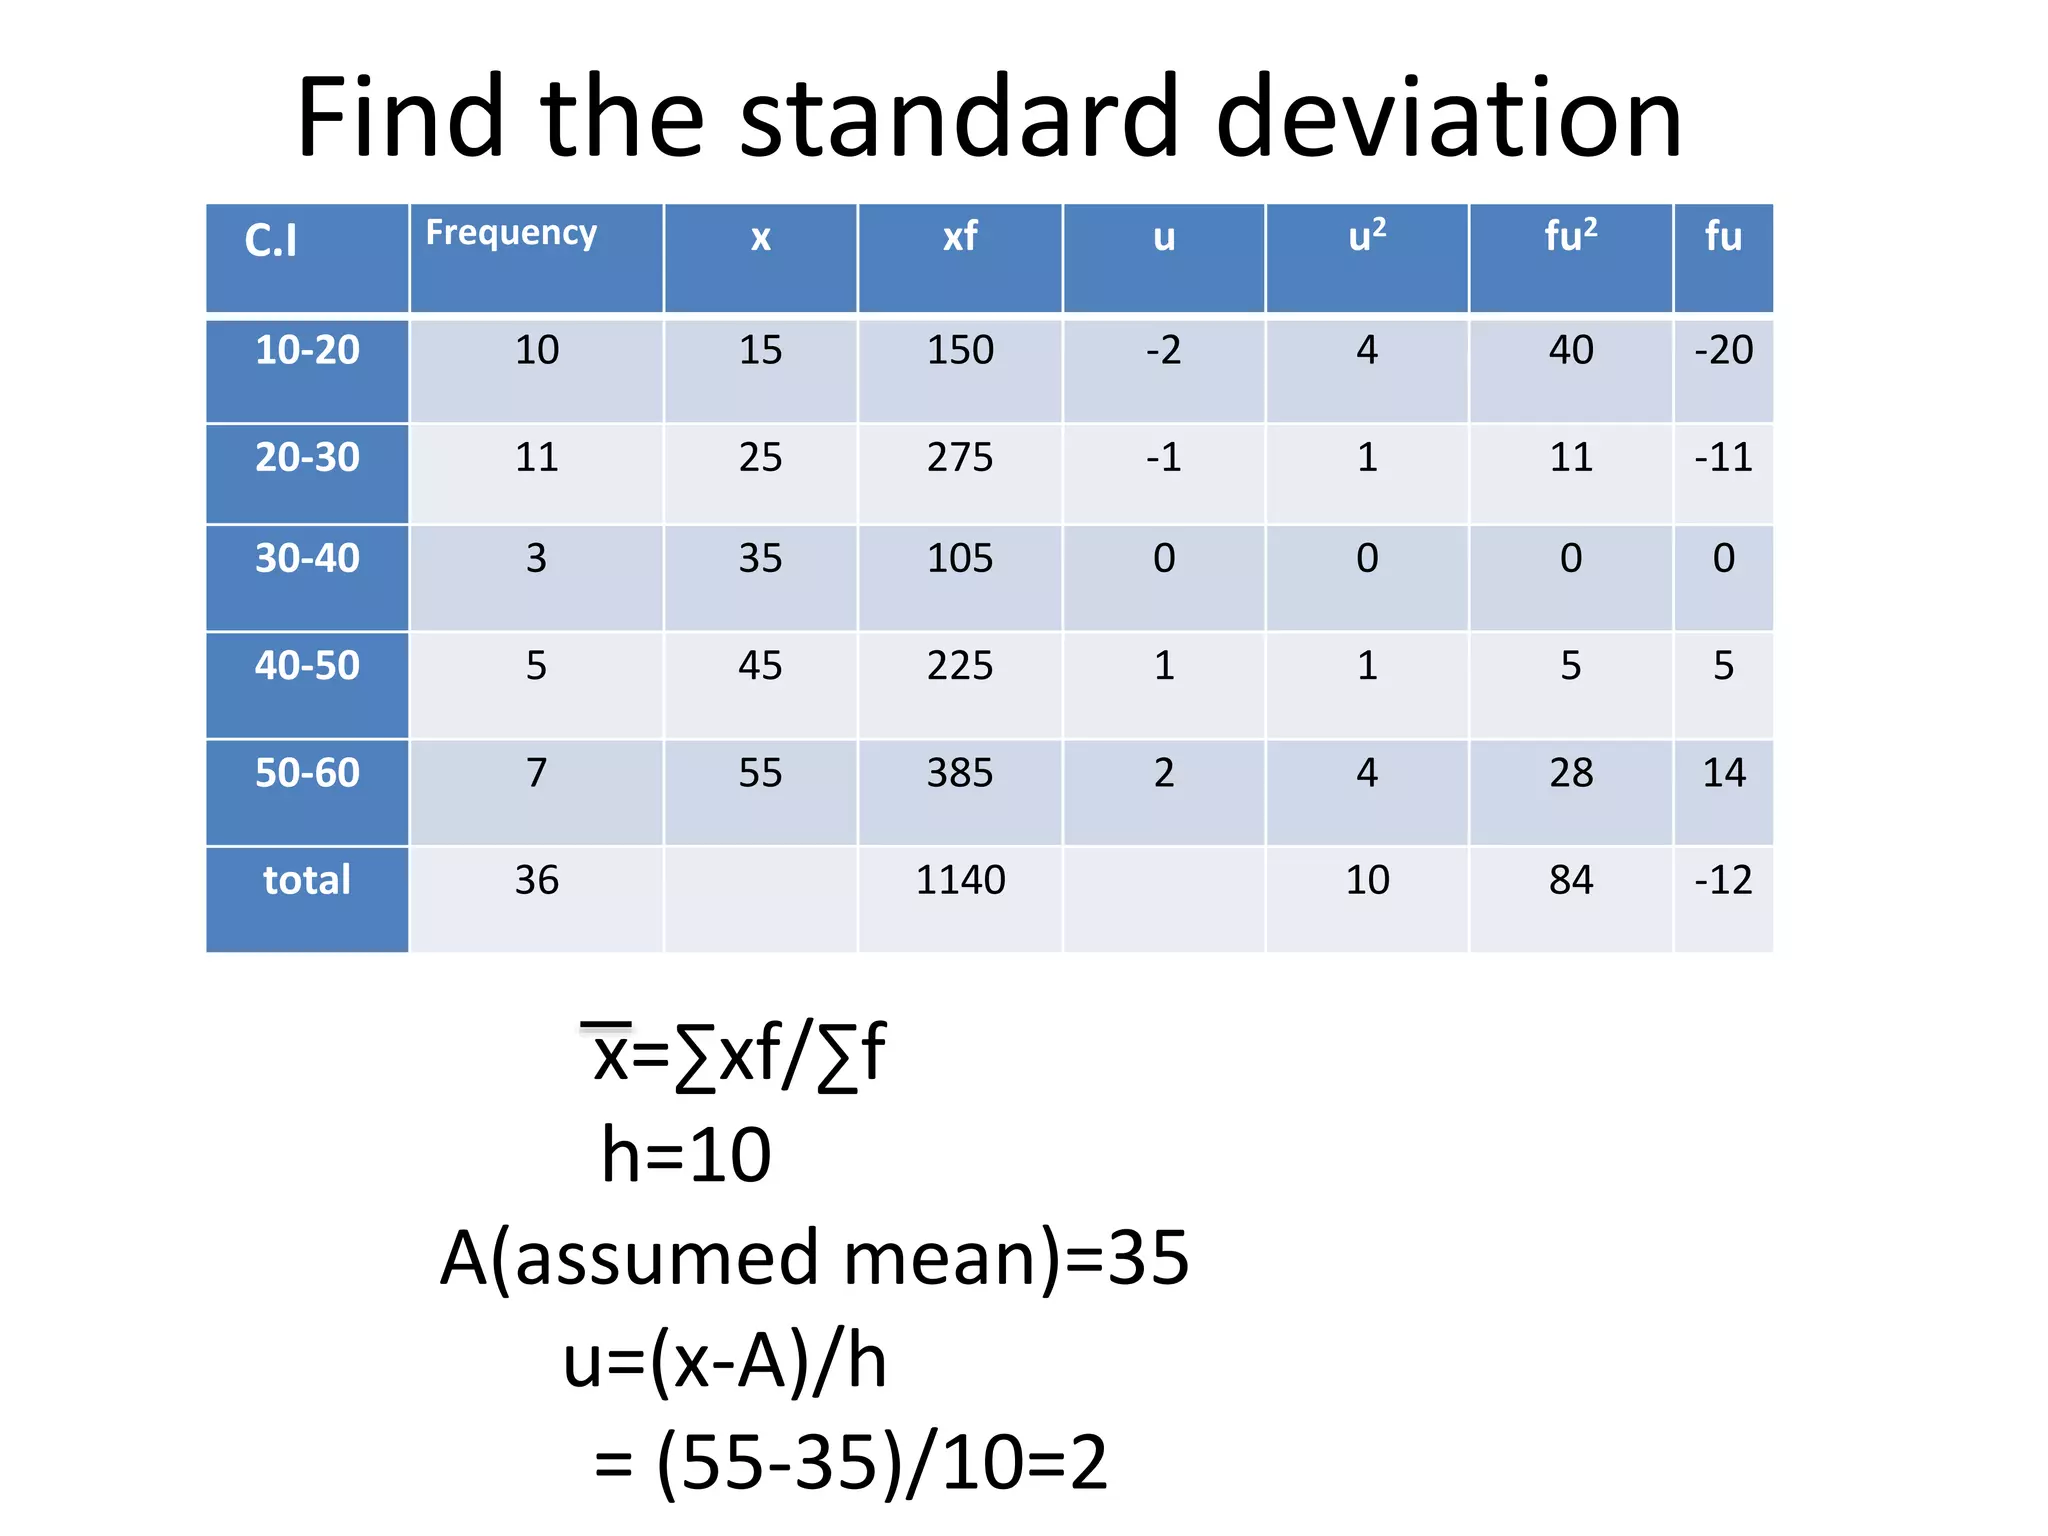
![=10/36[36(84)-144]1/2
=10/36[3024-144]1/2
=10/36[2880]1/2
=10/36*53.66=14.90
=h/N [N∑fu2 –(∑f.u)2 ]1/2](https://image.slidesharecdn.com/standarddeviation-141204213045-conversion-gate02/75/Standard-deviation-5-2048.jpg)


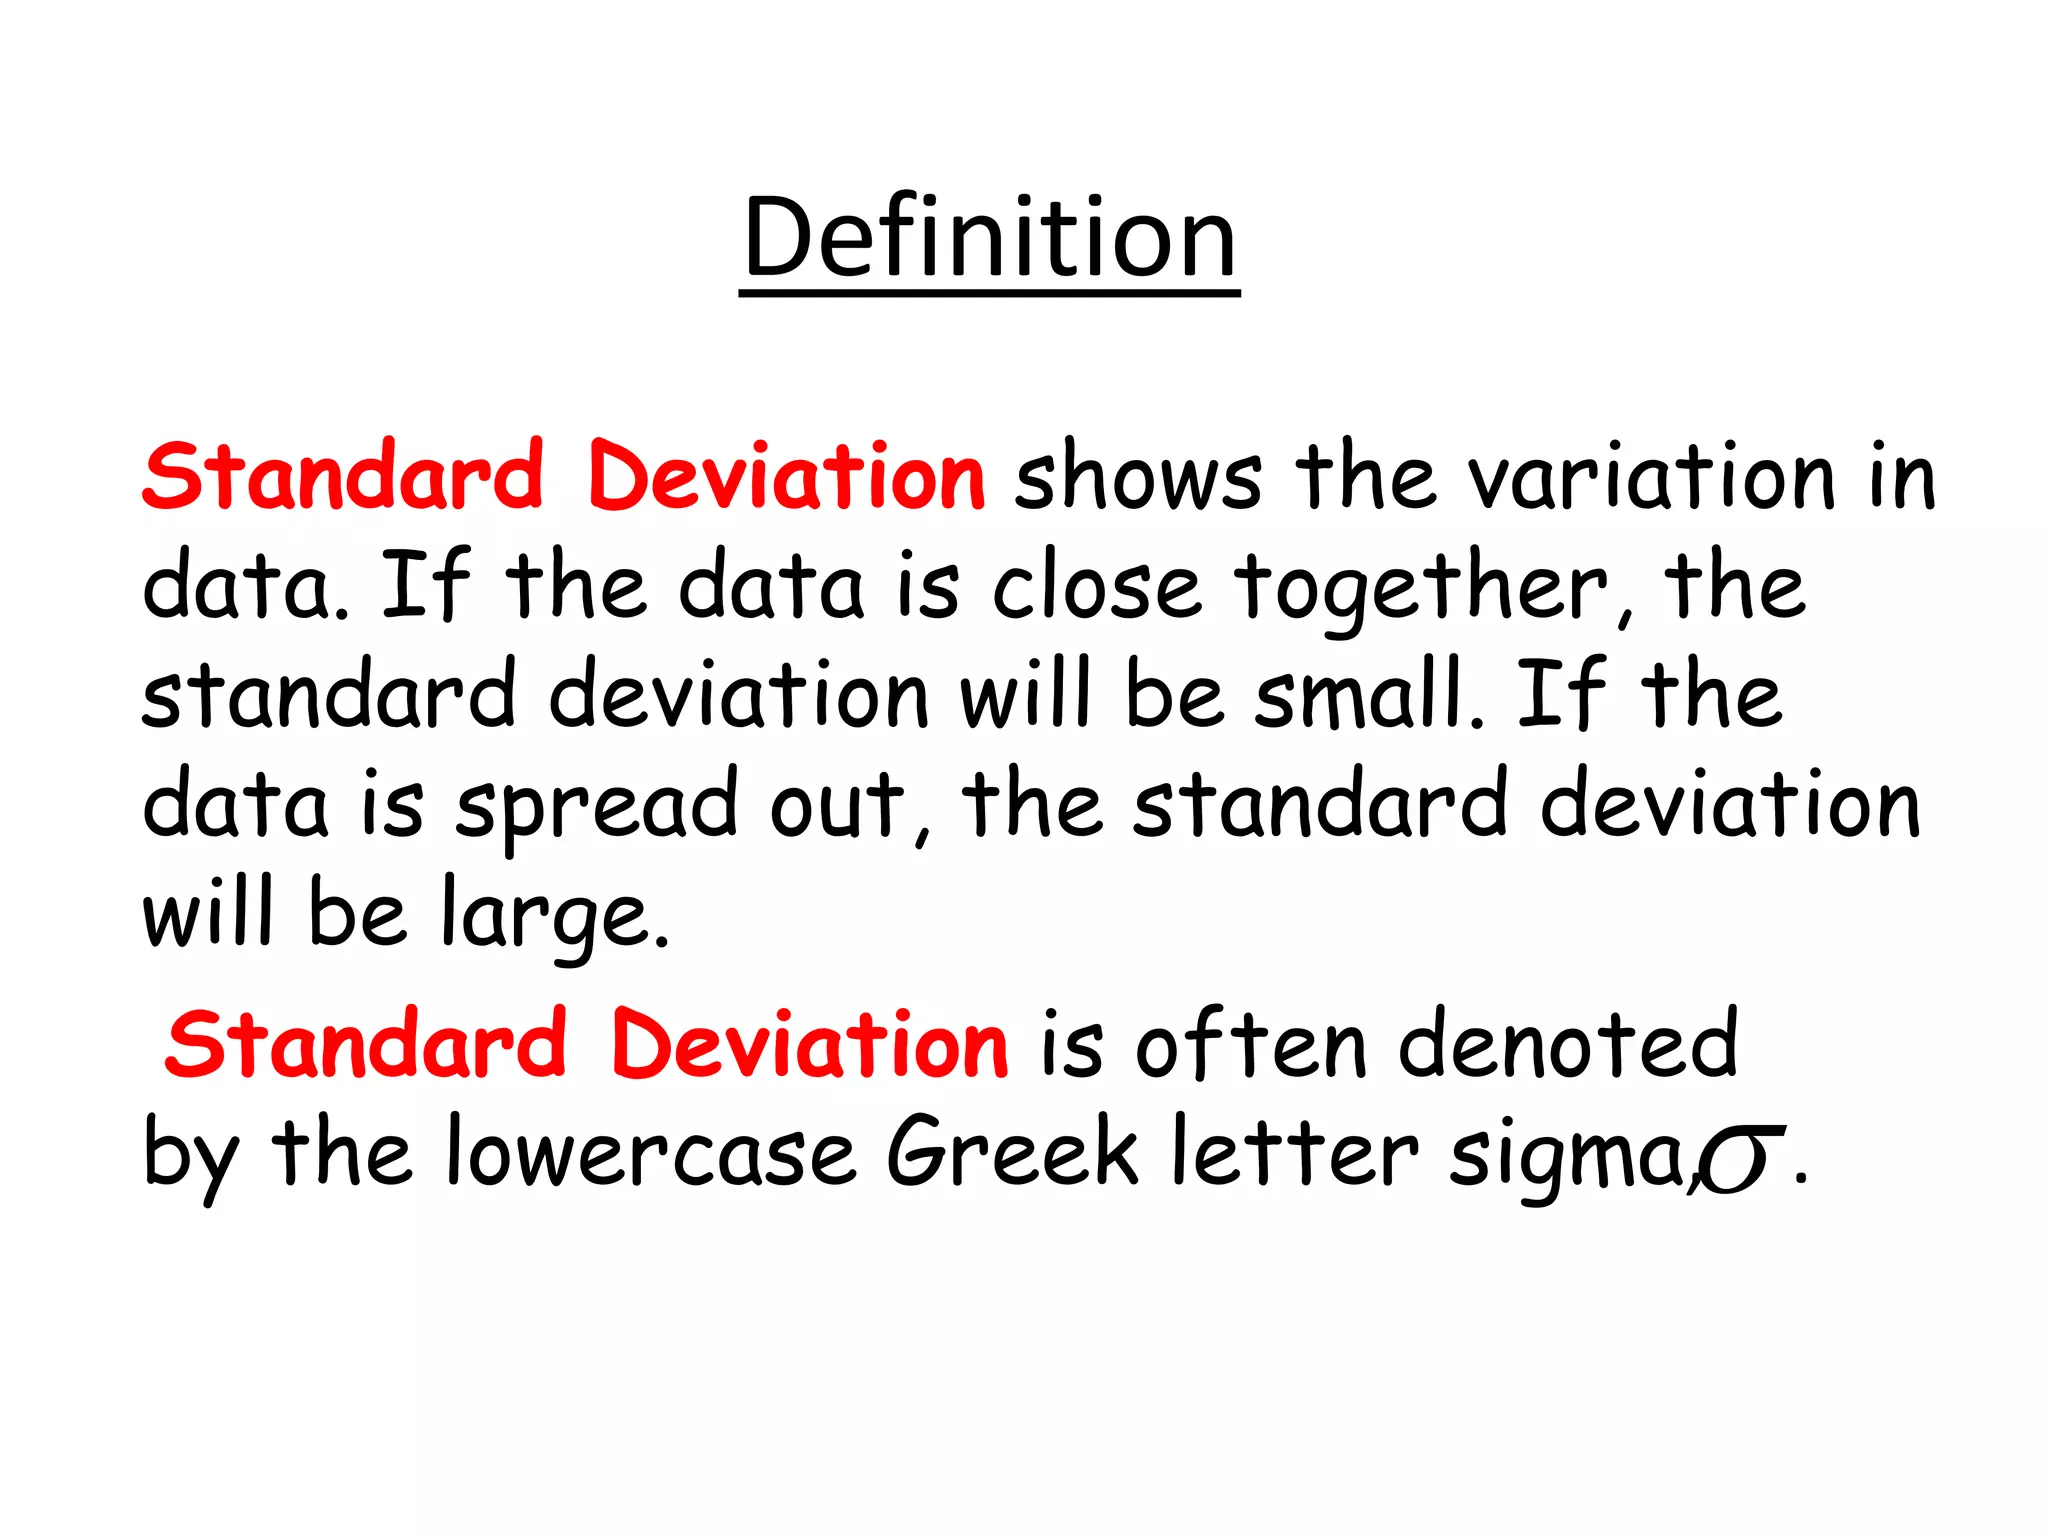
The document defines standard deviation and provides formulas to calculate it from group data. It gives an example of calculating the standard deviation of some sample data with frequency, class intervals, assumed mean, and deviations. The standard deviation is calculated to be 14.90 using the given formula.