Downloaded 235 times


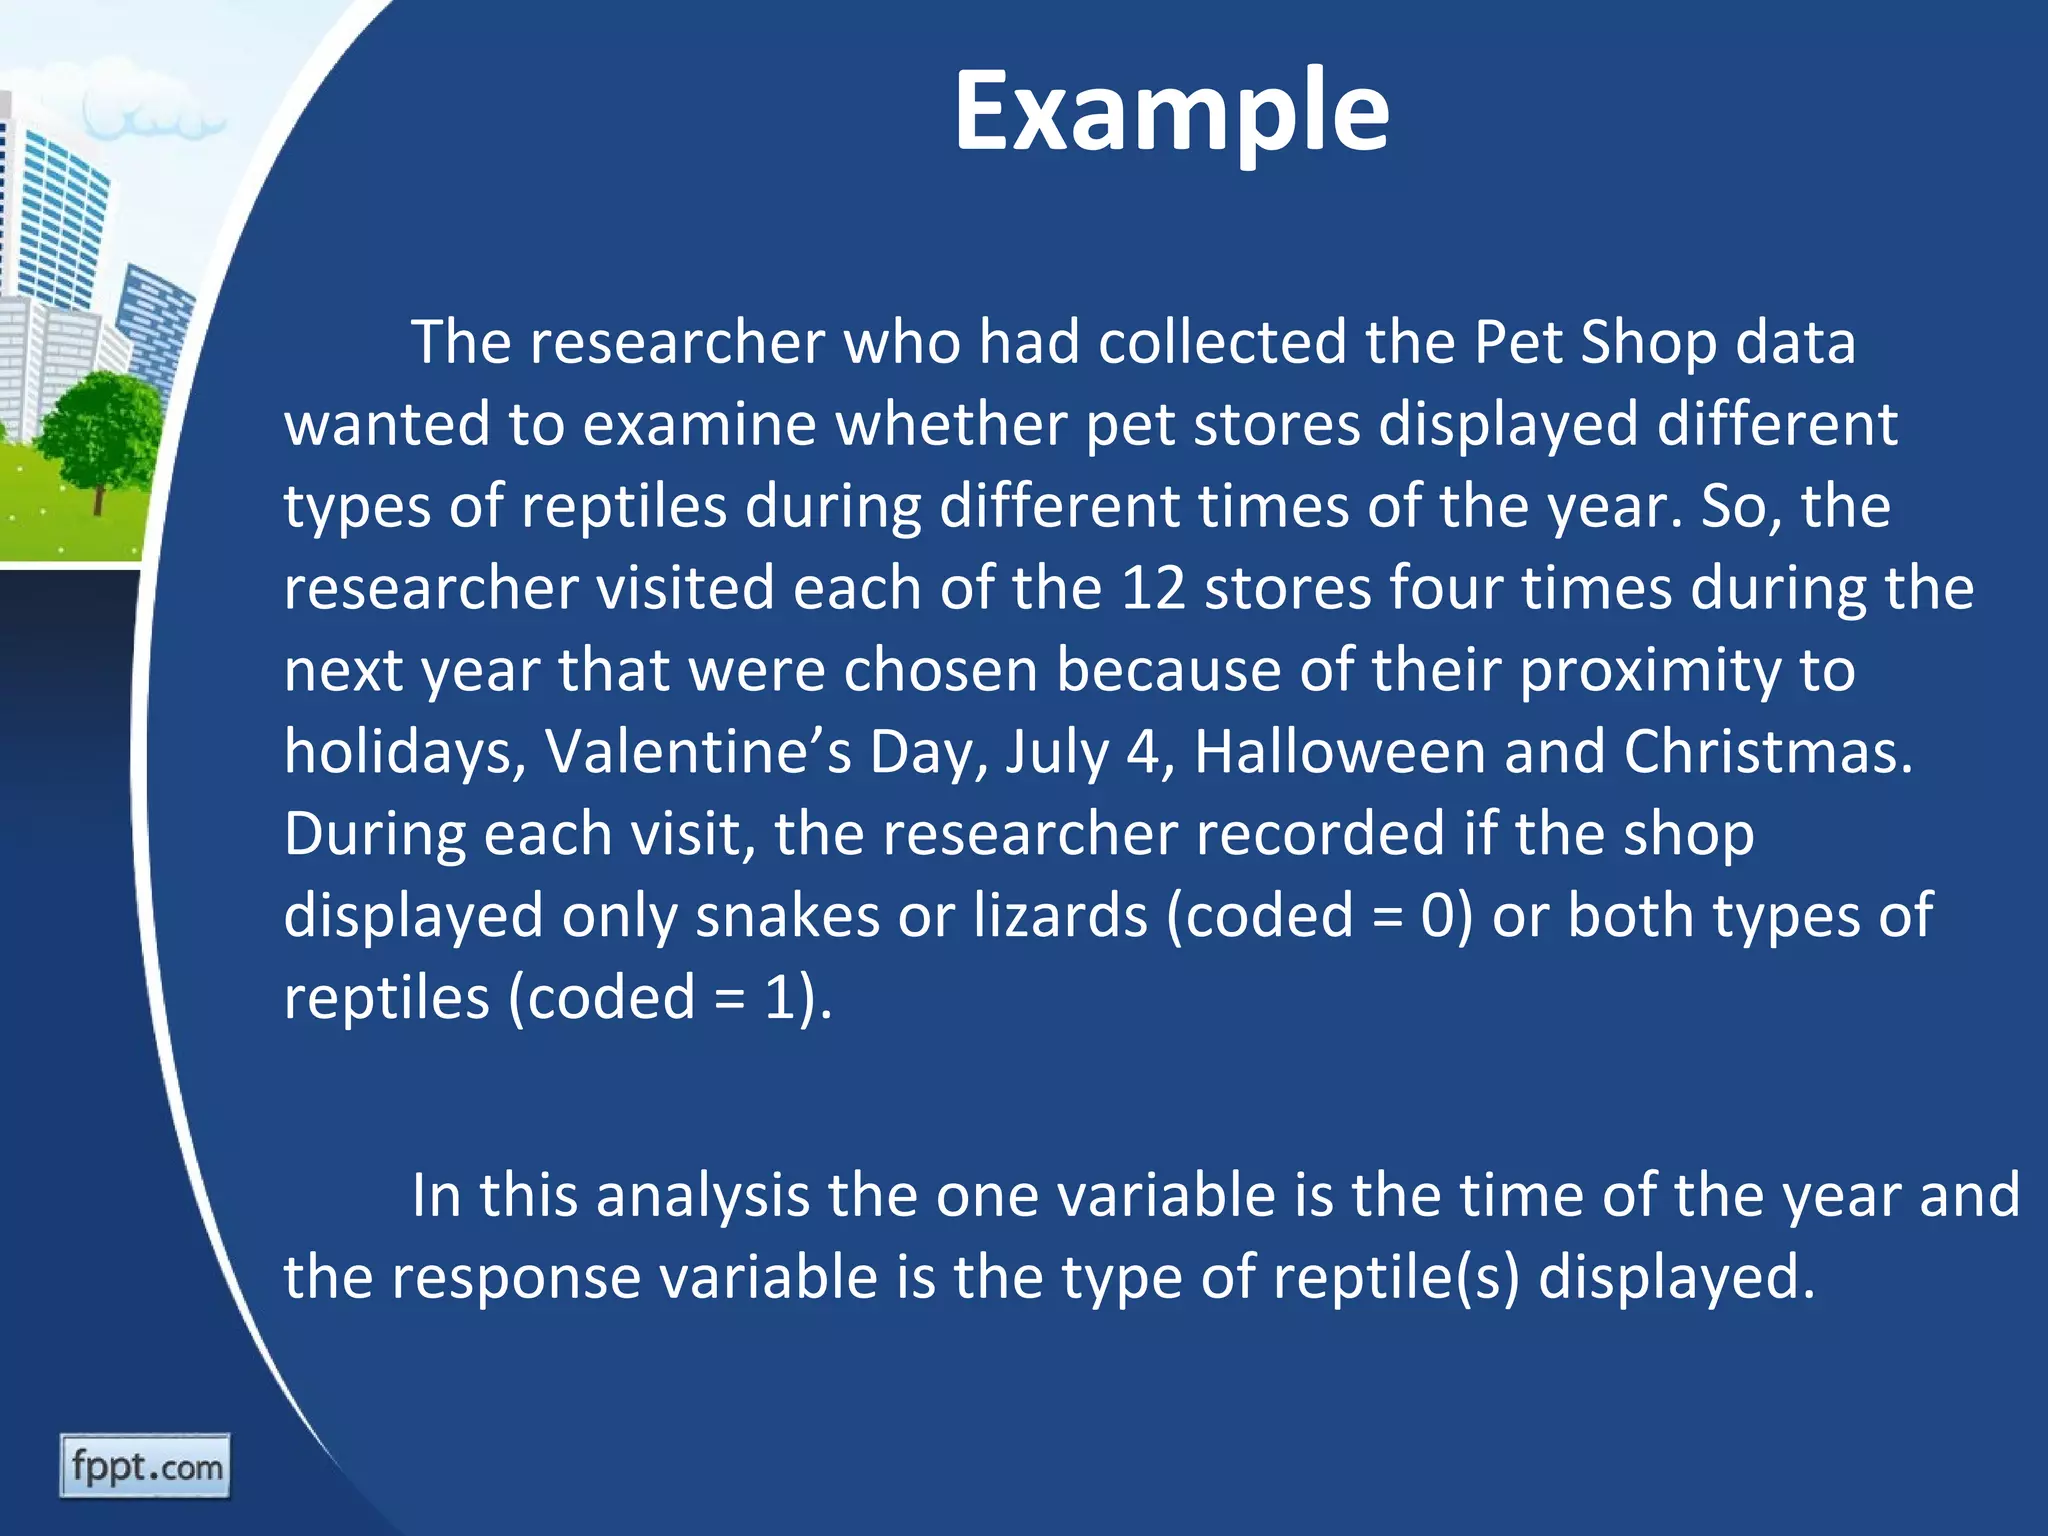
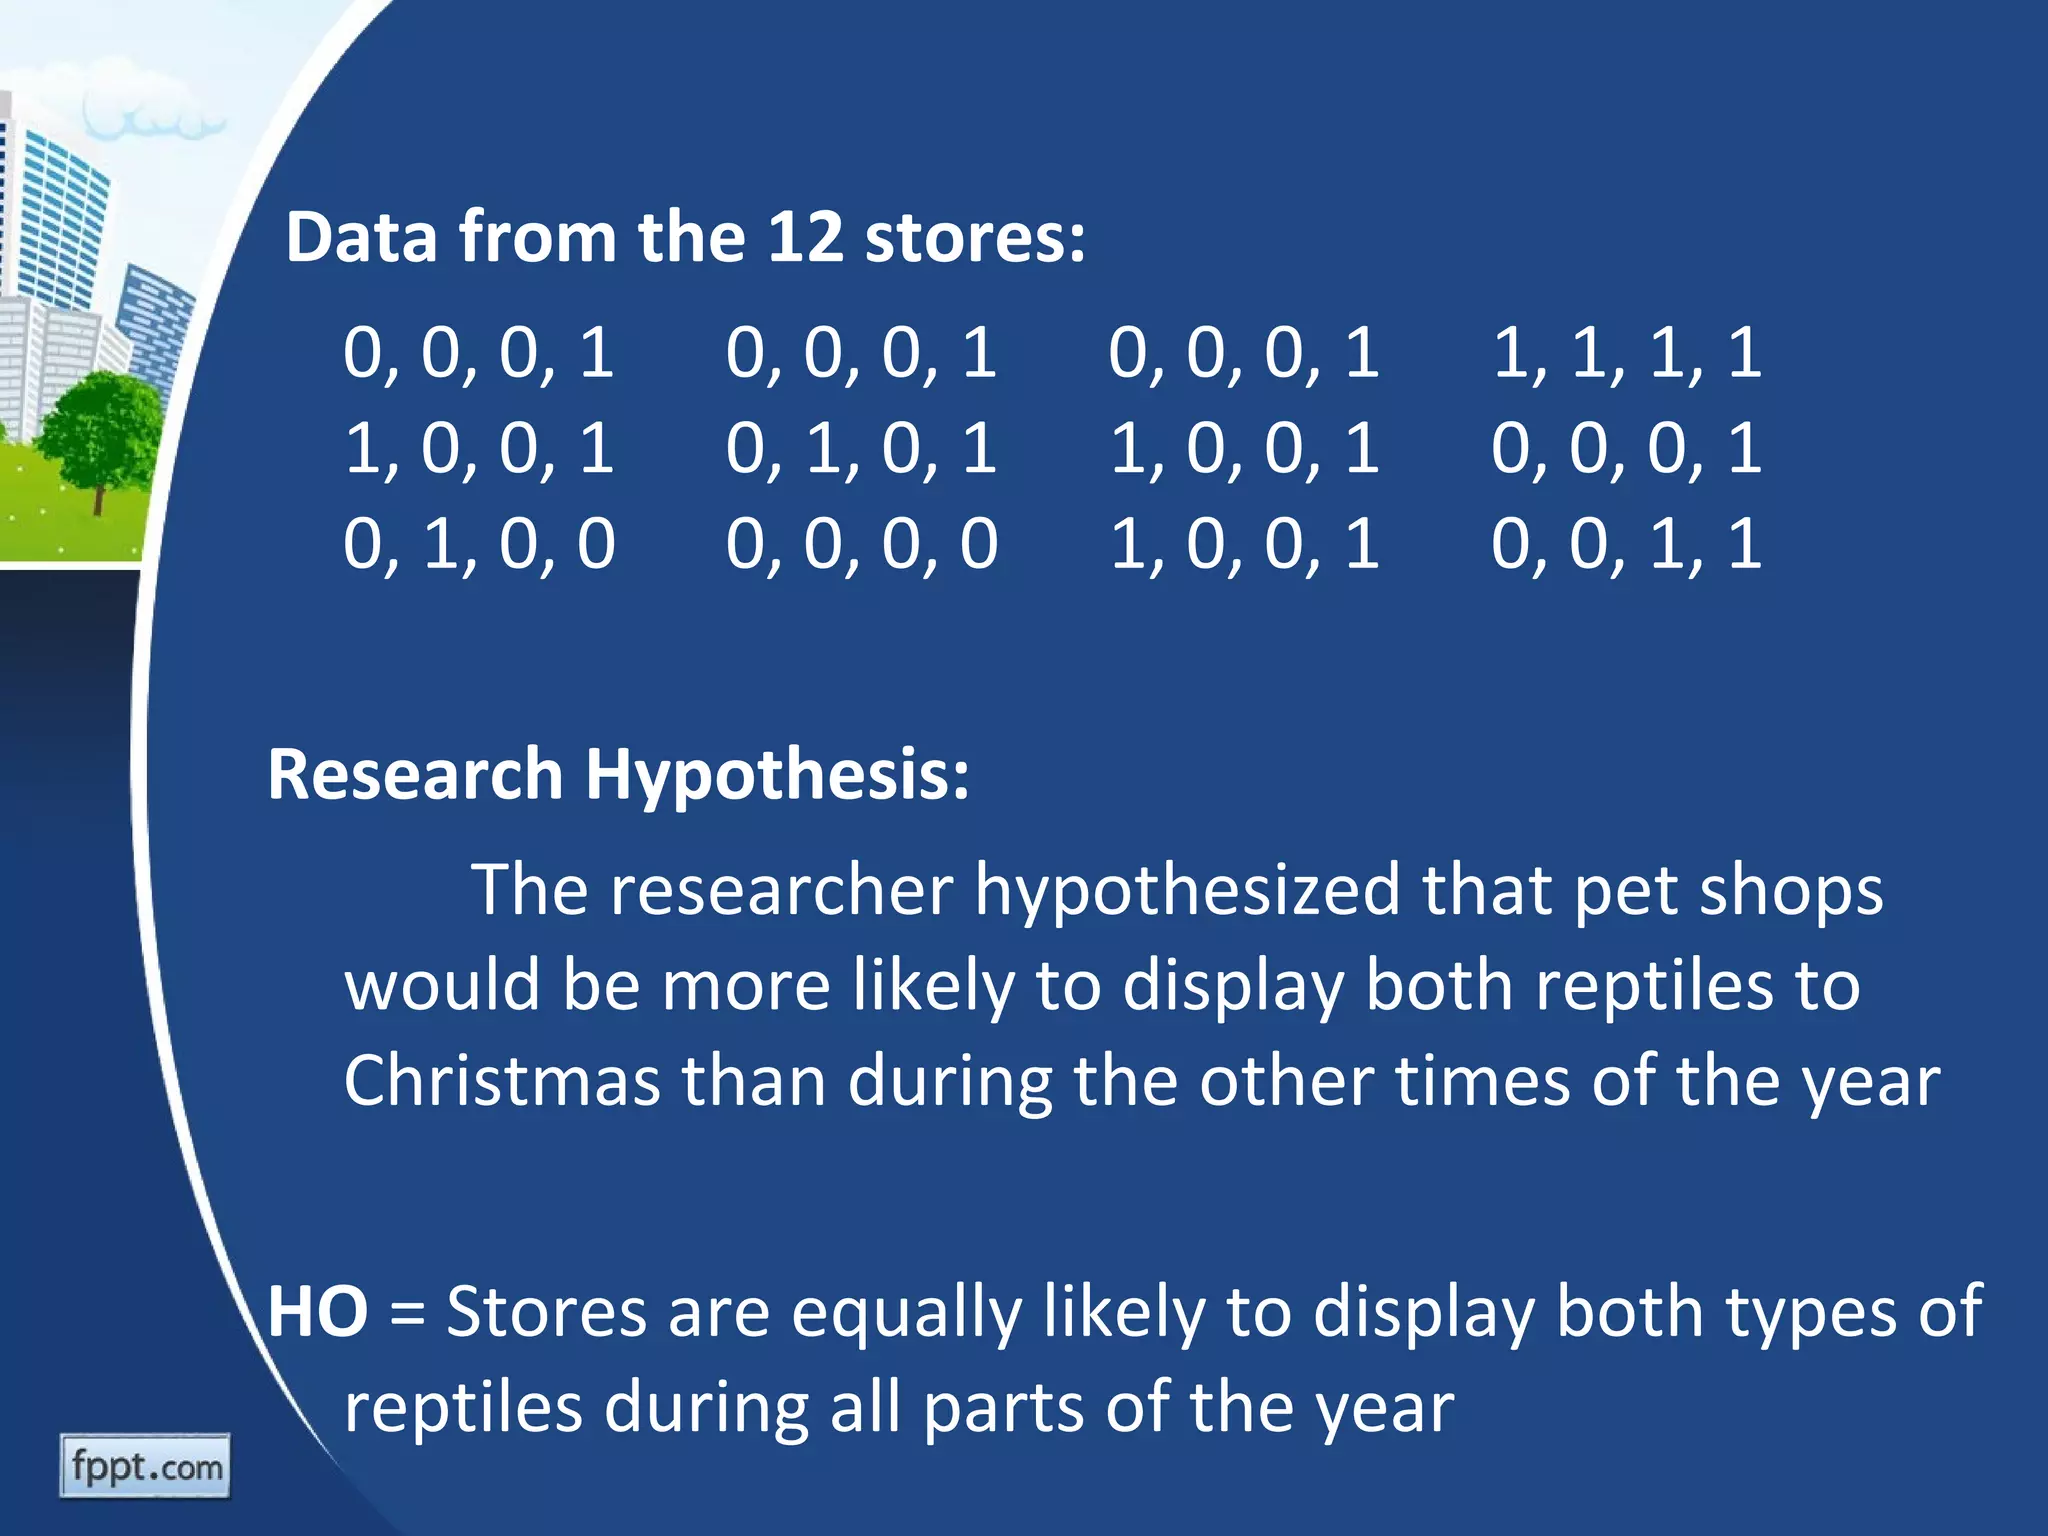
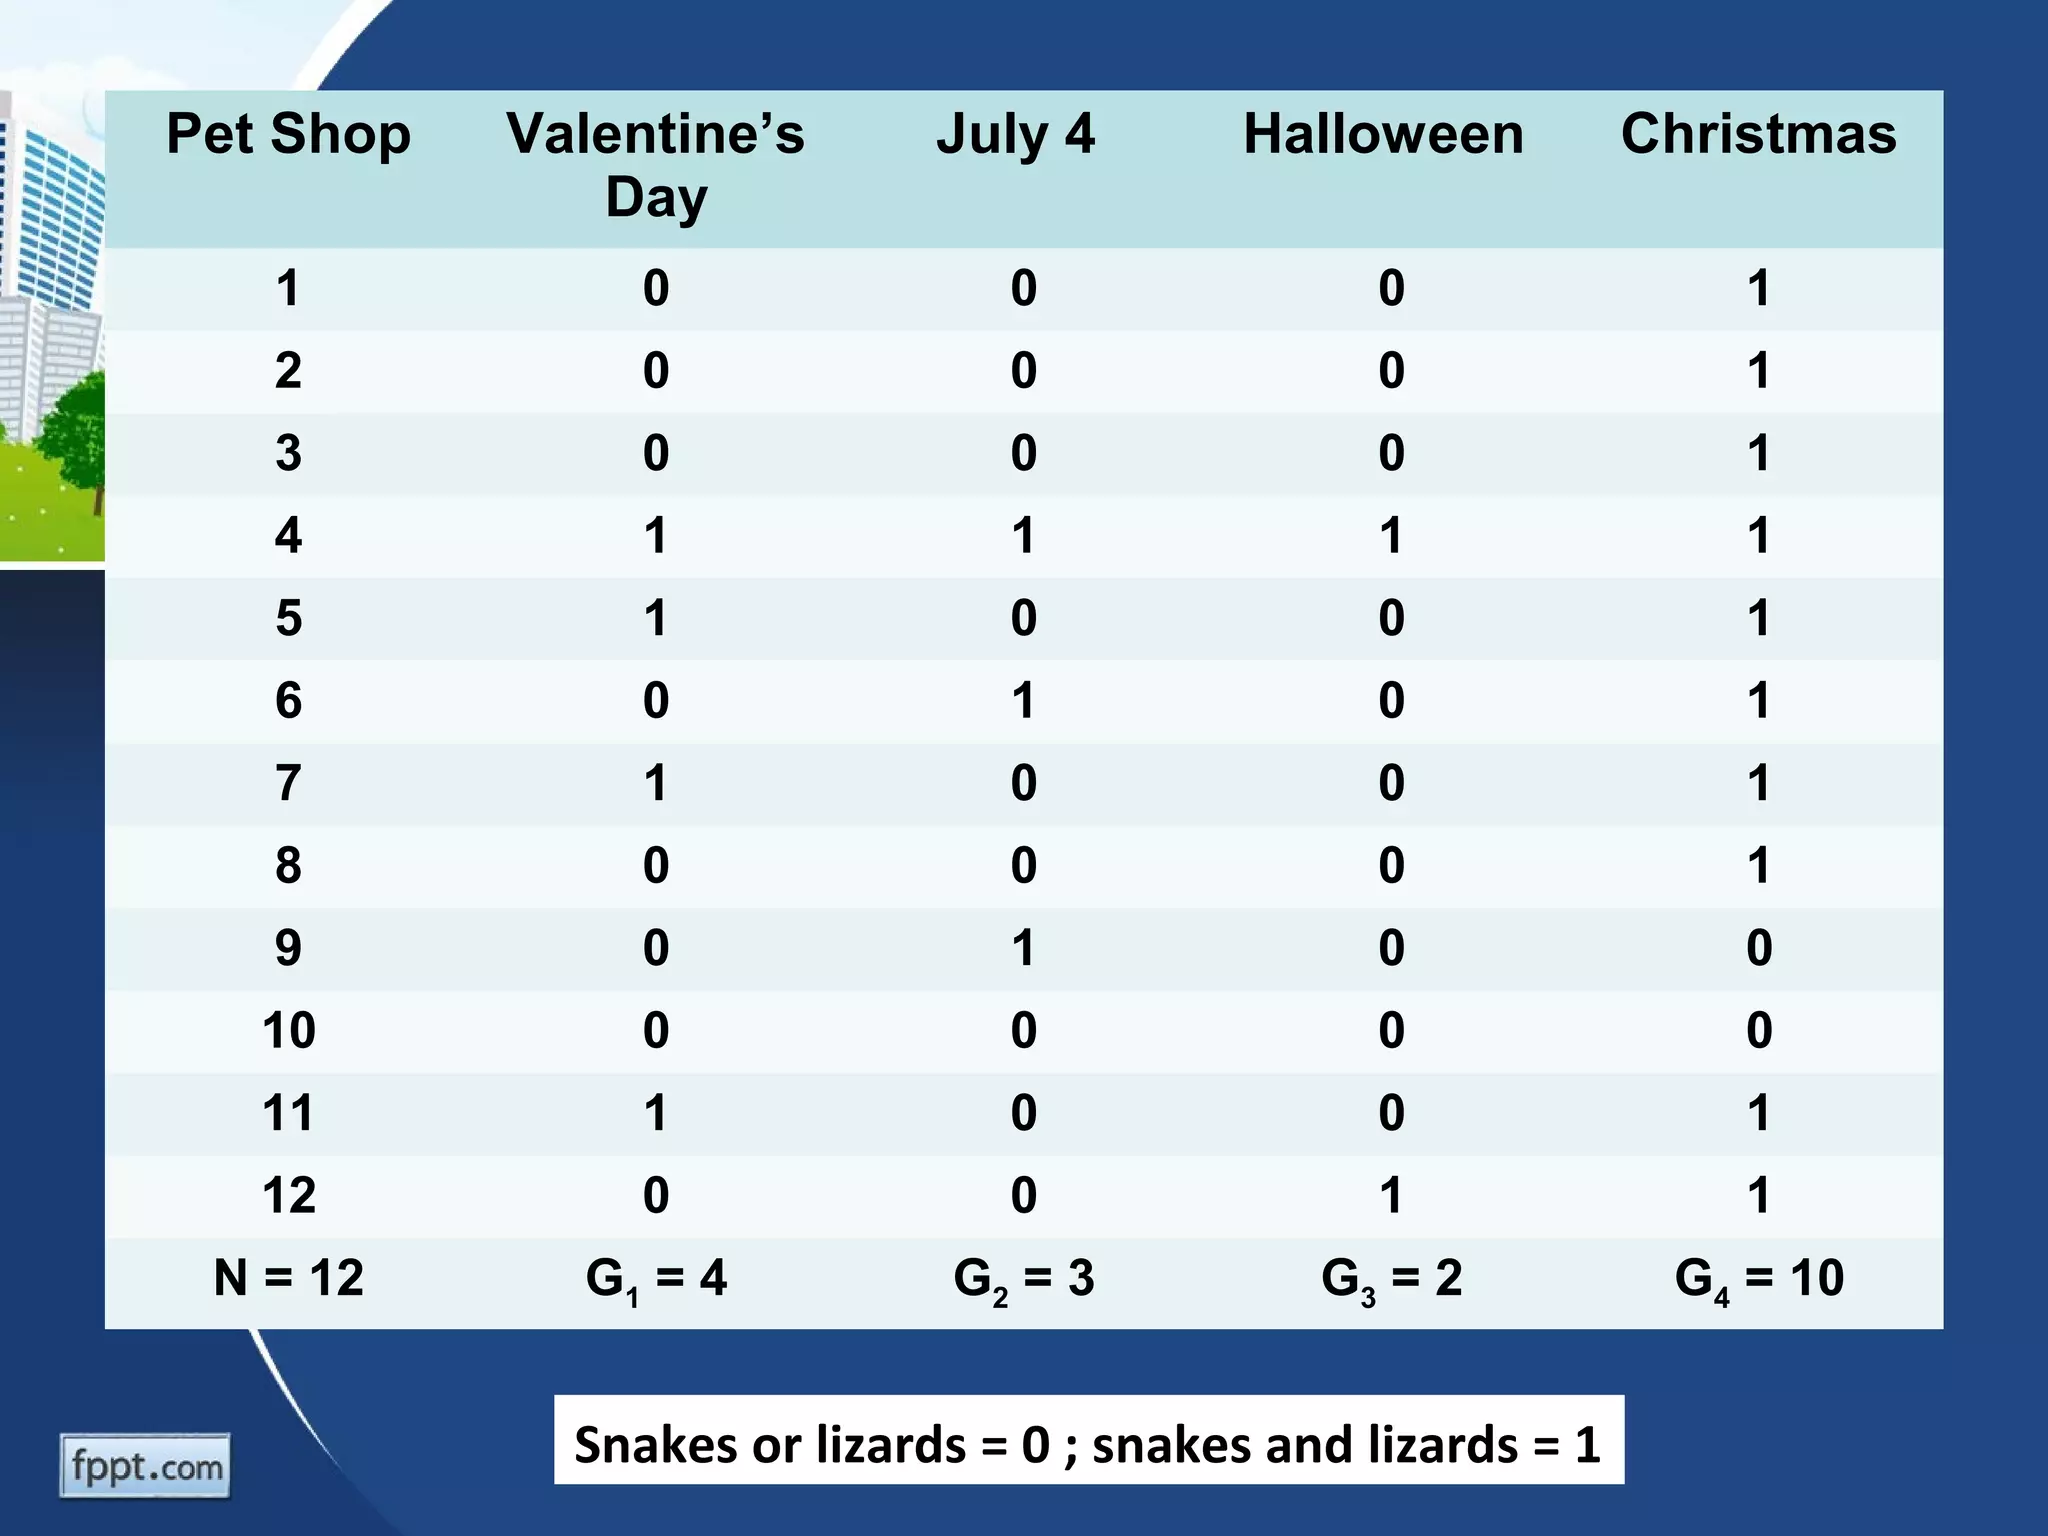
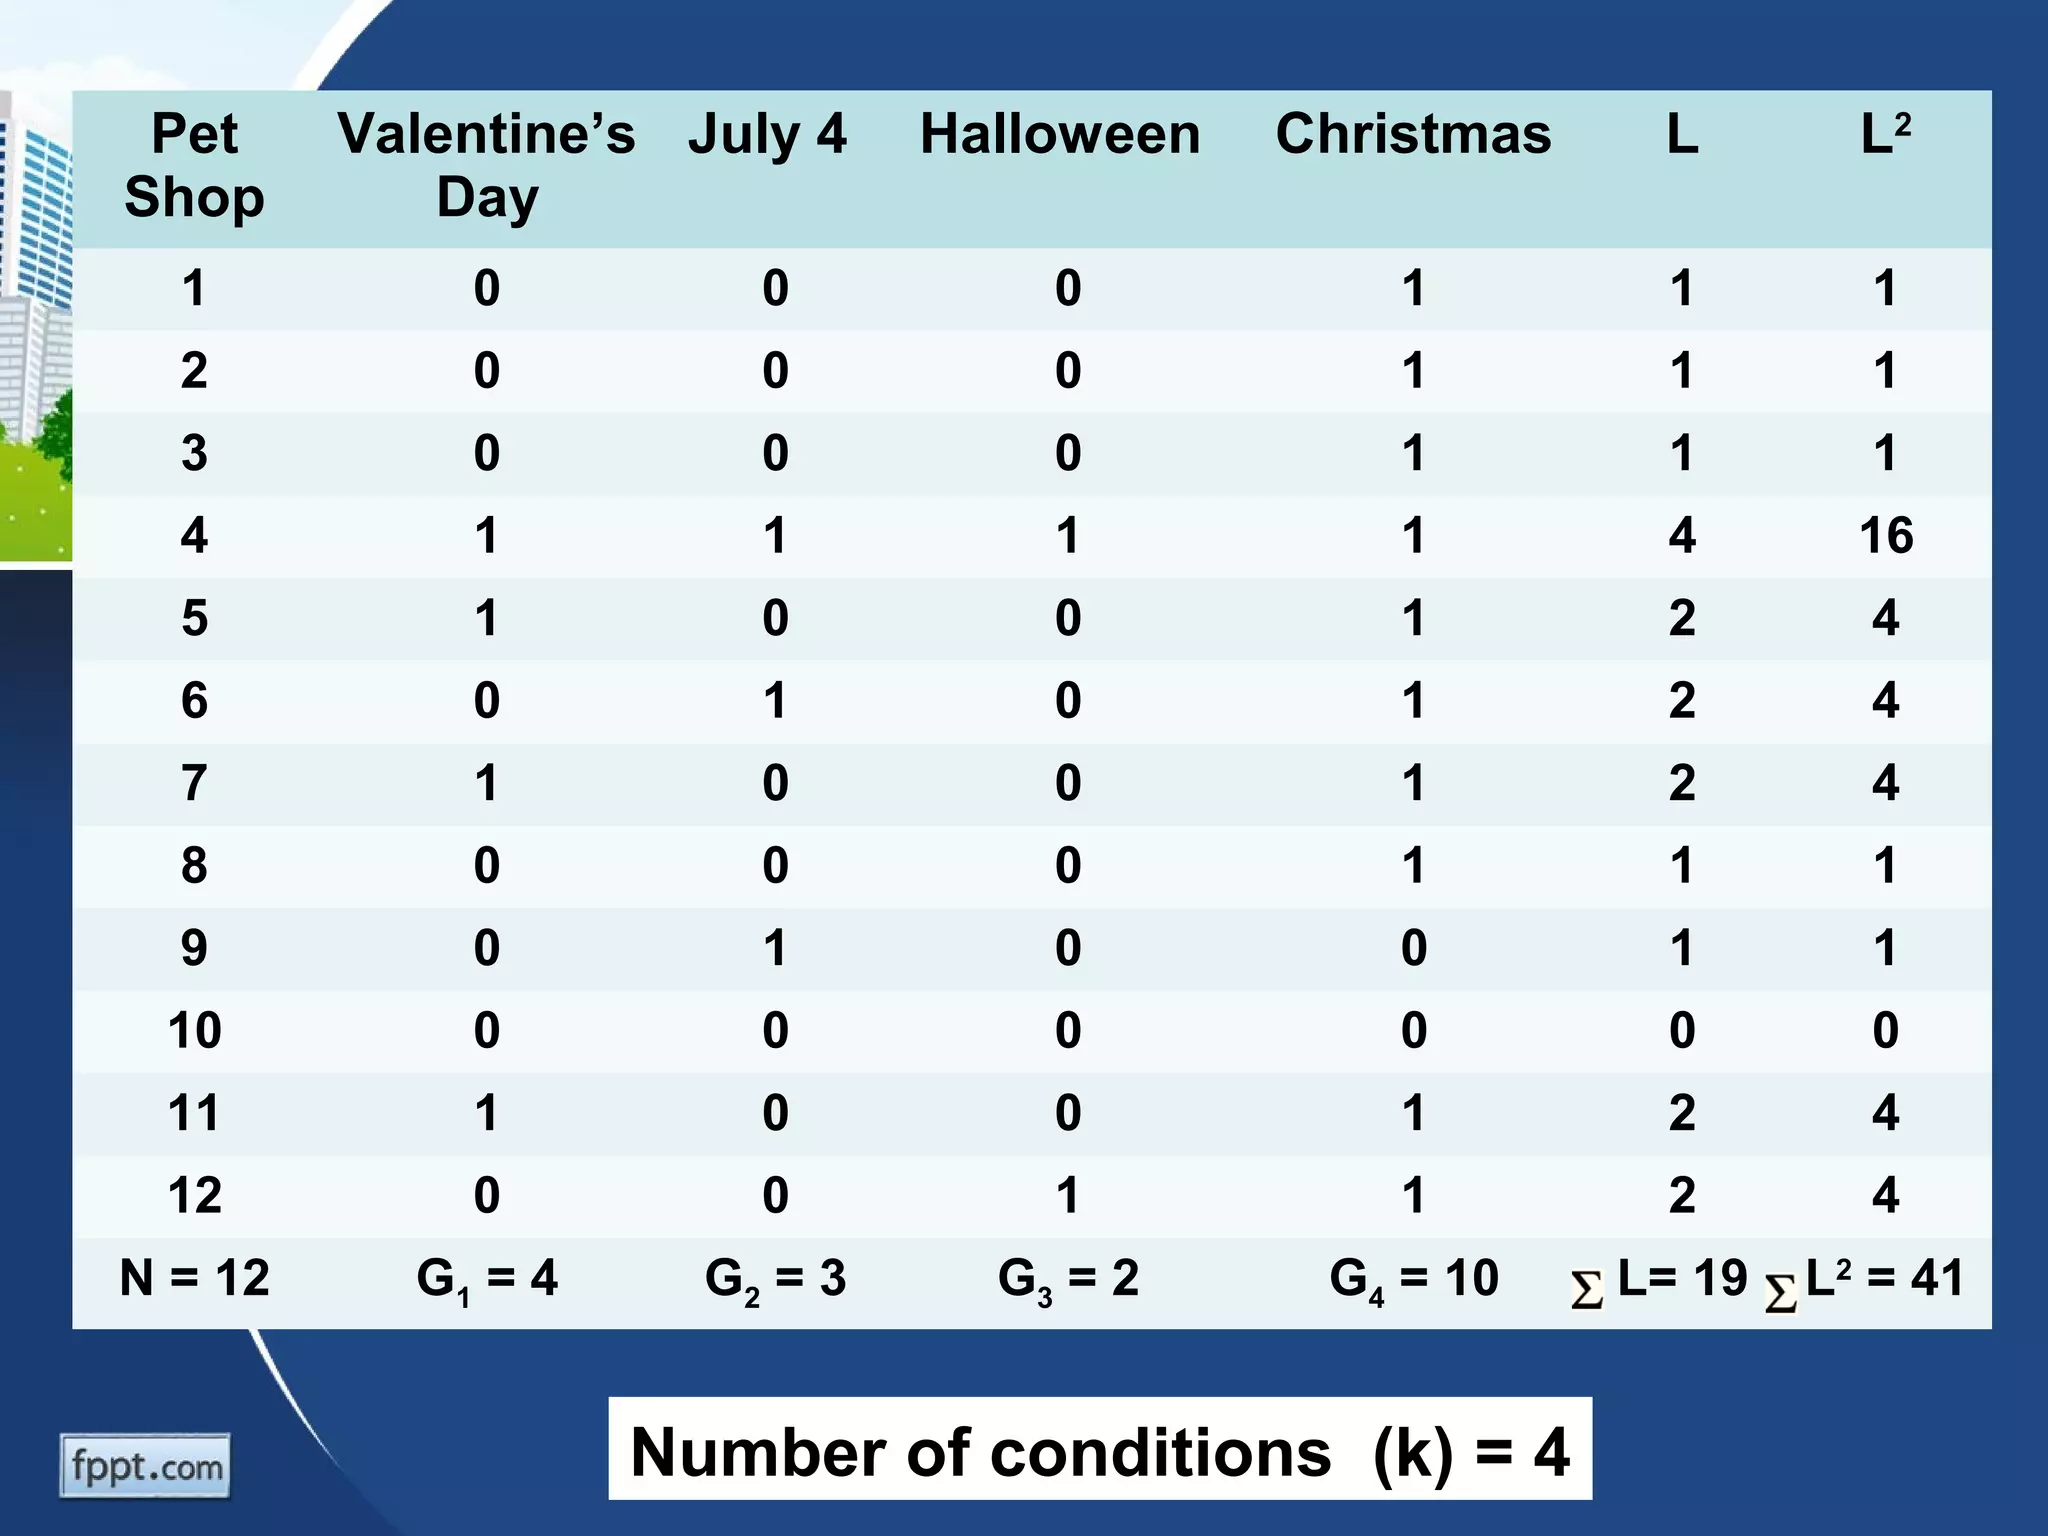
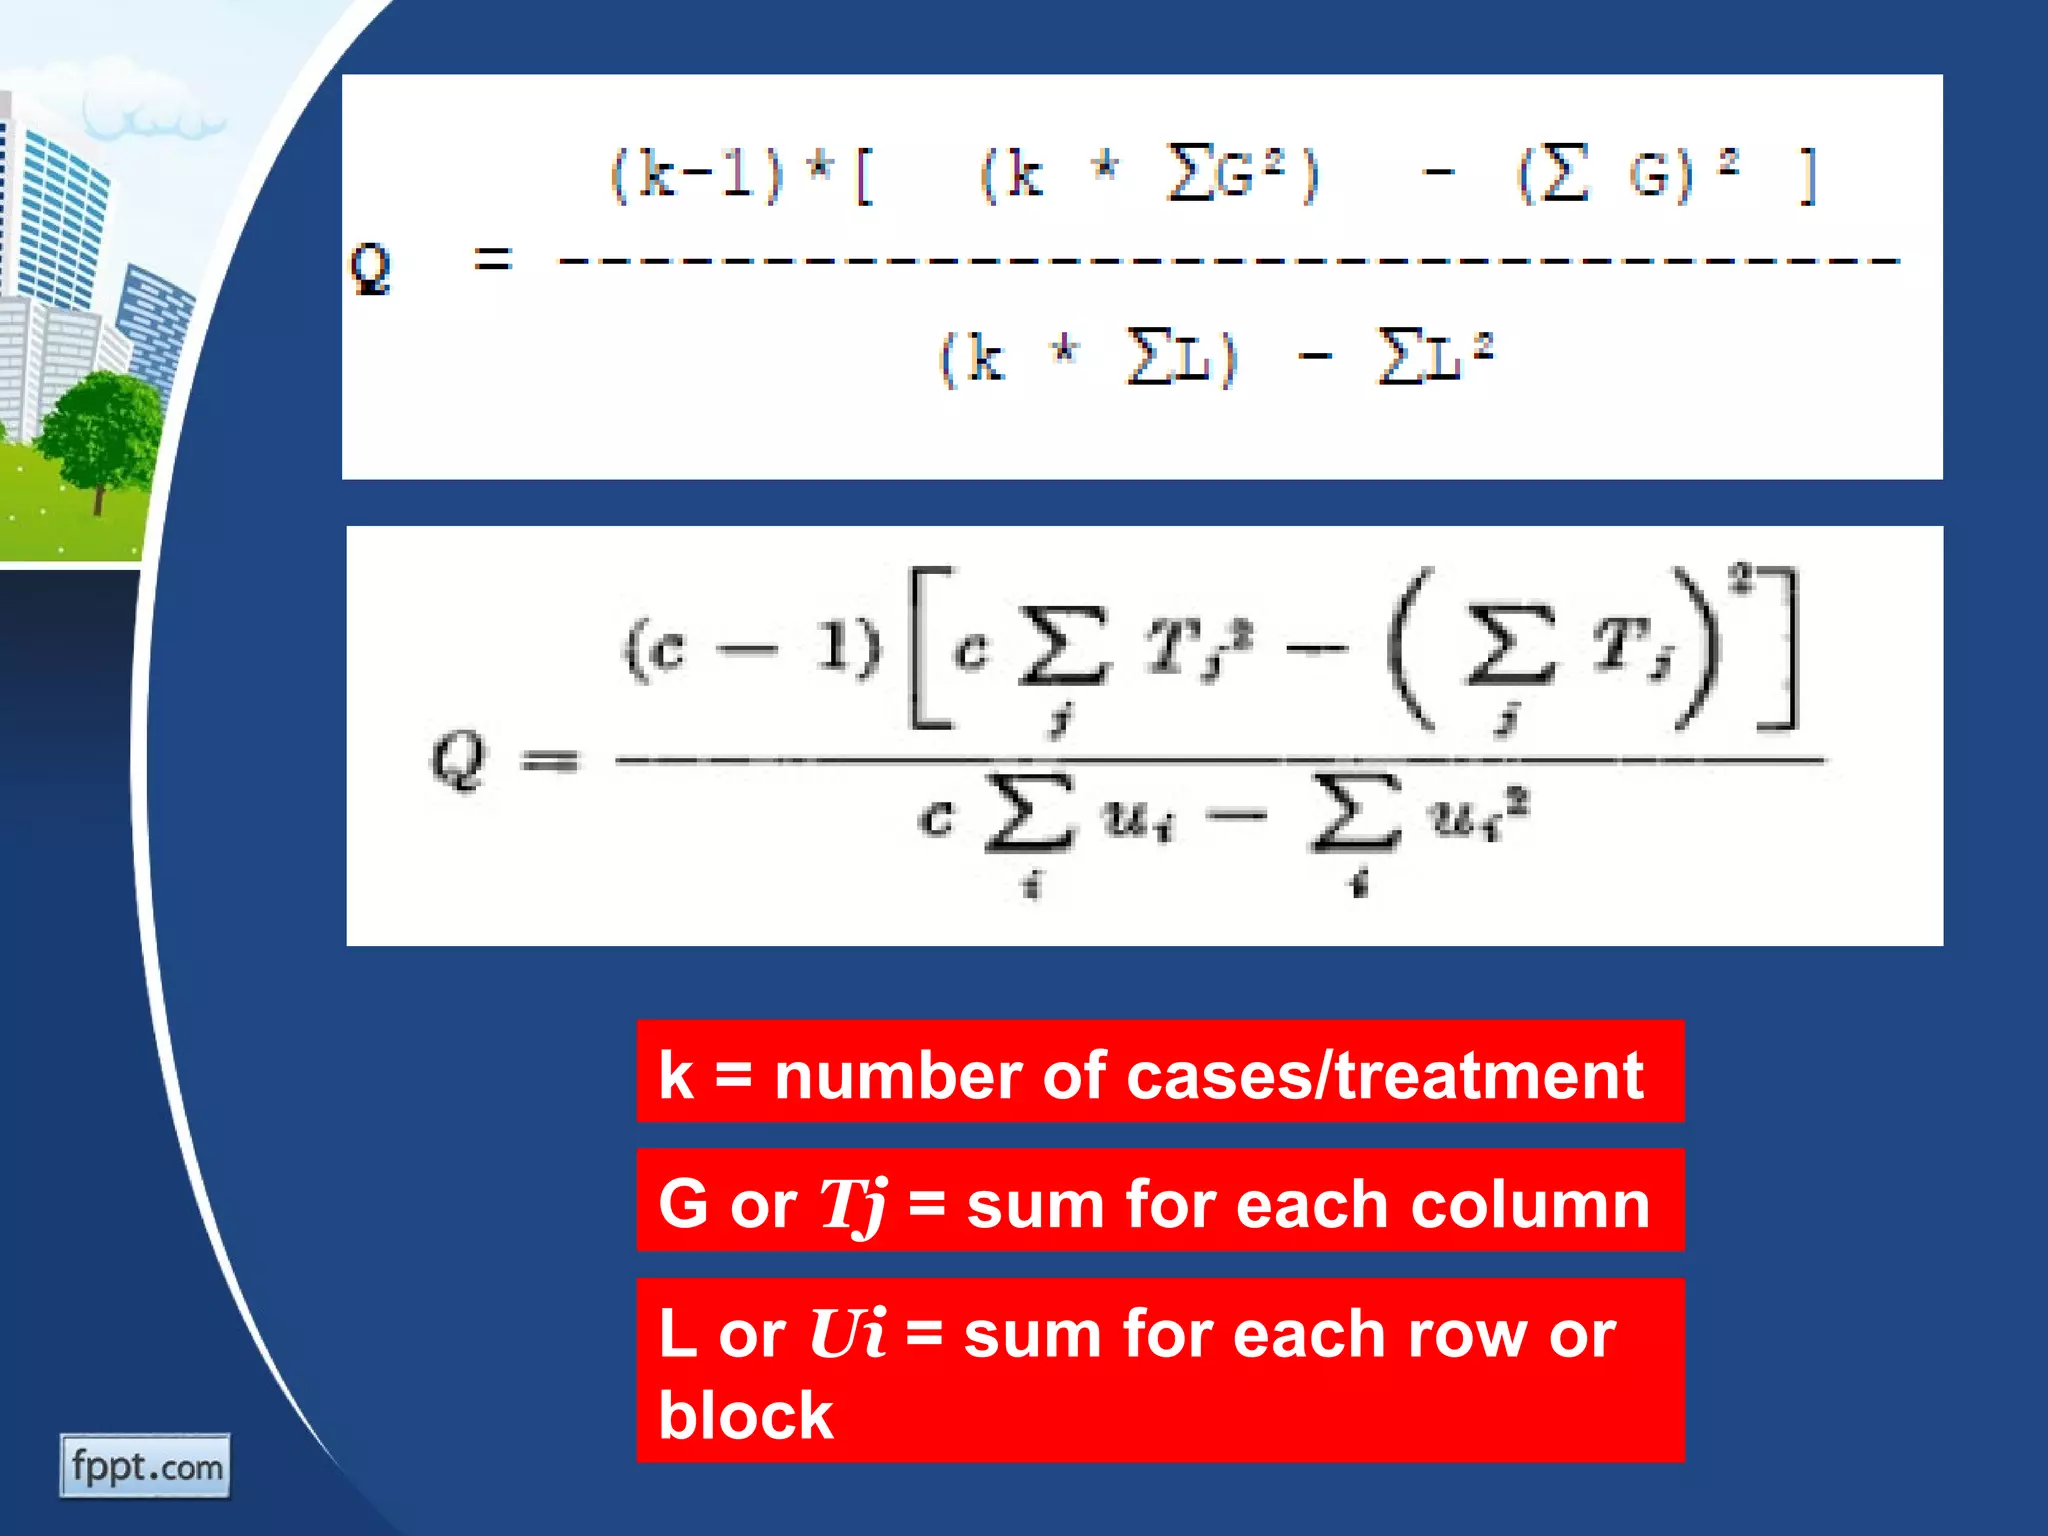


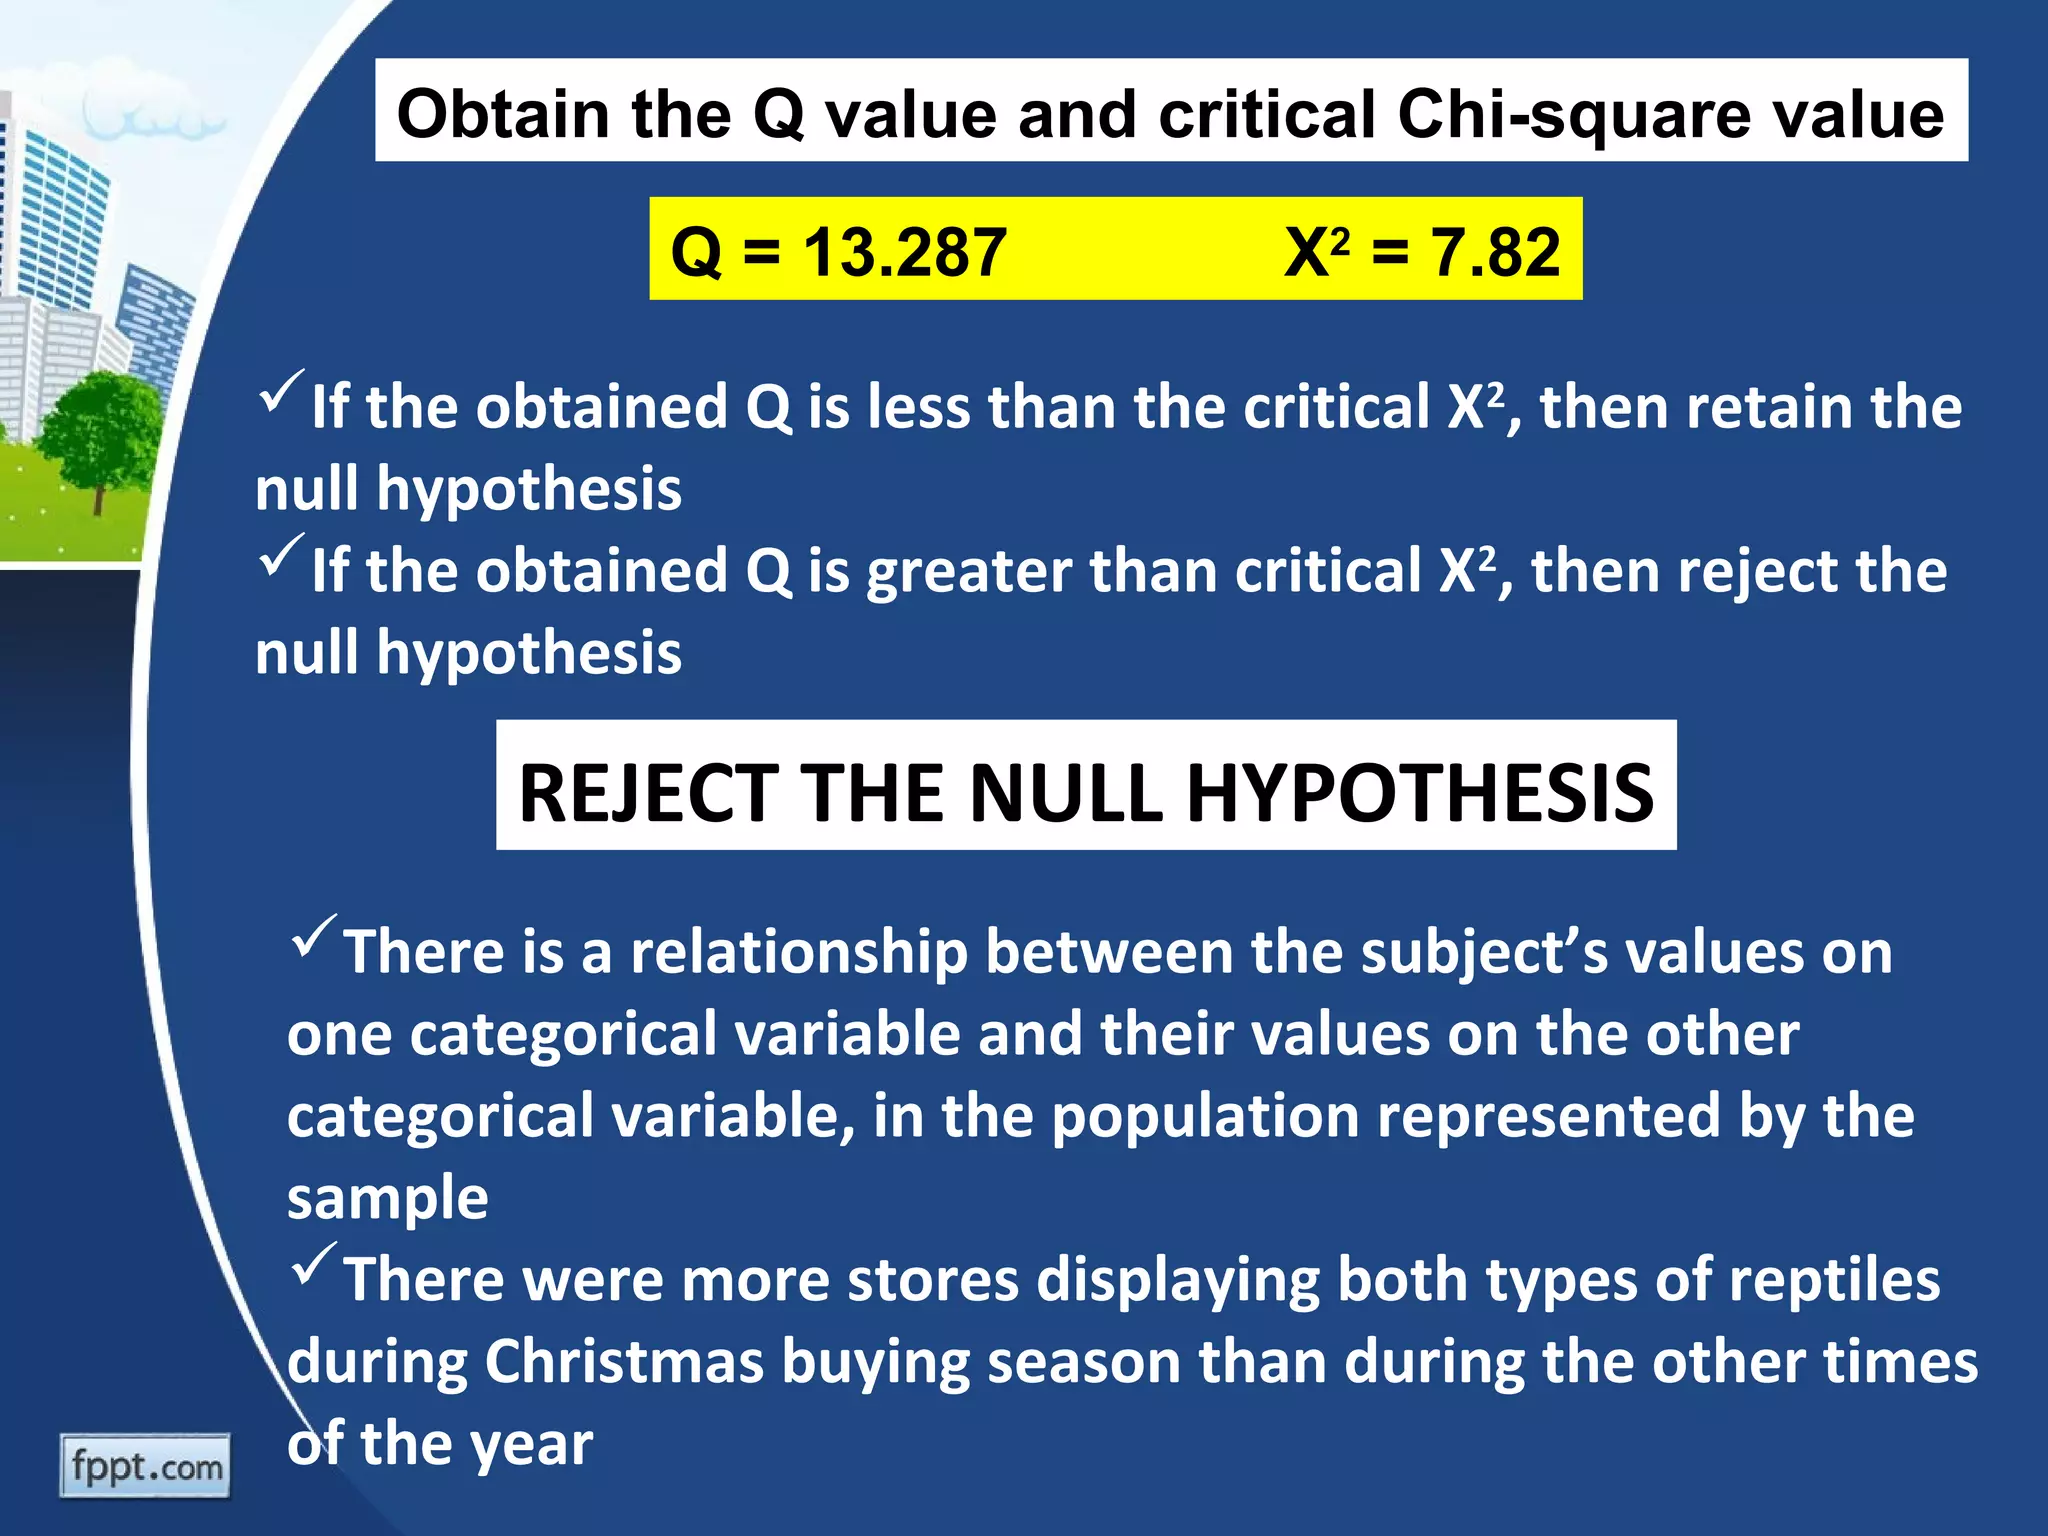
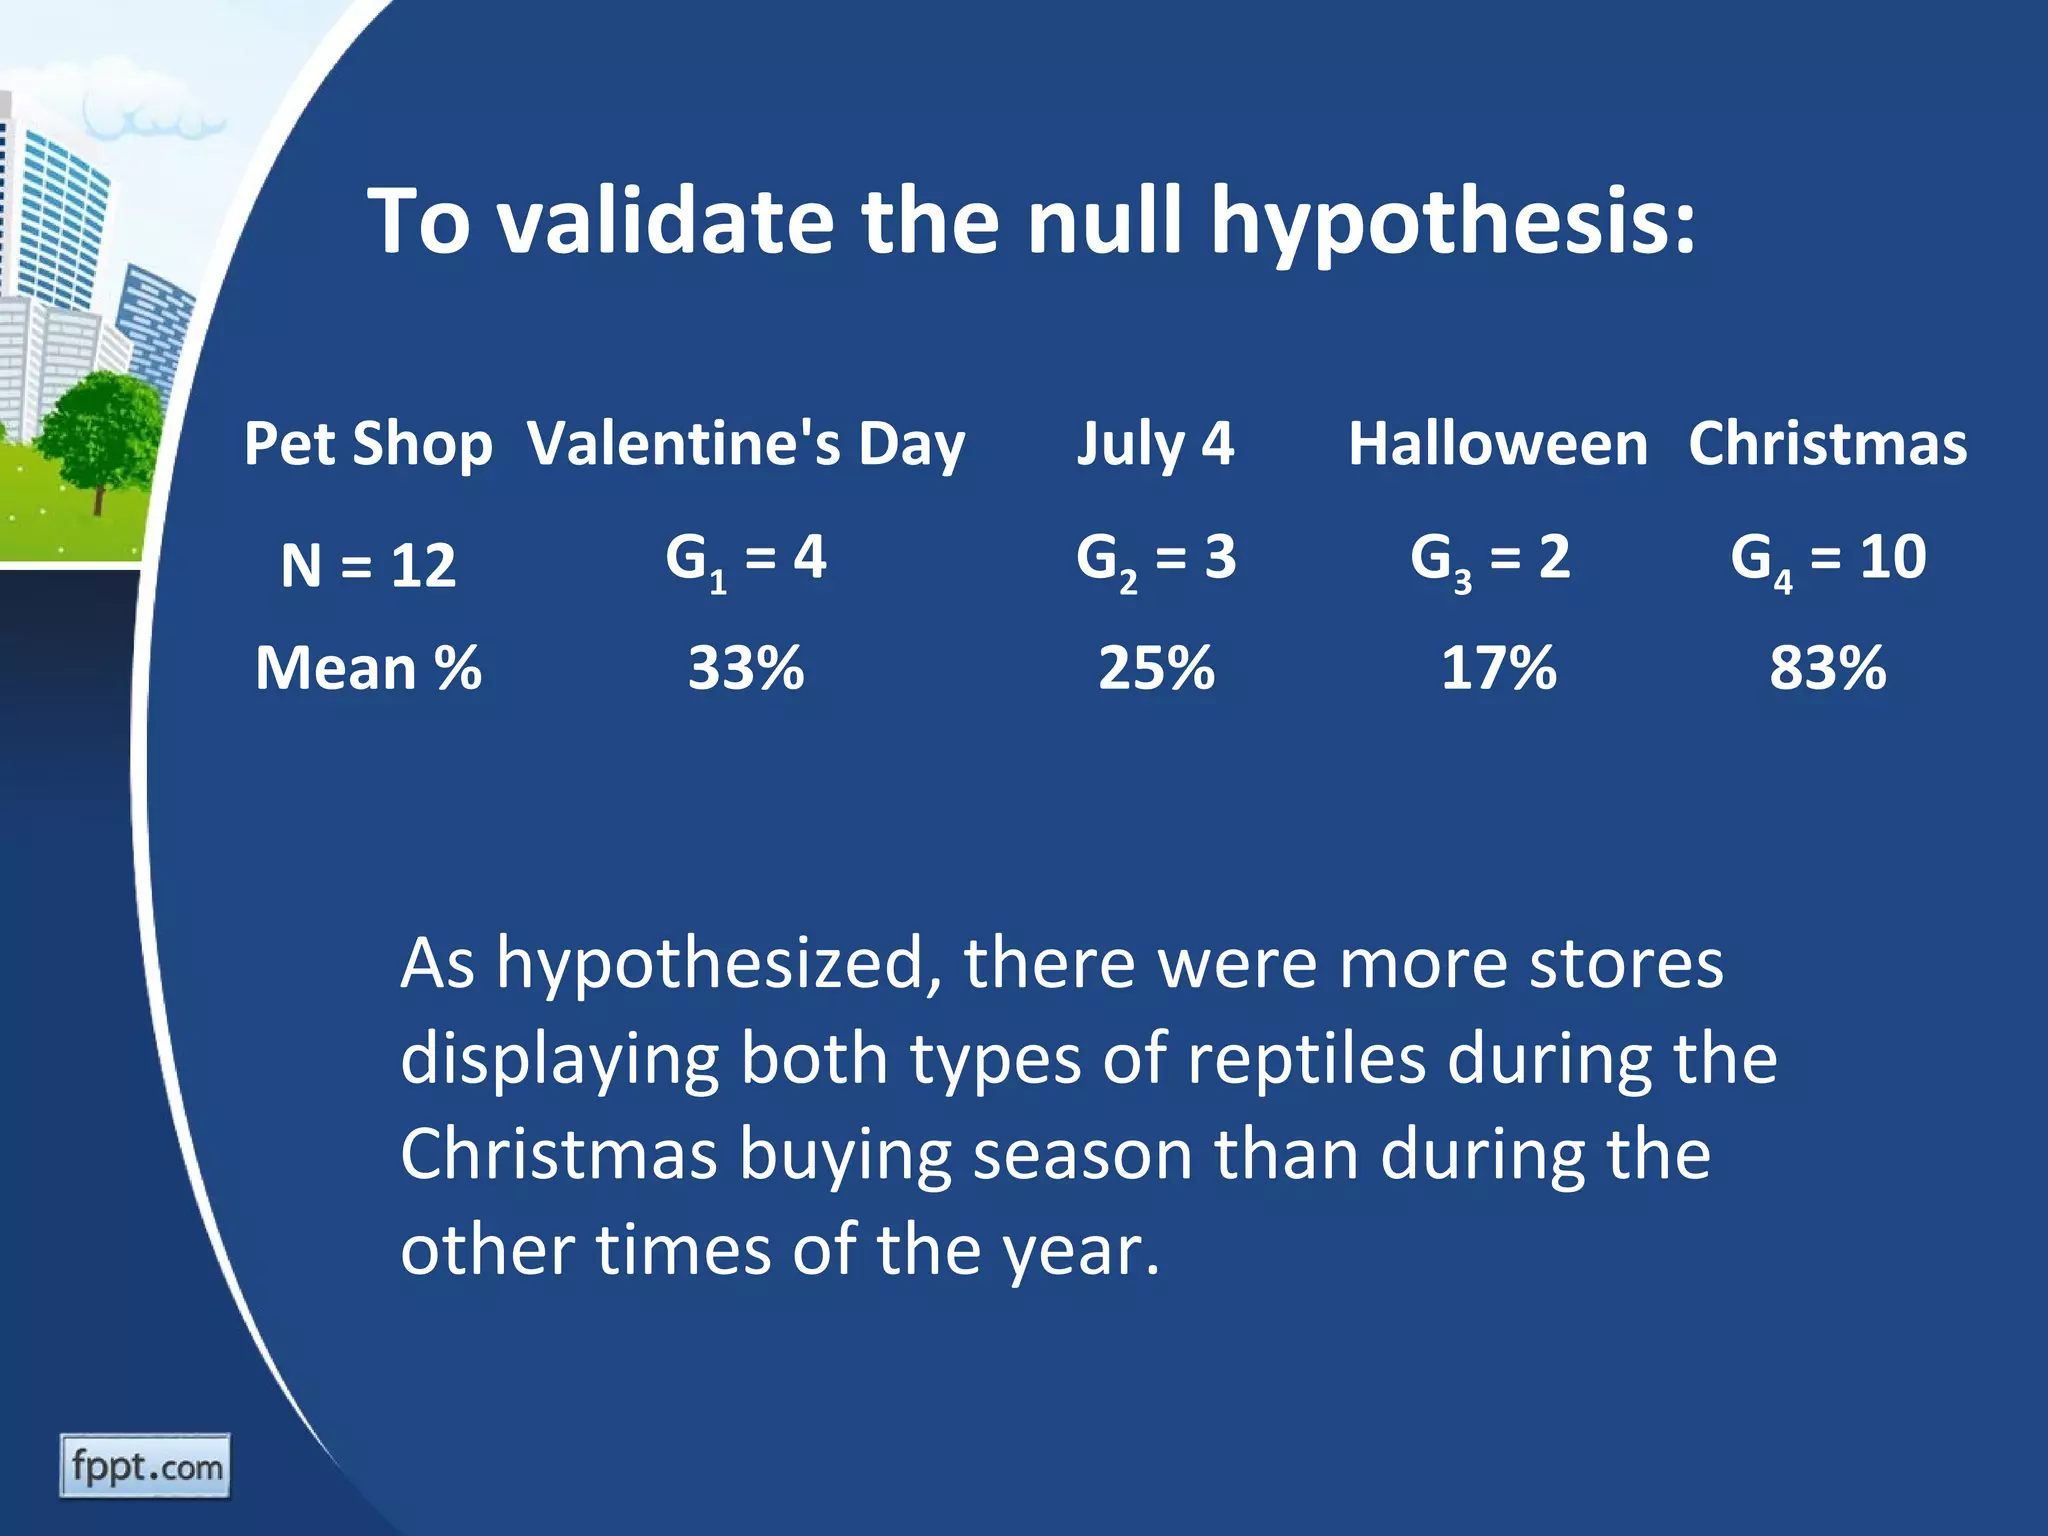


Cochran's Q test is a nonparametric test used to compare dependent categorical variables across three or more conditions. It is an extension of the McNemar test for related samples. The test compares the probability of a target response across different conditions to see if treatments have identical effects. It assumes a large sample size and that blocks were randomly selected. An example uses data from pet stores to test if they are equally likely to display both reptiles (snakes and lizards) during different times of the year. The Cochran's Q test rejects the null hypothesis, finding stores were more likely to display both during Christmas than other times.