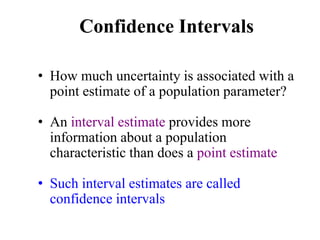
Downloaded 10 times

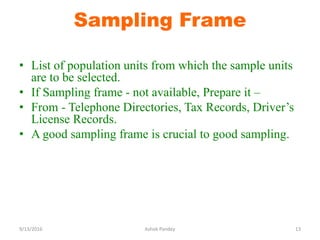


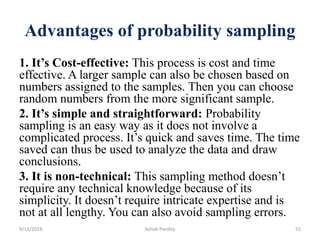
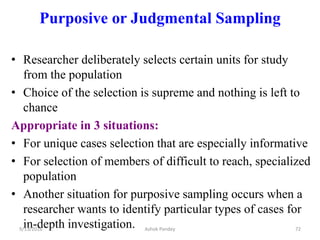
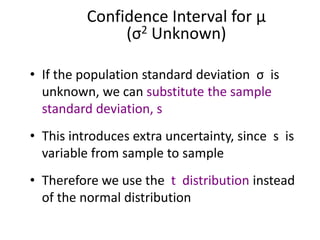
![9/13/2016 Ashok Pandey 33
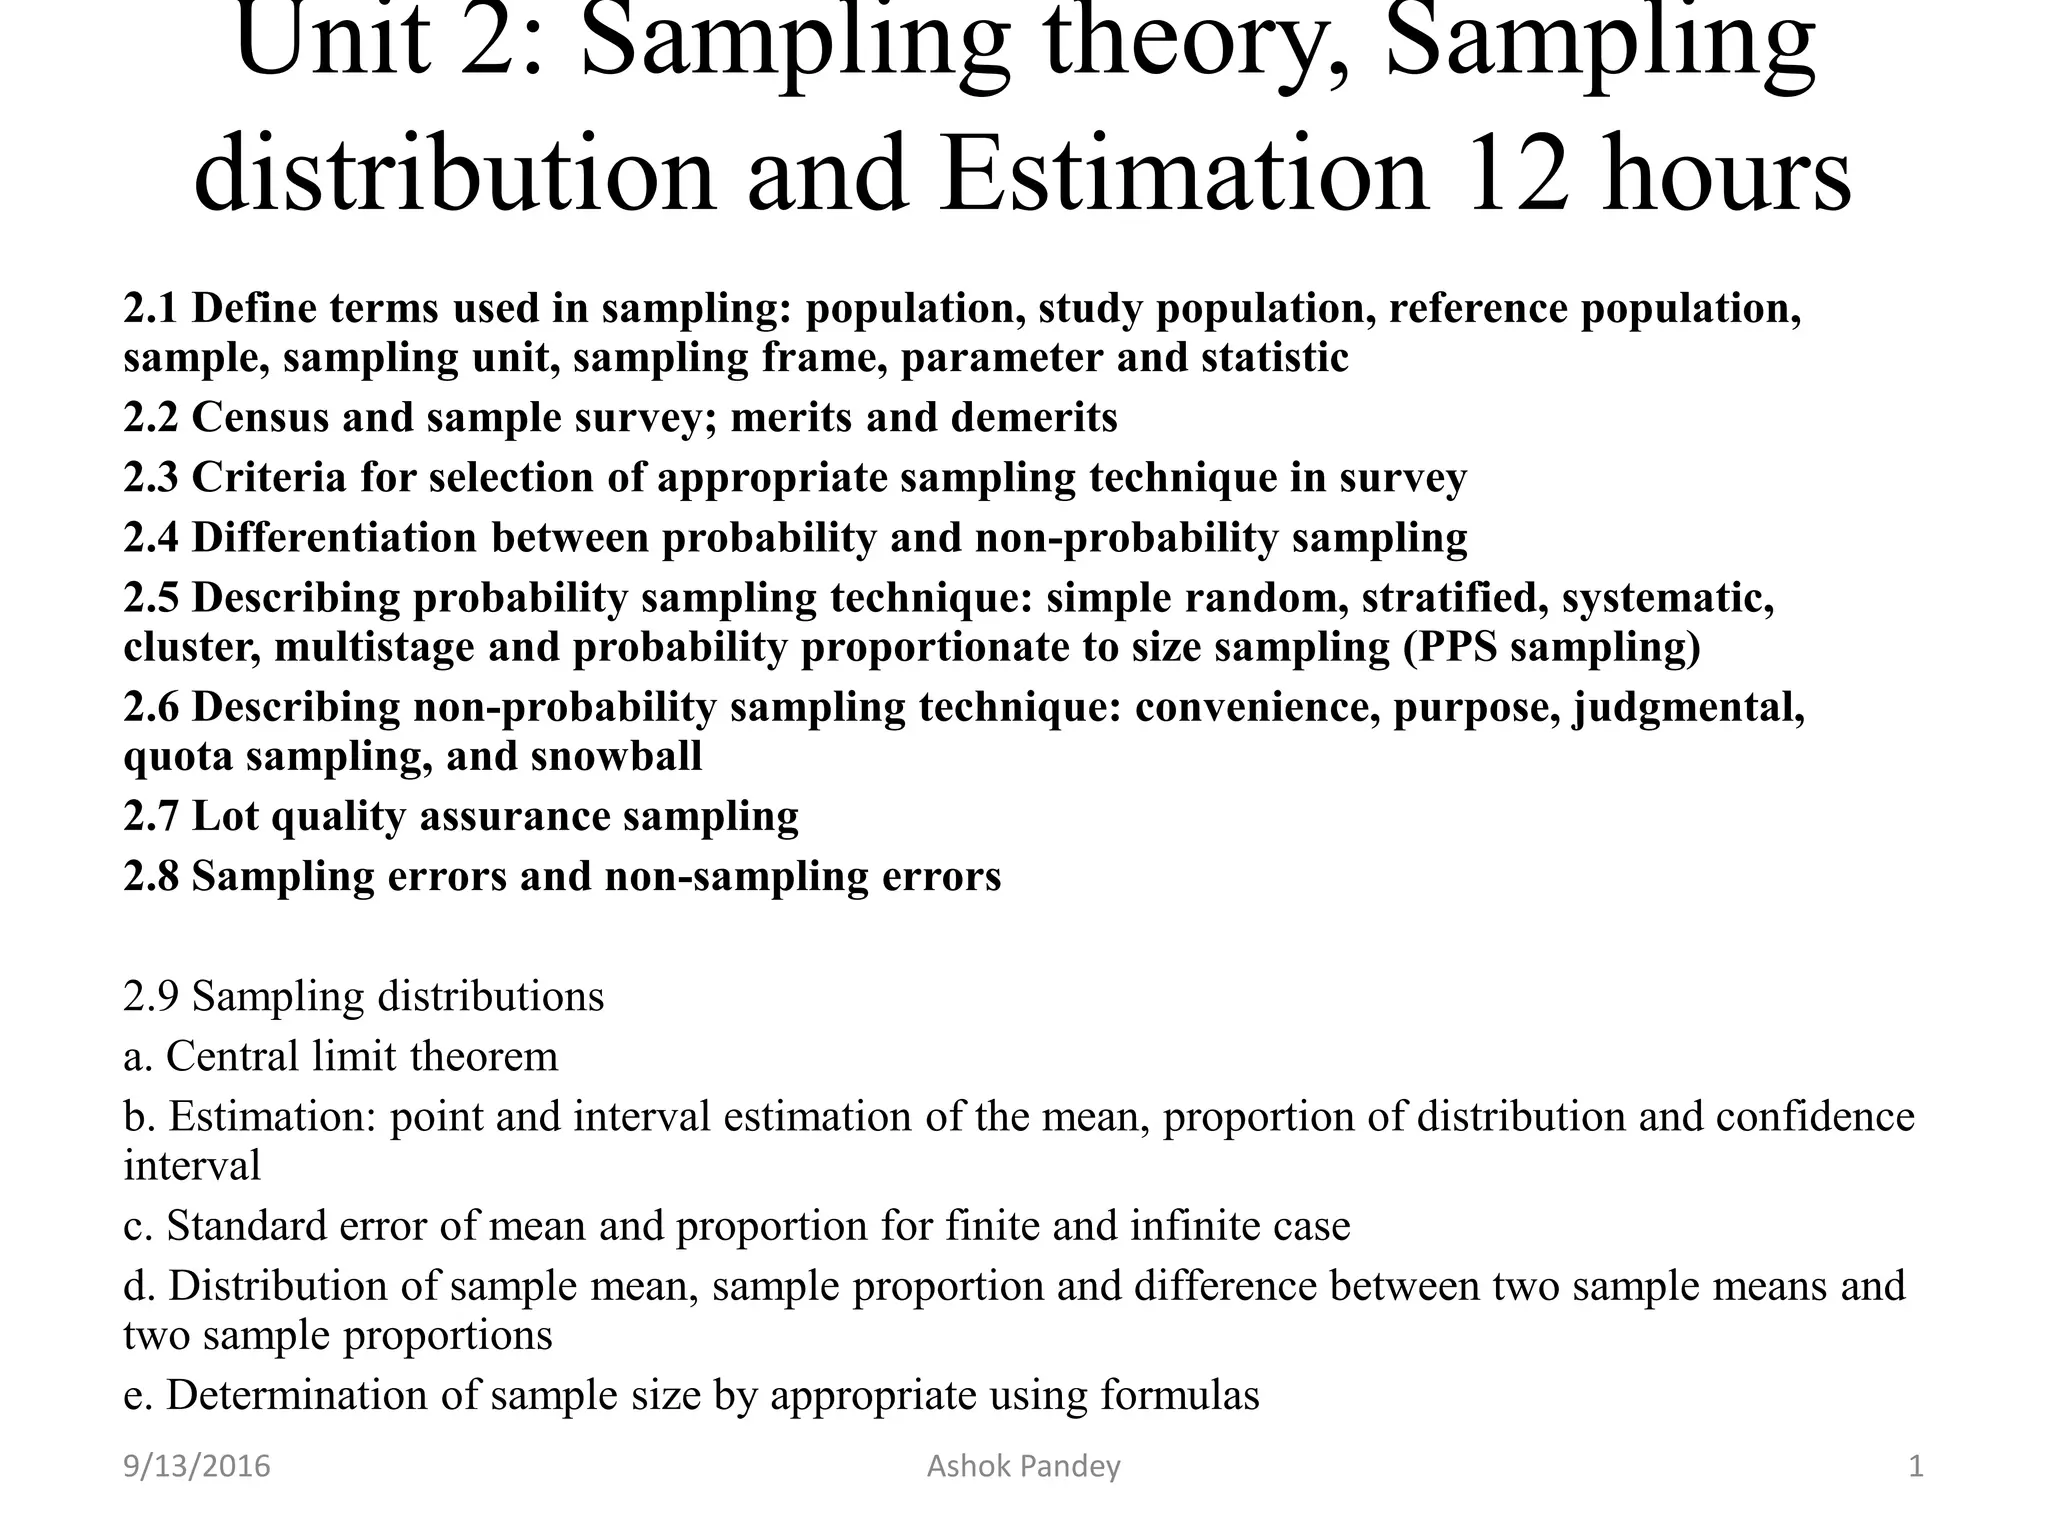
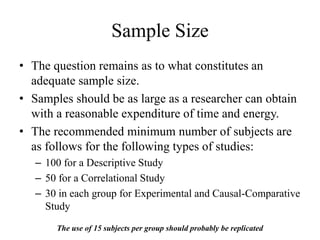
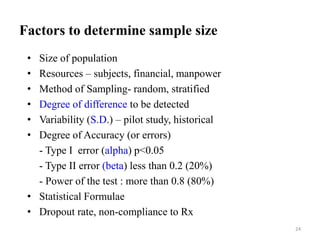
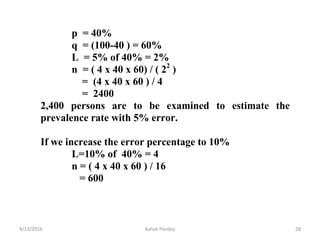
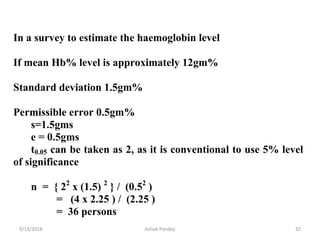
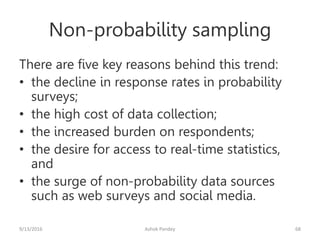
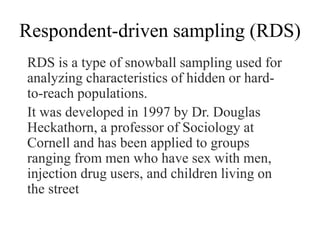
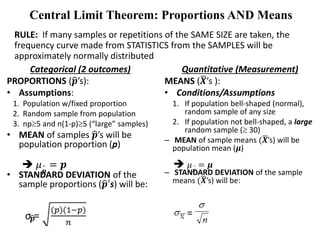
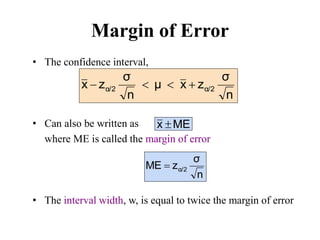
Formulas for Sample Size (SS)
For Infinite Sample Size SS = [Z2p (1 − p)]/ C2
For Finite Sample Size SS/ [1 + {(SS − 1)/Pop}]
Where,
•SS = Sample size
•Z = Given Z value
•p = Percentage of population
•C = Confidence level
•Pop = Population
Check: Z Score Table](https://image.slidesharecdn.com/sampling-240102015407-56bdd3e8/85/Sampling-33-320.jpg)

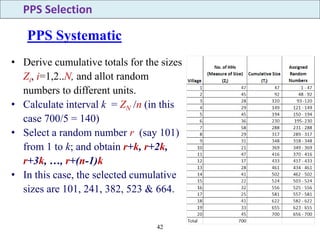
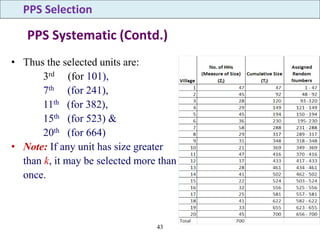
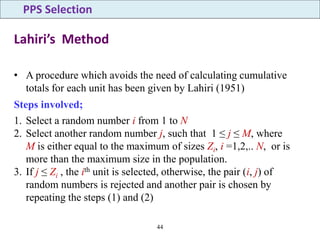
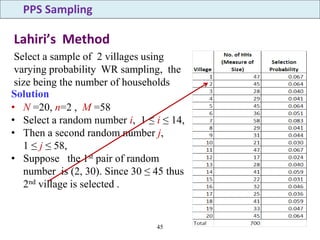
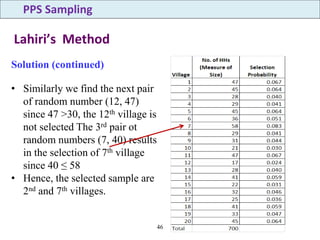
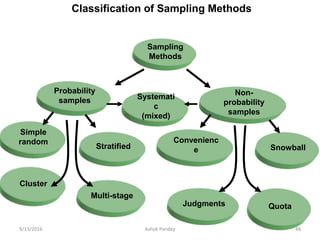

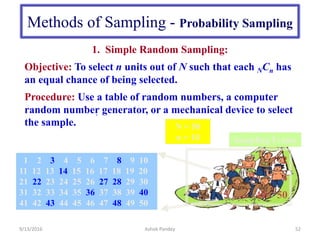
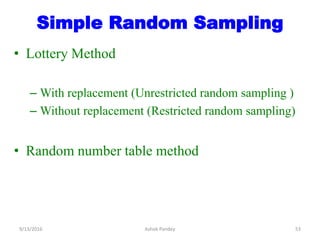
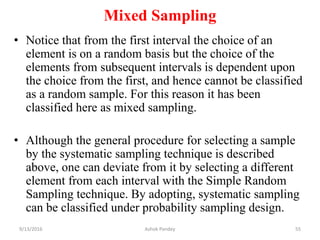

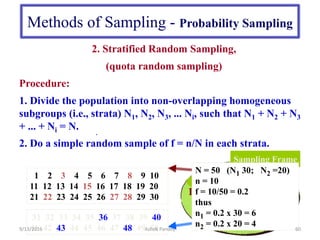
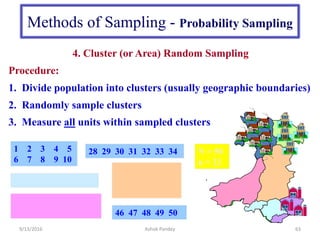
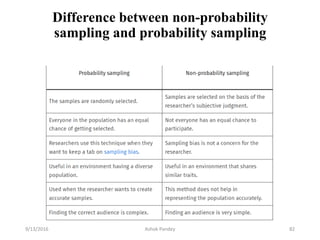
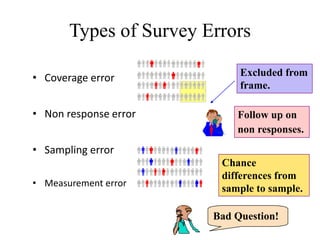
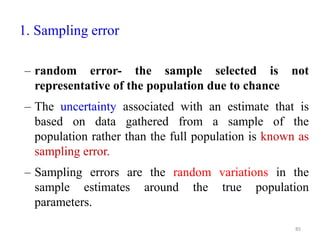
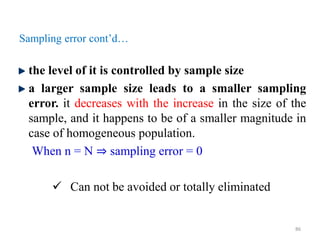
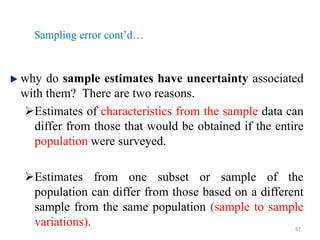
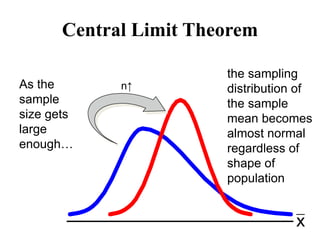
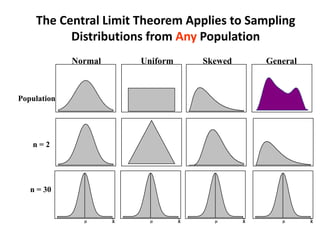

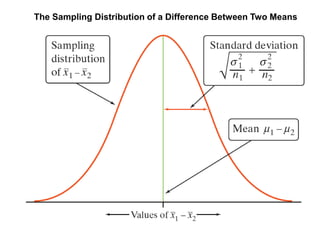
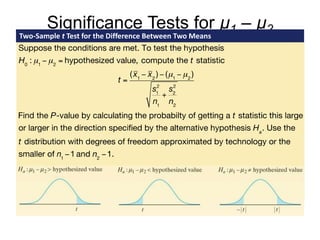
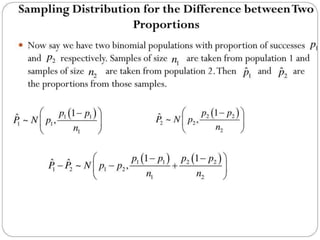

The document discusses sampling theory and methods. It describes key terms used in sampling like population, sample, and parameter. It differentiates between probability and non-probability sampling techniques. Some probability sampling techniques discussed include simple random sampling, stratified sampling, systematic sampling, cluster sampling, and multistage sampling. Non-probability sampling techniques include convenience sampling, purposive sampling, and snowball sampling. The document also covers sampling distributions, estimation, determining sample size, and probability proportionate to size sampling.


![The Employee State Insurance[ESI] Act,1948](https://cdn.slidesharecdn.com/ss_thumbnails/88da15d1-bff6-4d25-b9fd-32a6fe52ebb4-150415044419-conversion-gate01-thumbnail.jpg?width=640&height=640&fit=bounds)


![PERI-PROSTHETIC FRACTURE NAIL-PLATE CONSTRUCT [NPC].pptx](https://cdn.slidesharecdn.com/ss_thumbnails/drarunkumardrmohamedashrafperiprostheticfrasturenail-plateconstructnpc-260209164459-7e9d15a1-thumbnail.jpg?width=640&height=640&fit=bounds)


