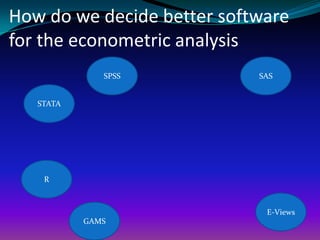
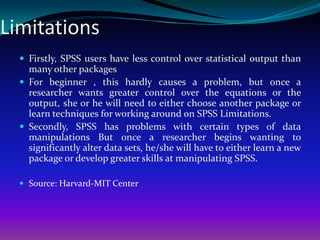
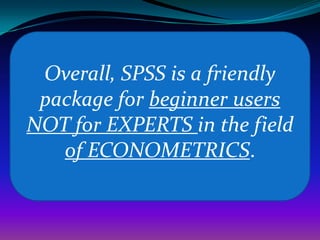
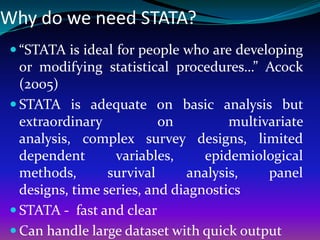
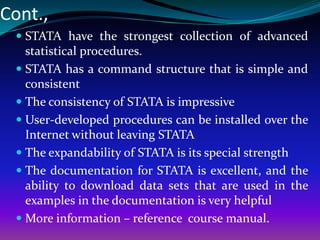
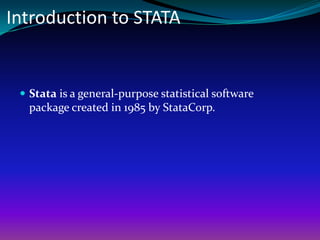
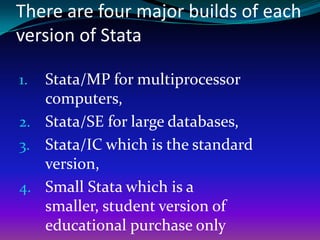
SlideShare a Scribd company logo
Srinivasulu Rajendran
Centre for the Study of Regional Development (CSRD)
School of Social Sciences (SSS)
Jawaharlal Nehru University (JNU)
New Delhi - 110067
India
r.srinivasulu@gmail.com
Objective of the session
To understand the
fundamental
knowledge of
STATA/SPSS package
1. How do we decide better
software for the econometric
analysis
2. Why do we need SPSS and
STATA?
3. Introduction to STATA/SPSS
and Differences
How do we decide better software
for the econometric analysis
STATA
E-Views
GAMS
SPSS SAS
R
It depends on
your analysis
Most preferred Packages for the
relevant analysis based on
Literature
 Descriptive Statistics - SPSS
 Cross section , Time series and panel data and
Complex Data Management system – STATA and SAS
 Advanced Econometrics analysis – STATA
 Advanced Econometrics Analysis - Linear
Programming – R
 Time series analysis - Eviews
 Qualitative Limited Dependent Variable Analysis -
STATA
Why do we need SPSS?
SPSS is the statistical
package most widely
used by political
scientists NOT by
econometrician. There
are several reasons for
why
It is easier to handle and widely used for descriptive
statistics and basic statistical analysis.
One can use it with either a Windows point-and-
click approach or through syntax (i.e., writing out of
SPSS commands). Each has its own advantages, and
the user can switch between the approaches.
Many of the widely used social science data sets
come with SPSS format; this significantly reduces the
work load for transferring the data into SPSS format.
Source: Harvard-MIT Center
Limitations
 Firstly, SPSS users have less control over statistical output than
many other packages
 For beginner , this hardly causes a problem, but once a
researcher wants greater control over the equations or the
output, she or he will need to either choose another package or
learn techniques for working around on SPSS Limitations.
 Secondly, SPSS has problems with certain types of data
manipulations But once a researcher begins wanting to
significantly alter data sets, he/she will have to either learn a new
package or develop greater skills at manipulating SPSS.
 Source: Harvard-MIT Center
Overall, SPSS is a friendly
package for beginner users
NOT for EXPERTS in the field
of ECONOMETRICS.
Why do we need STATA?
 “STATA is ideal for people who are developing
or modifying statistical procedures…” Acock
(2005)
 STATA is adequate on basic analysis but
extraordinary on multivariate
analysis, complex survey designs, limited
dependent variables, epidemiological
methods, survival analysis, panel
designs, time series, and diagnostics
 STATA - fast and clear
 Can handle large dataset with quick output
Cont.,
 STATA have the strongest collection of advanced
statistical procedures.
 STATA has a command structure that is simple and
consistent
 The consistency of STATA is impressive
 User-developed procedures can be installed over the
Internet without leaving STATA
 The expandability of STATA is its special strength
 The documentation for STATA is excellent, and the
ability to download data sets that are used in the
examples in the documentation is very helpful
 More information – reference course manual.
Introduction to SPSS
 SPSS (Statistical Package for the Social Sciences) is a
statistical analysis and data management software
package. It can generate tabulated reports, charts, and
plots of distributions and trends, descriptive
statistics, and conduct complex statistical analyses.
More details in SPSS manual
Structure of SPSS
There are six different windows that can be opened when
using SPSS. (Ref:details Babu and Sanyal, 2009 and
SPSS guide 17.0)
1. Data Editor,
2. Output Navigator,
3. The Pivot Table Editor
4. The Chart Editor
5. The Text Output Editor and
6. The Syntax Editor.
Data Editor Window
This window contains 11 menus
such as
File, Edit, View, Data, Transfor
m, Analyze, Graphs, Utilities, A
dd-ons, Window and Help.
Open File
Data Editor
 In the Data Editor, if you put the mouse cursor on a
variable name (the column heading), a more
descriptive variable label is displayed (if a label has
been defined for that variable).
 Further, to view the label one can also choose the
“view” and “value labels”. Descriptive value labels are
now displayed to make it easier to interpret the
responses.
Output Navigator or Viewer
 The Output Navigator window displays the statistical
results, tables, and charts from the analysis you
performed.
 An Output Navigator window opens automatically
when you run a procedure that generates output
 In the Output Navigator windows, you can
edit, move, delete and copy your results in a Microsoft
Explorer-like environment.
 Running a Analysis
The Syntax Editor
 Creating and Data manipulation – Defining
variables, Reading data, Transforming data and
Creating tables
Introduction to STATA
 Stata is a general-purpose statistical software
package created in 1985 by StataCorp.
There are four major builds of each
version of Stata
1. Stata/MP for multiprocessor
computers,
2. Stata/SE for large databases,
3. Stata/IC which is the standard
version,
4. Small Stata which is a
smaller, student version of
educational purchase only
STATA MP
Stata/MP is the fastest and
largest version of Stata.
Stata/SE, Stata/IC, and Small
Stata differ only in the
dataset size that each can
analyze.
Computer Feature
Package
Max. no. of
variables
Max. no. of
right-hand
variables
Max. no. of
observations
64-bit
version
available?
Fastest:
designed for
parallel
processing?
Platforms
Stata/MP 32,767 10,998 unlimited* Yes Yes
Windows, Mac
(64-bit Intel),
or Unix
Stata/SE 32,767 10,998 unlimited* Yes No
Windows,
Mac, or Unix
Stata/IC 2,047 798 unlimited* Yes No
Windows,
Mac, or Unix
Small Stata 99 99 1,200 Yes No
Windows,
Mac, or Unix
*The maximum number of observations is limited only by the amount of available RAM on your system.
Source: http://www.stata.com/products/which-stata-is-right-for-me/
Requirements
Package Memory Disk space
Stata/MP 512 MB 500 MB
Stata/SE 512 MB 500 MB
Stata/IC 512 MB 500 MB
Small Stata 512 MB 500 MB
Source: http://www.stata.com/products/which-stata-is-right-for-me/

More Related Content

What's hot

What is SPSS?
What is SPSS?What is SPSS?
Basics of Graphpad prism
Basics of Graphpad prismBasics of Graphpad prism
Basics of Graphpad prism
Raeed Altaee
 
Application of spss usha (1)
Application of spss usha (1)Application of spss usha (1)
Application of spss usha (1)
Rajat Kumar Pandeya
 
An introduction to spss
An introduction to spssAn introduction to spss
An introduction to spss
Shahbaz Alam
 
Data analysis
Data analysisData analysis
Data analysis
HarisRiaz25
 
Statistical software
Statistical softwareStatistical software
Statistical software
Subramani Parasuraman
 
Excel Datamining Addin Advanced
Excel Datamining Addin AdvancedExcel Datamining Addin Advanced
Excel Datamining Addin Advanced
DataminingTools Inc
 
Introduction To Spss - Opening Data File and Descriptive Analysis
Introduction To Spss - Opening Data File and Descriptive AnalysisIntroduction To Spss - Opening Data File and Descriptive Analysis
Introduction To Spss - Opening Data File and Descriptive AnalysisDr Ali Yusob Md Zain
 
Statistical software packages
Statistical software packagesStatistical software packages
Statistical software packages
Km Ashif
 
Ibm spss statistics 19 brief guide
Ibm spss statistics 19 brief guideIbm spss statistics 19 brief guide
Ibm spss statistics 19 brief guide
Marketing Utopia
 
Guide to data analytics
Guide to data analyticsGuide to data analytics
Guide to data analytics
Debashish Jana
 
SPSS
SPSSSPSS
What Is the Use of SPSS in Data Analysis
What Is the Use of SPSS in Data AnalysisWhat Is the Use of SPSS in Data Analysis
What Is the Use of SPSS in Data Analysis
SPSSResearch
 
060 techniques of_data_analysis
060 techniques of_data_analysis060 techniques of_data_analysis
060 techniques of_data_analysisNouman Zia
 
data analysis techniques and statistical softwares
data analysis techniques and statistical softwaresdata analysis techniques and statistical softwares
data analysis techniques and statistical softwares
Dr.ammara khakwani
 
Data analysis using spss
Data analysis using spssData analysis using spss
Data analysis using spss
Syed Faisal
 
Applications of sas and minitab in data analysis
Applications of sas and minitab in data analysisApplications of sas and minitab in data analysis
Applications of sas and minitab in data analysis
VeenaV29
 
Spss data analysis for univariate, bivariate and multivariate statistics by d...
Spss data analysis for univariate, bivariate and multivariate statistics by d...Spss data analysis for univariate, bivariate and multivariate statistics by d...
Spss data analysis for univariate, bivariate and multivariate statistics by d...
Dr. Sola Maitanmi
 

What's hot (19)

What is SPSS?
What is SPSS?What is SPSS?
What is SPSS?
 
Basics of Graphpad prism
Basics of Graphpad prismBasics of Graphpad prism
Basics of Graphpad prism
 
Application of spss usha (1)
Application of spss usha (1)Application of spss usha (1)
Application of spss usha (1)
 
An introduction to spss
An introduction to spssAn introduction to spss
An introduction to spss
 
Data analysis
Data analysisData analysis
Data analysis
 
Statistical software
Statistical softwareStatistical software
Statistical software
 
Excel Datamining Addin Advanced
Excel Datamining Addin AdvancedExcel Datamining Addin Advanced
Excel Datamining Addin Advanced
 
Introduction To Spss - Opening Data File and Descriptive Analysis
Introduction To Spss - Opening Data File and Descriptive AnalysisIntroduction To Spss - Opening Data File and Descriptive Analysis
Introduction To Spss - Opening Data File and Descriptive Analysis
 
Statistical software packages
Statistical software packagesStatistical software packages
Statistical software packages
 
Ibm spss statistics 19 brief guide
Ibm spss statistics 19 brief guideIbm spss statistics 19 brief guide
Ibm spss statistics 19 brief guide
 
Guide to data analytics
Guide to data analyticsGuide to data analytics
Guide to data analytics
 
SPSS
SPSSSPSS
SPSS
 
What Is the Use of SPSS in Data Analysis
What Is the Use of SPSS in Data AnalysisWhat Is the Use of SPSS in Data Analysis
What Is the Use of SPSS in Data Analysis
 
060 techniques of_data_analysis
060 techniques of_data_analysis060 techniques of_data_analysis
060 techniques of_data_analysis
 
data analysis techniques and statistical softwares
data analysis techniques and statistical softwaresdata analysis techniques and statistical softwares
data analysis techniques and statistical softwares
 
Data analysis using spss
Data analysis using spssData analysis using spss
Data analysis using spss
 
Applications of sas and minitab in data analysis
Applications of sas and minitab in data analysisApplications of sas and minitab in data analysis
Applications of sas and minitab in data analysis
 
Spss data analysis for univariate, bivariate and multivariate statistics by d...
Spss data analysis for univariate, bivariate and multivariate statistics by d...Spss data analysis for univariate, bivariate and multivariate statistics by d...
Spss data analysis for univariate, bivariate and multivariate statistics by d...
 
Spss an introduction
Spss  an introductionSpss  an introduction
Spss an introduction
 

Similar to Topic 4 intro spss_stata

SPSS.pptx
SPSS.pptxSPSS.pptx
Uses of SPSS and Excel to analyze data
Uses of SPSS and Excel   to analyze dataUses of SPSS and Excel   to analyze data
Uses of SPSS and Excel to analyze data
Kudrat-E- Khoda(Prince)
 
Presentation on spss
Presentation on spssPresentation on spss
Presentation on spss
alfiyajamalcj
 
Spss
SpssSpss
Pasw statistics 18 brief guide
Pasw statistics 18 brief guidePasw statistics 18 brief guide
Pasw statistics 18 brief guide
TRPC
 
N06 spss introdu
N06 spss introduN06 spss introdu
N06 spss introdu
Raj Kumar
 
Topic 4 intro spss_stata 30032012 sy_srini
Topic 4 intro spss_stata 30032012 sy_sriniTopic 4 intro spss_stata 30032012 sy_srini
Topic 4 intro spss_stata 30032012 sy_sriniSM Lalon
 
SPSS vs Stata: The Best Ever Comparison
SPSS vs Stata: The Best Ever ComparisonSPSS vs Stata: The Best Ever Comparison
SPSS vs Stata: The Best Ever Comparison
Stat Analytica
 
SPSS vs Stata: All You need to Know
SPSS vs Stata: All You need to KnowSPSS vs Stata: All You need to Know
SPSS vs Stata: All You need to Know
Stat Analytica
 
Computer assistance in statistical methods.28.04.2021
Computer assistance in statistical methods.28.04.2021Computer assistance in statistical methods.28.04.2021
Computer assistance in statistical methods.28.04.2021
DrAnjaliUpadhye
 
An Introduction To Statistical Package For The Social Sciences
An Introduction To Statistical Package For The Social SciencesAn Introduction To Statistical Package For The Social Sciences
An Introduction To Statistical Package For The Social Sciences
Andrea Porter
 
6. An Introduction To Statistical Package For The Social Sciences
6. An Introduction To Statistical Package For The Social Sciences6. An Introduction To Statistical Package For The Social Sciences
6. An Introduction To Statistical Package For The Social Sciences
Allison Thompson
 
Educ 190_Data Analysis and Collection Tools
Educ 190_Data Analysis and Collection ToolsEduc 190_Data Analysis and Collection Tools
Educ 190_Data Analysis and Collection ToolsTeacher Pauline
 
Evaluation Spss
Evaluation SpssEvaluation Spss
Evaluation Spssjackng
 
SEM 8 BIOSTATISTICS graphs minitab excel etc
SEM 8 BIOSTATISTICS graphs minitab excel etcSEM 8 BIOSTATISTICS graphs minitab excel etc
SEM 8 BIOSTATISTICS graphs minitab excel etc
KaishAamirPathan
 
SOFTWARE USED IN P'epidemiology.pdf
SOFTWARE USED IN P'epidemiology.pdfSOFTWARE USED IN P'epidemiology.pdf
SOFTWARE USED IN P'epidemiology.pdf
varshawadnere
 
whitepaper_advanced_analytics_with_tableau_eng
whitepaper_advanced_analytics_with_tableau_engwhitepaper_advanced_analytics_with_tableau_eng
whitepaper_advanced_analytics_with_tableau_engS. Hanau
 
Data processing & Analysis: SPSS an overview
Data processing & Analysis: SPSS an overviewData processing & Analysis: SPSS an overview
Data processing & Analysis: SPSS an overview
ATHUL RAVI
 

Similar to Topic 4 intro spss_stata (20)

SPSS.pptx
SPSS.pptxSPSS.pptx
SPSS.pptx
 
Uses of SPSS and Excel to analyze data
Uses of SPSS and Excel   to analyze dataUses of SPSS and Excel   to analyze data
Uses of SPSS and Excel to analyze data
 
Presentation on spss
Presentation on spssPresentation on spss
Presentation on spss
 
Spss
SpssSpss
Spss
 
Pasw statistics 18 brief guide
Pasw statistics 18 brief guidePasw statistics 18 brief guide
Pasw statistics 18 brief guide
 
Spss
SpssSpss
Spss
 
N06 spss introdu
N06 spss introduN06 spss introdu
N06 spss introdu
 
Topic 4 intro spss_stata 30032012 sy_srini
Topic 4 intro spss_stata 30032012 sy_sriniTopic 4 intro spss_stata 30032012 sy_srini
Topic 4 intro spss_stata 30032012 sy_srini
 
SPSS vs Stata: The Best Ever Comparison
SPSS vs Stata: The Best Ever ComparisonSPSS vs Stata: The Best Ever Comparison
SPSS vs Stata: The Best Ever Comparison
 
SPSS vs Stata: All You need to Know
SPSS vs Stata: All You need to KnowSPSS vs Stata: All You need to Know
SPSS vs Stata: All You need to Know
 
Computer assistance in statistical methods.28.04.2021
Computer assistance in statistical methods.28.04.2021Computer assistance in statistical methods.28.04.2021
Computer assistance in statistical methods.28.04.2021
 
An Introduction To Statistical Package For The Social Sciences
An Introduction To Statistical Package For The Social SciencesAn Introduction To Statistical Package For The Social Sciences
An Introduction To Statistical Package For The Social Sciences
 
6. An Introduction To Statistical Package For The Social Sciences
6. An Introduction To Statistical Package For The Social Sciences6. An Introduction To Statistical Package For The Social Sciences
6. An Introduction To Statistical Package For The Social Sciences
 
SPSS
SPSSSPSS
SPSS
 
Educ 190_Data Analysis and Collection Tools
Educ 190_Data Analysis and Collection ToolsEduc 190_Data Analysis and Collection Tools
Educ 190_Data Analysis and Collection Tools
 
Evaluation Spss
Evaluation SpssEvaluation Spss
Evaluation Spss
 
SEM 8 BIOSTATISTICS graphs minitab excel etc
SEM 8 BIOSTATISTICS graphs minitab excel etcSEM 8 BIOSTATISTICS graphs minitab excel etc
SEM 8 BIOSTATISTICS graphs minitab excel etc
 
SOFTWARE USED IN P'epidemiology.pdf
SOFTWARE USED IN P'epidemiology.pdfSOFTWARE USED IN P'epidemiology.pdf
SOFTWARE USED IN P'epidemiology.pdf
 
whitepaper_advanced_analytics_with_tableau_eng
whitepaper_advanced_analytics_with_tableau_engwhitepaper_advanced_analytics_with_tableau_eng
whitepaper_advanced_analytics_with_tableau_eng
 
Data processing & Analysis: SPSS an overview
Data processing & Analysis: SPSS an overviewData processing & Analysis: SPSS an overview
Data processing & Analysis: SPSS an overview
 

More from SM Lalon

Unicef guideline for monitoring and evaluation
Unicef guideline for monitoring and evaluationUnicef guideline for monitoring and evaluation
Unicef guideline for monitoring and evaluationSM Lalon
 
Nutrition guide to data-collection,interpretation,analysis
Nutrition guide to data-collection,interpretation,analysisNutrition guide to data-collection,interpretation,analysis
Nutrition guide to data-collection,interpretation,analysisSM Lalon
 
Anthropometric measuring guide
Anthropometric measuring guideAnthropometric measuring guide
Anthropometric measuring guideSM Lalon
 
Strengthing capacity to improve nutrition
Strengthing capacity to improve nutritionStrengthing capacity to improve nutrition
Strengthing capacity to improve nutritionSM Lalon
 
Nutrition program design and planning
Nutrition program design and planningNutrition program design and planning
Nutrition program design and planningSM Lalon
 
Project development and planning
Project development and planningProject development and planning
Project development and planning
SM Lalon
 
Unicef guideline for monitoring and evaluation
Unicef guideline for monitoring and evaluationUnicef guideline for monitoring and evaluation
Unicef guideline for monitoring and evaluation
SM Lalon
 
Nutrition program design and planning
Nutrition program design and planningNutrition program design and planning
Nutrition program design and planningSM Lalon
 
Nutrition careers
Nutrition careersNutrition careers
Nutrition careersSM Lalon
 
Bangladesh
BangladeshBangladesh
BangladeshSM Lalon
 
Community safeguarding shushamaj
Community safeguarding shushamajCommunity safeguarding shushamaj
Community safeguarding shushamajSM Lalon
 
Fp monitoring 2001_a1_frep_11_en
Fp monitoring 2001_a1_frep_11_enFp monitoring 2001_a1_frep_11_en
Fp monitoring 2001_a1_frep_11_enSM Lalon
 
Food security and economic development
Food security and economic developmentFood security and economic development
Food security and economic developmentSM Lalon
 
Cmam t ph1_v1
Cmam t ph1_v1Cmam t ph1_v1
Cmam t ph1_v1SM Lalon
 
Key word for ielts writing
Key word for ielts writingKey word for ielts writing
Key word for ielts writingSM Lalon
 
English grammar part 3{mob}(bcs,job,university exam)
English grammar part 3{mob}(bcs,job,university exam)English grammar part 3{mob}(bcs,job,university exam)
English grammar part 3{mob}(bcs,job,university exam)SM Lalon
 
Ielts speaking topics
Ielts speaking topicsIelts speaking topics
Ielts speaking topicsSM Lalon
 
Ielts listening
Ielts listeningIelts listening
Ielts listeningSM Lalon
 

More from SM Lalon (20)

Unicef guideline for monitoring and evaluation
Unicef guideline for monitoring and evaluationUnicef guideline for monitoring and evaluation
Unicef guideline for monitoring and evaluation
 
Nutrition guide to data-collection,interpretation,analysis
Nutrition guide to data-collection,interpretation,analysisNutrition guide to data-collection,interpretation,analysis
Nutrition guide to data-collection,interpretation,analysis
 
Anthropometric measuring guide
Anthropometric measuring guideAnthropometric measuring guide
Anthropometric measuring guide
 
Strengthing capacity to improve nutrition
Strengthing capacity to improve nutritionStrengthing capacity to improve nutrition
Strengthing capacity to improve nutrition
 
Nutrition program design and planning
Nutrition program design and planningNutrition program design and planning
Nutrition program design and planning
 
Project development and planning
Project development and planningProject development and planning
Project development and planning
 
Unicef guideline for monitoring and evaluation
Unicef guideline for monitoring and evaluationUnicef guideline for monitoring and evaluation
Unicef guideline for monitoring and evaluation
 
Nutrition program design and planning
Nutrition program design and planningNutrition program design and planning
Nutrition program design and planning
 
Nutrition careers
Nutrition careersNutrition careers
Nutrition careers
 
Mch
MchMch
Mch
 
Bangladesh
BangladeshBangladesh
Bangladesh
 
Community safeguarding shushamaj
Community safeguarding shushamajCommunity safeguarding shushamaj
Community safeguarding shushamaj
 
Fp monitoring 2001_a1_frep_11_en
Fp monitoring 2001_a1_frep_11_enFp monitoring 2001_a1_frep_11_en
Fp monitoring 2001_a1_frep_11_en
 
Food security and economic development
Food security and economic developmentFood security and economic development
Food security and economic development
 
Cmam t ph1_v1
Cmam t ph1_v1Cmam t ph1_v1
Cmam t ph1_v1
 
Key word for ielts writing
Key word for ielts writingKey word for ielts writing
Key word for ielts writing
 
Cos
CosCos
Cos
 
English grammar part 3{mob}(bcs,job,university exam)
English grammar part 3{mob}(bcs,job,university exam)English grammar part 3{mob}(bcs,job,university exam)
English grammar part 3{mob}(bcs,job,university exam)
 
Ielts speaking topics
Ielts speaking topicsIelts speaking topics
Ielts speaking topics
 
Ielts listening
Ielts listeningIelts listening
Ielts listening
 

Recently uploaded

National Security Agency - NSA mobile device best practices
National Security Agency - NSA mobile device best practicesNational Security Agency - NSA mobile device best practices
National Security Agency - NSA mobile device best practices
Quotidiano Piemontese
 
Elizabeth Buie - Older adults: Are we really designing for our future selves?
Elizabeth Buie - Older adults: Are we really designing for our future selves?Elizabeth Buie - Older adults: Are we really designing for our future selves?
Elizabeth Buie - Older adults: Are we really designing for our future selves?
Nexer Digital
 
Microsoft - Power Platform_G.Aspiotis.pdf
Microsoft - Power Platform_G.Aspiotis.pdfMicrosoft - Power Platform_G.Aspiotis.pdf
Microsoft - Power Platform_G.Aspiotis.pdf
Uni Systems S.M.S.A.
 
GridMate - End to end testing is a critical piece to ensure quality and avoid...
GridMate - End to end testing is a critical piece to ensure quality and avoid...GridMate - End to end testing is a critical piece to ensure quality and avoid...
GridMate - End to end testing is a critical piece to ensure quality and avoid...
ThomasParaiso2
 
Generative AI Deep Dive: Advancing from Proof of Concept to Production
Generative AI Deep Dive: Advancing from Proof of Concept to ProductionGenerative AI Deep Dive: Advancing from Proof of Concept to Production
Generative AI Deep Dive: Advancing from Proof of Concept to Production
Aggregage
 
The Future of Platform Engineering
The Future of Platform EngineeringThe Future of Platform Engineering
The Future of Platform Engineering
Jemma Hussein Allen
 
State of ICS and IoT Cyber Threat Landscape Report 2024 preview
State of ICS and IoT Cyber Threat Landscape Report 2024 previewState of ICS and IoT Cyber Threat Landscape Report 2024 preview
State of ICS and IoT Cyber Threat Landscape Report 2024 preview
Prayukth K V
 
Why You Should Replace Windows 11 with Nitrux Linux 3.5.0 for enhanced perfor...
Why You Should Replace Windows 11 with Nitrux Linux 3.5.0 for enhanced perfor...Why You Should Replace Windows 11 with Nitrux Linux 3.5.0 for enhanced perfor...
Why You Should Replace Windows 11 with Nitrux Linux 3.5.0 for enhanced perfor...
SOFTTECHHUB
 
The Art of the Pitch: WordPress Relationships and Sales
The Art of the Pitch: WordPress Relationships and SalesThe Art of the Pitch: WordPress Relationships and Sales
The Art of the Pitch: WordPress Relationships and Sales
Laura Byrne
 
Pushing the limits of ePRTC: 100ns holdover for 100 days
Pushing the limits of ePRTC: 100ns holdover for 100 daysPushing the limits of ePRTC: 100ns holdover for 100 days
Pushing the limits of ePRTC: 100ns holdover for 100 days
Adtran
 
Introduction to CHERI technology - Cybersecurity
Introduction to CHERI technology - CybersecurityIntroduction to CHERI technology - Cybersecurity
Introduction to CHERI technology - Cybersecurity
mikeeftimakis1
 
Observability Concepts EVERY Developer Should Know -- DeveloperWeek Europe.pdf
Observability Concepts EVERY Developer Should Know -- DeveloperWeek Europe.pdfObservability Concepts EVERY Developer Should Know -- DeveloperWeek Europe.pdf
Observability Concepts EVERY Developer Should Know -- DeveloperWeek Europe.pdf
Paige Cruz
 
Video Streaming: Then, Now, and in the Future
Video Streaming: Then, Now, and in the FutureVideo Streaming: Then, Now, and in the Future
Video Streaming: Then, Now, and in the Future
Alpen-Adria-Universität
 
Alt. GDG Cloud Southlake #33: Boule & Rebala: Effective AppSec in SDLC using ...
Alt. GDG Cloud Southlake #33: Boule & Rebala: Effective AppSec in SDLC using ...Alt. GDG Cloud Southlake #33: Boule & Rebala: Effective AppSec in SDLC using ...
Alt. GDG Cloud Southlake #33: Boule & Rebala: Effective AppSec in SDLC using ...
James Anderson
 
GraphSummit Singapore | The Art of the Possible with Graph - Q2 2024
GraphSummit Singapore | The Art of the  Possible with Graph - Q2 2024GraphSummit Singapore | The Art of the  Possible with Graph - Q2 2024
GraphSummit Singapore | The Art of the Possible with Graph - Q2 2024
Neo4j
 
DevOps and Testing slides at DASA Connect
DevOps and Testing slides at DASA ConnectDevOps and Testing slides at DASA Connect
DevOps and Testing slides at DASA Connect
Kari Kakkonen
 
GDG Cloud Southlake #33: Boule & Rebala: Effective AppSec in SDLC using Deplo...
GDG Cloud Southlake #33: Boule & Rebala: Effective AppSec in SDLC using Deplo...GDG Cloud Southlake #33: Boule & Rebala: Effective AppSec in SDLC using Deplo...
GDG Cloud Southlake #33: Boule & Rebala: Effective AppSec in SDLC using Deplo...
James Anderson
 
Removing Uninteresting Bytes in Software Fuzzing
Removing Uninteresting Bytes in Software FuzzingRemoving Uninteresting Bytes in Software Fuzzing
Removing Uninteresting Bytes in Software Fuzzing
Aftab Hussain
 
PHP Frameworks: I want to break free (IPC Berlin 2024)
PHP Frameworks: I want to break free (IPC Berlin 2024)PHP Frameworks: I want to break free (IPC Berlin 2024)
PHP Frameworks: I want to break free (IPC Berlin 2024)
Ralf Eggert
 
FIDO Alliance Osaka Seminar: Passkeys and the Road Ahead.pdf
FIDO Alliance Osaka Seminar: Passkeys and the Road Ahead.pdfFIDO Alliance Osaka Seminar: Passkeys and the Road Ahead.pdf
FIDO Alliance Osaka Seminar: Passkeys and the Road Ahead.pdf
FIDO Alliance
 

Recently uploaded (20)

National Security Agency - NSA mobile device best practices
National Security Agency - NSA mobile device best practicesNational Security Agency - NSA mobile device best practices
National Security Agency - NSA mobile device best practices
 
Elizabeth Buie - Older adults: Are we really designing for our future selves?
Elizabeth Buie - Older adults: Are we really designing for our future selves?Elizabeth Buie - Older adults: Are we really designing for our future selves?
Elizabeth Buie - Older adults: Are we really designing for our future selves?
 
Microsoft - Power Platform_G.Aspiotis.pdf
Microsoft - Power Platform_G.Aspiotis.pdfMicrosoft - Power Platform_G.Aspiotis.pdf
Microsoft - Power Platform_G.Aspiotis.pdf
 
GridMate - End to end testing is a critical piece to ensure quality and avoid...
GridMate - End to end testing is a critical piece to ensure quality and avoid...GridMate - End to end testing is a critical piece to ensure quality and avoid...
GridMate - End to end testing is a critical piece to ensure quality and avoid...
 
Generative AI Deep Dive: Advancing from Proof of Concept to Production
Generative AI Deep Dive: Advancing from Proof of Concept to ProductionGenerative AI Deep Dive: Advancing from Proof of Concept to Production
Generative AI Deep Dive: Advancing from Proof of Concept to Production
 
The Future of Platform Engineering
The Future of Platform EngineeringThe Future of Platform Engineering
The Future of Platform Engineering
 
State of ICS and IoT Cyber Threat Landscape Report 2024 preview
State of ICS and IoT Cyber Threat Landscape Report 2024 previewState of ICS and IoT Cyber Threat Landscape Report 2024 preview
State of ICS and IoT Cyber Threat Landscape Report 2024 preview
 
Why You Should Replace Windows 11 with Nitrux Linux 3.5.0 for enhanced perfor...
Why You Should Replace Windows 11 with Nitrux Linux 3.5.0 for enhanced perfor...Why You Should Replace Windows 11 with Nitrux Linux 3.5.0 for enhanced perfor...
Why You Should Replace Windows 11 with Nitrux Linux 3.5.0 for enhanced perfor...
 
The Art of the Pitch: WordPress Relationships and Sales
The Art of the Pitch: WordPress Relationships and SalesThe Art of the Pitch: WordPress Relationships and Sales
The Art of the Pitch: WordPress Relationships and Sales
 
Pushing the limits of ePRTC: 100ns holdover for 100 days
Pushing the limits of ePRTC: 100ns holdover for 100 daysPushing the limits of ePRTC: 100ns holdover for 100 days
Pushing the limits of ePRTC: 100ns holdover for 100 days
 
Introduction to CHERI technology - Cybersecurity
Introduction to CHERI technology - CybersecurityIntroduction to CHERI technology - Cybersecurity
Introduction to CHERI technology - Cybersecurity
 
Observability Concepts EVERY Developer Should Know -- DeveloperWeek Europe.pdf
Observability Concepts EVERY Developer Should Know -- DeveloperWeek Europe.pdfObservability Concepts EVERY Developer Should Know -- DeveloperWeek Europe.pdf
Observability Concepts EVERY Developer Should Know -- DeveloperWeek Europe.pdf
 
Video Streaming: Then, Now, and in the Future
Video Streaming: Then, Now, and in the FutureVideo Streaming: Then, Now, and in the Future
Video Streaming: Then, Now, and in the Future
 
Alt. GDG Cloud Southlake #33: Boule & Rebala: Effective AppSec in SDLC using ...
Alt. GDG Cloud Southlake #33: Boule & Rebala: Effective AppSec in SDLC using ...Alt. GDG Cloud Southlake #33: Boule & Rebala: Effective AppSec in SDLC using ...
Alt. GDG Cloud Southlake #33: Boule & Rebala: Effective AppSec in SDLC using ...
 
GraphSummit Singapore | The Art of the Possible with Graph - Q2 2024
GraphSummit Singapore | The Art of the  Possible with Graph - Q2 2024GraphSummit Singapore | The Art of the  Possible with Graph - Q2 2024
GraphSummit Singapore | The Art of the Possible with Graph - Q2 2024
 
DevOps and Testing slides at DASA Connect
DevOps and Testing slides at DASA ConnectDevOps and Testing slides at DASA Connect
DevOps and Testing slides at DASA Connect
 
GDG Cloud Southlake #33: Boule & Rebala: Effective AppSec in SDLC using Deplo...
GDG Cloud Southlake #33: Boule & Rebala: Effective AppSec in SDLC using Deplo...GDG Cloud Southlake #33: Boule & Rebala: Effective AppSec in SDLC using Deplo...
GDG Cloud Southlake #33: Boule & Rebala: Effective AppSec in SDLC using Deplo...
 
Removing Uninteresting Bytes in Software Fuzzing
Removing Uninteresting Bytes in Software FuzzingRemoving Uninteresting Bytes in Software Fuzzing
Removing Uninteresting Bytes in Software Fuzzing
 
PHP Frameworks: I want to break free (IPC Berlin 2024)
PHP Frameworks: I want to break free (IPC Berlin 2024)PHP Frameworks: I want to break free (IPC Berlin 2024)
PHP Frameworks: I want to break free (IPC Berlin 2024)
 
FIDO Alliance Osaka Seminar: Passkeys and the Road Ahead.pdf
FIDO Alliance Osaka Seminar: Passkeys and the Road Ahead.pdfFIDO Alliance Osaka Seminar: Passkeys and the Road Ahead.pdf
FIDO Alliance Osaka Seminar: Passkeys and the Road Ahead.pdf
 

Topic 4 intro spss_stata

  • 1. Srinivasulu Rajendran Centre for the Study of Regional Development (CSRD) School of Social Sciences (SSS) Jawaharlal Nehru University (JNU) New Delhi - 110067 India r.srinivasulu@gmail.com
  • 2. Objective of the session To understand the fundamental knowledge of STATA/SPSS package
  • 3. 1. How do we decide better software for the econometric analysis 2. Why do we need SPSS and STATA? 3. Introduction to STATA/SPSS and Differences
  • 4. How do we decide better software for the econometric analysis STATA E-Views GAMS SPSS SAS R
  • 6. Most preferred Packages for the relevant analysis based on Literature  Descriptive Statistics - SPSS  Cross section , Time series and panel data and Complex Data Management system – STATA and SAS  Advanced Econometrics analysis – STATA  Advanced Econometrics Analysis - Linear Programming – R  Time series analysis - Eviews  Qualitative Limited Dependent Variable Analysis - STATA
  • 7. Why do we need SPSS? SPSS is the statistical package most widely used by political scientists NOT by econometrician. There are several reasons for why
  • 8. It is easier to handle and widely used for descriptive statistics and basic statistical analysis. One can use it with either a Windows point-and- click approach or through syntax (i.e., writing out of SPSS commands). Each has its own advantages, and the user can switch between the approaches. Many of the widely used social science data sets come with SPSS format; this significantly reduces the work load for transferring the data into SPSS format. Source: Harvard-MIT Center
  • 9. Limitations  Firstly, SPSS users have less control over statistical output than many other packages  For beginner , this hardly causes a problem, but once a researcher wants greater control over the equations or the output, she or he will need to either choose another package or learn techniques for working around on SPSS Limitations.  Secondly, SPSS has problems with certain types of data manipulations But once a researcher begins wanting to significantly alter data sets, he/she will have to either learn a new package or develop greater skills at manipulating SPSS.  Source: Harvard-MIT Center
  • 10. Overall, SPSS is a friendly package for beginner users NOT for EXPERTS in the field of ECONOMETRICS.
  • 11. Why do we need STATA?  “STATA is ideal for people who are developing or modifying statistical procedures…” Acock (2005)  STATA is adequate on basic analysis but extraordinary on multivariate analysis, complex survey designs, limited dependent variables, epidemiological methods, survival analysis, panel designs, time series, and diagnostics  STATA - fast and clear  Can handle large dataset with quick output
  • 12. Cont.,  STATA have the strongest collection of advanced statistical procedures.  STATA has a command structure that is simple and consistent  The consistency of STATA is impressive  User-developed procedures can be installed over the Internet without leaving STATA  The expandability of STATA is its special strength  The documentation for STATA is excellent, and the ability to download data sets that are used in the examples in the documentation is very helpful  More information – reference course manual.
  • 13. Introduction to SPSS  SPSS (Statistical Package for the Social Sciences) is a statistical analysis and data management software package. It can generate tabulated reports, charts, and plots of distributions and trends, descriptive statistics, and conduct complex statistical analyses. More details in SPSS manual
  • 14. Structure of SPSS There are six different windows that can be opened when using SPSS. (Ref:details Babu and Sanyal, 2009 and SPSS guide 17.0) 1. Data Editor, 2. Output Navigator, 3. The Pivot Table Editor 4. The Chart Editor 5. The Text Output Editor and 6. The Syntax Editor.
  • 16. This window contains 11 menus such as File, Edit, View, Data, Transfor m, Analyze, Graphs, Utilities, A dd-ons, Window and Help.
  • 18. Data Editor  In the Data Editor, if you put the mouse cursor on a variable name (the column heading), a more descriptive variable label is displayed (if a label has been defined for that variable).  Further, to view the label one can also choose the “view” and “value labels”. Descriptive value labels are now displayed to make it easier to interpret the responses.
  • 19. Output Navigator or Viewer  The Output Navigator window displays the statistical results, tables, and charts from the analysis you performed.  An Output Navigator window opens automatically when you run a procedure that generates output  In the Output Navigator windows, you can edit, move, delete and copy your results in a Microsoft Explorer-like environment.  Running a Analysis
  • 20.
  • 22.  Creating and Data manipulation – Defining variables, Reading data, Transforming data and Creating tables
  • 23. Introduction to STATA  Stata is a general-purpose statistical software package created in 1985 by StataCorp.
  • 24. There are four major builds of each version of Stata 1. Stata/MP for multiprocessor computers, 2. Stata/SE for large databases, 3. Stata/IC which is the standard version, 4. Small Stata which is a smaller, student version of educational purchase only
  • 25. STATA MP Stata/MP is the fastest and largest version of Stata. Stata/SE, Stata/IC, and Small Stata differ only in the dataset size that each can analyze.
  • 26. Computer Feature Package Max. no. of variables Max. no. of right-hand variables Max. no. of observations 64-bit version available? Fastest: designed for parallel processing? Platforms Stata/MP 32,767 10,998 unlimited* Yes Yes Windows, Mac (64-bit Intel), or Unix Stata/SE 32,767 10,998 unlimited* Yes No Windows, Mac, or Unix Stata/IC 2,047 798 unlimited* Yes No Windows, Mac, or Unix Small Stata 99 99 1,200 Yes No Windows, Mac, or Unix *The maximum number of observations is limited only by the amount of available RAM on your system. Source: http://www.stata.com/products/which-stata-is-right-for-me/
  • 27. Requirements Package Memory Disk space Stata/MP 512 MB 500 MB Stata/SE 512 MB 500 MB Stata/IC 512 MB 500 MB Small Stata 512 MB 500 MB Source: http://www.stata.com/products/which-stata-is-right-for-me/