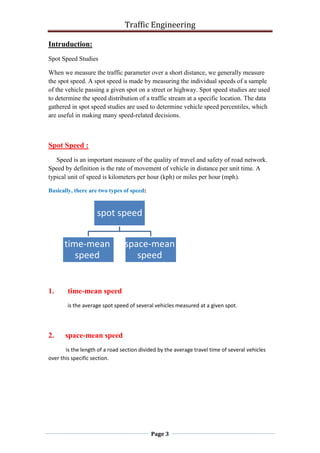
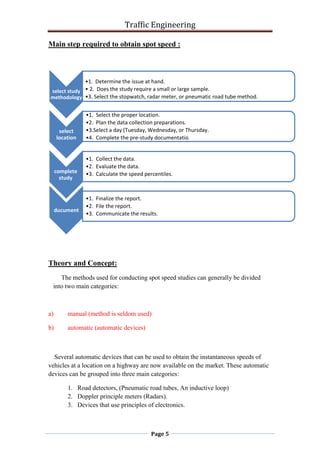
.
UNIVERSITY OF DUHOK
COLLEGE OF ENGINEERING
CIVIL ENGINEERING DEPARTIMENT
TRAFFIC ENGINEERING
Report about
Prepared by : Mylan Nejyar
Civil Engineering forth stage
Subject : Spot speed
Spot Speed
Traffic Engineering
Page 2
Contents
1- Introduction……………………………………………………3
2- Purpose of the Sopt Speed Studies……………………………4
3- Speed characteristics from a spot speed study…………………4
4- Main step required to obtain spot speed……………………….5
5- Theory and Concepts…………………………………………..5
6-Data Collection and Methodology……………..………………6
7- Methods of Measurement………………………………….6-7
 Pavement markings……………………………………….6
 Enoscope or Mirror box…………………………………..7
 Road Detector (Pressure contact strips)………………….7
 Doppler-Principle Meters (Radar)……………………….7
 Electronic-Principle Detectors (Photograp)………………7
8- Data Presentation……………………………………………8
 Frequency Distribution Table…………………………….8
 Frequency Distribution curvy…………………………….8
 Cumulative Frequency Distribution Curve………………8
9- Calculation……………………………………………...9-12
Traffic Engineering
Page 3
Intruduction:
Spot Speed Studies
When we measure the traffic parameter over a short distance, we generally measure
the spot speed. A spot speed is made by measuring the individual speeds of a sample
of the vehicle passing a given spot on a street or highway. Spot speed studies are used
to determine the speed distribution of a traffic stream at a specific location. The data
gathered in spot speed studies are used to determine vehicle speed percentiles, which
are useful in making many speed-related decisions.
Spot Speed :
Speed is an important measure of the quality of travel and safety of road network.
Speed by definition is the rate of movement of vehicle in distance per unit time. A
typical unit of speed is kilometers per hour (kph) or miles per hour (mph(.
Basically, there are two types of speed:
1. time-mean speed
is the average spot speed of several vehicles measured at a given spot.
2. space-mean speed
is the length of a road section divided by the average travel time of several vehicles
over this specific section.
spot speed
time-mean
speed
space-mean
speed
Traffic Engineering
Page 4
Purpose of the Sopt Speed Studies:
Typical purposes of speed studies
1. Speed trends over time.
2. Traffic control planning.
3. Before-and-after studies.
4. Crash analysis.
5. Geometric design.
6. Research studies.
. During the period of the national maximum speed limit, states monitored speeds on
their roads on a periodic basis Speed data are needed for traffic signal warrant
analysis, and for planning residential area traffic controls Before-and-after speed
studies are undertaken to determine if changes in roadway design or operation have
altered vehicle speeds Speed may contribute to crash frequency and it certainly
contributes to crash severity. Speed studies may be performed at high accident
locations; however, a finding of higher speeds at such a spot does not mean that the
speeds of actual crash-involved vehicles are high Note that speed laws,
measurements, and posted limits in the US are expressed in mph. The notes and these
visual aids follow this practice. For conversion purposes, 1 mph = 1 km/h.
Speed characteristics from a spot speed study may be used to:
1. Establish parameters for traffic operation and control, such as speed zones,
speed limit (85th
percentile speed is commonly used as the speed limit on a
road), and passing restriction.
2. Evaluate the effectiveness of traffic control devices, such as variable message
signs at work zones.
3. Monitor the effect of speed enforcement programs such as the use of drone
radar and the use of differential speed limits for passenger cars and trucks.
4. Evaluate and or determine the adequacy of highway geometric characteristics
such as radii of horizontal curves and lengths of vertical curves
5. Evaluate the effect of speed on highway safety through the analysis of crash
data for different speed characteristics Determine speed trends
6. Determine whether complaints about speeding are valid
Traffic Engineering
Page 5
Main step required to obtain spot speed :
Theory and Concept:
The methods used for conducting spot speed studies can generally be divided
into two main categories:
a) manual (method is seldom used)
b) automatic (automatic devices)
Several automatic devices that can be used to obtain the instantaneous speeds of
vehicles at a location on a highway are now available on the market. These automatic
devices can be grouped into three main categories:
1. Road detectors, (Pneumatic road tubes, An inductive loop)
2. Doppler principle meters (Radars).
3. Devices that use principles of electronics.
select study
methodology
•1. Determine the issue at hand.
• 2. Does the study require a small or large sample.
•3. Select the stopwatch, radar meter, or pneumatic road tube method.
select
location
•1. Select the proper location.
•2. Plan the data collection preparations.
•3.Select a day (Tuesday, Wednesday, or Thursday.
•4. Complete the pre-study documentatio.
complete
study
•1. Collect the data.
•2. Evaluate the data.
•3. Calculate the speed percentiles.
ducument
•1. Finalize the report.
•2. File the report.
•3. Communicate the results.
Traffic Engineering
Page 6
Data Collection and methodology :
1- The data is normally based on randomly sampling individual vehicle speed
over short time period, d It depends on observing the time required by vehicle
to cover a short distance of roadway
Requirement:
• Stop watch.
•Measuring tab.
Limitations :
• Number of vehicles on the sample ≥ 100 veh .
•Distance between the two specified points ≥ 100 m .
2 -Plot the frequency and the cumulative frequency distribution of the speed data.
3 -Calculate the: - Average Speed. - Median Speed. - Modal Speed. - The 85th and 15th
percentile speed. - Pace Speed. - Standard Deviation .
4 -Check whether the speed distribution is reasonably normal.
Methods of Measurement
Methods of conducting spot speed Studies are divided into two main categories: Manual and
Automatic. Spot speeds may be estimated by manually measuring the time it takes a vehicle
to travel between two defined points on the roadway a known distance apart (short
distance,)usually less than 90m. Distance between two points is generally depending upon
the averagespeed of traffic stream. Following tables gives recommended study length (in
meters) for variousaverage stream speed ranges (in kmph) Following are the some methods
to measure spot speed. of vehicles in a traffic stream, in which first two are manual methods
and other are automatic:
1-Pavement markings
In this method, markings of pavement are placed across the road at each end of trap. The
observer start and stops the watch as vehicle passes lines. In this method, minimum two
observers required to collect the data, of which one is stand at the starting point to start and
stop the stop watch and other one is stand at end point to give indication to stop the watch
when vehicle passes the end line. Advantages of this method are that after the initial
installation no set-uptime is required, markings are easily renewed, and disadvantage of this
is that substantial error, is only applicable for low traffic conditions.
Traffic Engineering
Page 7
2-Enoscope or Mirror box
Enoscope consists of a simple open housing containing a mirror mounted on a tripod at
theside of the road in such a way that an observer’s line of sight turned through 90o. The
observer stands at one end of section and on the other end enoscope is placed and measure
the time taken by the vehicle to cross the section.Advantages of this method are that it
simple and eliminate the errors due to parallax and considerable time is required to time
each vehicle, which lengthen the study period and under heavy traffic condition it may be
difficult to relate ostentatious to proper vehicle are the disadvantages of enoscope method.
3- Road Detector (Pressure contact strips(
Pressure contact strips, either pneumatic or electric, can be used to avoid error due to
parallax and due to manually starting and stopping the chronometer or stopwatch. This is
the best method over short distance it gives quite relevant data and if it is connected
through graphical recorder then it gives continuous data automatically.
4-Doppler-Principle Meters (Radar(
This is recently developed method, it automatically records speed, employs a radar
transmitterreceiver unit. The apparatus transmits high frequency electromagnetic waves in a
narrow beam towards the moving vehicle, and reflected waves changed their length
depending up on the vehicles speed and returned to the receiving unit, through calibration
gives directly spot speed of the vehicle.
5- Electronic-Principle Detectors (Photograp)
In this method a camera records the distance moved by a vehicle in a selected short time. In
this exposure of photograph should be in a constant time interval and the distance travelled
by the vehicle is measured by projecting the films during the exposure interval. The main
advantage of method that, it gives a permanent record with 100% sample obtained. This
method is quite and generally used in developed cities. In this we can use video recorder
which give more accurate result.
Traffic Engineering
Page 8
Data Presentation
From the above methods, the collected data have to present into the some representable
form,this makes its calculation and analysis simpler and easier. The following methods to
present the spot speed data:
1-Frequency Distribution Table
After the collection of data in the given conditions, arrange the spot speed values in order to
their magnitudes. Then select an interval speed (e.g. 5 kmph) and make grouping of data
which come under this range. Now, prepare the frequency distribution table.
2- Frequency Distribution Curve
For each speed group, the % frequency of observations within the group is plotted versus
the middle (mid-mark) speed of the group(s). As shown in Fig 6.5. From this curve the modal
speed and pace of traffic flow can be determine. Generally the shape of the curve follows
the normal distribution curve, this because the most of the vehicles move on road near by
mean speed and very few deviate from mean speed.
3- Cumulative Frequency Distribution Curve
For each speed group, the % cumulative frequency of observations is plotted versus the
higher limit of the speed group. The cumulative frequency distribution curve, however,
results in a very useful plot of speed versus the percent of vehicles traveling at or below the
designated speed. For this reason, the upper limit of the speed group is used as the plotting
point. In both the distribution curve, the plots are connected by a smooth curve that
minimizes the total distance of points falling above the line and those falling below the line.
A smooth curve is defined as one without.
Traffic Engineering
Page 9
Calculation:
The calculated mean (or average) speed is used to represent the true mean value of all
vehicle speeds at that location. The accuracy of this assumption depends on the number of
vehicles in the sample. The larger the sample size, the greater the probability that the
estimated mean is not significantly different from the true mean. It is therefore necessary to
select a sample size that will give an estimated mean within acceptable error limits.
Statistical procedures are used to determine this minimum sample size. Before discussing
these procedures, it is first necessary to define certain significant values that are needed to
describe speed characteristics. They are:
1. Average Speed which is the arithmetic mean of all observed vehicle speeds (which is the
sum of all spot speeds divided by the number of recorded speeds). It is given as
∑
∑
where u = arithmetic mean
Ii = number of observations in each speed group
Uj = mid value for the ith speed group
N = number of observed values.
2. Median Speed which is the speed at the middle value in a series of spot speeds that
are arranged in ascending order. 50 percent of the speed values will be greater than the
median; 50 percent will be less than the median .
3. Modal Speed which is the speed value that occurs most frequently in a sample of
spot speeds .
4. .The ith-percentile Spot Speed which is the spot speed value below which i percent of the
vehicles travel; for example, 85th-percentile spot speed is the speed below which 85 percent
of the vehicles travel and above which 15 percent of the vehicles travel.
5. Pace Speed: the highest speed within a specific range of speeds that represents more
vehicles than in any other like range of speed. The range of speeds typically used is 10 km/h
or 10 mph. Pace –
6. Standard Deviation of Speeds which is a measure of the spread of the individual speeds. It
is estimated as
The 10 Kmh speed range representing the speeds of the largest percentage of vehicles in
the traffic stream.
√
∑
Traffic Engineering
Page
10
where S = standard deviation
u = arithmetic mean
Uj = jth observation
N = number of observation
Traffic Engineering
Page
11
Traffic Engineering
Page
12
1. Vt=
Σfi =329, Σfivi= 16461.05 ,Vt= = 50.03km/ℎ𝑟
2. The standard deviation is computed as
Sd=
Σfi × (Vi − Vt)2
= 28203.95
n-1=329-1=328 Sd2
=
Sd= 9.27 kph
3. Median speed =47.7 kPh
4. Pace = 42.6-57.6 kph
5. Modal speed = 47.45kph
6. 85% ile speed = 56.6kph
7. M Standard error of the mean is computed as
SE= SE=
ValueParameter
kph74.4Median speed
42.6-57.6 kphPace
47.45kphModal speed
45.45kphMean speed
9.27kphStandard Deviation
0.51kphStandard error
56.6kph58th percentile speed
Traffic Engineering
Page
13

Spot speed studies.ppt .mylan nejyar

  • 1.
    . UNIVERSITY OF DUHOK COLLEGEOF ENGINEERING CIVIL ENGINEERING DEPARTIMENT TRAFFIC ENGINEERING Report about Prepared by : Mylan Nejyar Civil Engineering forth stage Subject : Spot speed Spot Speed
  • 2.
    Traffic Engineering Page 2 Contents 1-Introduction……………………………………………………3 2- Purpose of the Sopt Speed Studies……………………………4 3- Speed characteristics from a spot speed study…………………4 4- Main step required to obtain spot speed……………………….5 5- Theory and Concepts…………………………………………..5 6-Data Collection and Methodology……………..………………6 7- Methods of Measurement………………………………….6-7  Pavement markings……………………………………….6  Enoscope or Mirror box…………………………………..7  Road Detector (Pressure contact strips)………………….7  Doppler-Principle Meters (Radar)……………………….7  Electronic-Principle Detectors (Photograp)………………7 8- Data Presentation……………………………………………8  Frequency Distribution Table…………………………….8  Frequency Distribution curvy…………………………….8  Cumulative Frequency Distribution Curve………………8 9- Calculation……………………………………………...9-12
  • 3.
    Traffic Engineering Page 3 Intruduction: SpotSpeed Studies When we measure the traffic parameter over a short distance, we generally measure the spot speed. A spot speed is made by measuring the individual speeds of a sample of the vehicle passing a given spot on a street or highway. Spot speed studies are used to determine the speed distribution of a traffic stream at a specific location. The data gathered in spot speed studies are used to determine vehicle speed percentiles, which are useful in making many speed-related decisions. Spot Speed : Speed is an important measure of the quality of travel and safety of road network. Speed by definition is the rate of movement of vehicle in distance per unit time. A typical unit of speed is kilometers per hour (kph) or miles per hour (mph(. Basically, there are two types of speed: 1. time-mean speed is the average spot speed of several vehicles measured at a given spot. 2. space-mean speed is the length of a road section divided by the average travel time of several vehicles over this specific section. spot speed time-mean speed space-mean speed
  • 4.
    Traffic Engineering Page 4 Purposeof the Sopt Speed Studies: Typical purposes of speed studies 1. Speed trends over time. 2. Traffic control planning. 3. Before-and-after studies. 4. Crash analysis. 5. Geometric design. 6. Research studies. . During the period of the national maximum speed limit, states monitored speeds on their roads on a periodic basis Speed data are needed for traffic signal warrant analysis, and for planning residential area traffic controls Before-and-after speed studies are undertaken to determine if changes in roadway design or operation have altered vehicle speeds Speed may contribute to crash frequency and it certainly contributes to crash severity. Speed studies may be performed at high accident locations; however, a finding of higher speeds at such a spot does not mean that the speeds of actual crash-involved vehicles are high Note that speed laws, measurements, and posted limits in the US are expressed in mph. The notes and these visual aids follow this practice. For conversion purposes, 1 mph = 1 km/h. Speed characteristics from a spot speed study may be used to: 1. Establish parameters for traffic operation and control, such as speed zones, speed limit (85th percentile speed is commonly used as the speed limit on a road), and passing restriction. 2. Evaluate the effectiveness of traffic control devices, such as variable message signs at work zones. 3. Monitor the effect of speed enforcement programs such as the use of drone radar and the use of differential speed limits for passenger cars and trucks. 4. Evaluate and or determine the adequacy of highway geometric characteristics such as radii of horizontal curves and lengths of vertical curves 5. Evaluate the effect of speed on highway safety through the analysis of crash data for different speed characteristics Determine speed trends 6. Determine whether complaints about speeding are valid
  • 5.
    Traffic Engineering Page 5 Mainstep required to obtain spot speed : Theory and Concept: The methods used for conducting spot speed studies can generally be divided into two main categories: a) manual (method is seldom used) b) automatic (automatic devices) Several automatic devices that can be used to obtain the instantaneous speeds of vehicles at a location on a highway are now available on the market. These automatic devices can be grouped into three main categories: 1. Road detectors, (Pneumatic road tubes, An inductive loop) 2. Doppler principle meters (Radars). 3. Devices that use principles of electronics. select study methodology •1. Determine the issue at hand. • 2. Does the study require a small or large sample. •3. Select the stopwatch, radar meter, or pneumatic road tube method. select location •1. Select the proper location. •2. Plan the data collection preparations. •3.Select a day (Tuesday, Wednesday, or Thursday. •4. Complete the pre-study documentatio. complete study •1. Collect the data. •2. Evaluate the data. •3. Calculate the speed percentiles. ducument •1. Finalize the report. •2. File the report. •3. Communicate the results.
  • 6.
    Traffic Engineering Page 6 DataCollection and methodology : 1- The data is normally based on randomly sampling individual vehicle speed over short time period, d It depends on observing the time required by vehicle to cover a short distance of roadway Requirement: • Stop watch. •Measuring tab. Limitations : • Number of vehicles on the sample ≥ 100 veh . •Distance between the two specified points ≥ 100 m . 2 -Plot the frequency and the cumulative frequency distribution of the speed data. 3 -Calculate the: - Average Speed. - Median Speed. - Modal Speed. - The 85th and 15th percentile speed. - Pace Speed. - Standard Deviation . 4 -Check whether the speed distribution is reasonably normal. Methods of Measurement Methods of conducting spot speed Studies are divided into two main categories: Manual and Automatic. Spot speeds may be estimated by manually measuring the time it takes a vehicle to travel between two defined points on the roadway a known distance apart (short distance,)usually less than 90m. Distance between two points is generally depending upon the averagespeed of traffic stream. Following tables gives recommended study length (in meters) for variousaverage stream speed ranges (in kmph) Following are the some methods to measure spot speed. of vehicles in a traffic stream, in which first two are manual methods and other are automatic: 1-Pavement markings In this method, markings of pavement are placed across the road at each end of trap. The observer start and stops the watch as vehicle passes lines. In this method, minimum two observers required to collect the data, of which one is stand at the starting point to start and stop the stop watch and other one is stand at end point to give indication to stop the watch when vehicle passes the end line. Advantages of this method are that after the initial installation no set-uptime is required, markings are easily renewed, and disadvantage of this is that substantial error, is only applicable for low traffic conditions.
  • 7.
    Traffic Engineering Page 7 2-Enoscopeor Mirror box Enoscope consists of a simple open housing containing a mirror mounted on a tripod at theside of the road in such a way that an observer’s line of sight turned through 90o. The observer stands at one end of section and on the other end enoscope is placed and measure the time taken by the vehicle to cross the section.Advantages of this method are that it simple and eliminate the errors due to parallax and considerable time is required to time each vehicle, which lengthen the study period and under heavy traffic condition it may be difficult to relate ostentatious to proper vehicle are the disadvantages of enoscope method. 3- Road Detector (Pressure contact strips( Pressure contact strips, either pneumatic or electric, can be used to avoid error due to parallax and due to manually starting and stopping the chronometer or stopwatch. This is the best method over short distance it gives quite relevant data and if it is connected through graphical recorder then it gives continuous data automatically. 4-Doppler-Principle Meters (Radar( This is recently developed method, it automatically records speed, employs a radar transmitterreceiver unit. The apparatus transmits high frequency electromagnetic waves in a narrow beam towards the moving vehicle, and reflected waves changed their length depending up on the vehicles speed and returned to the receiving unit, through calibration gives directly spot speed of the vehicle. 5- Electronic-Principle Detectors (Photograp) In this method a camera records the distance moved by a vehicle in a selected short time. In this exposure of photograph should be in a constant time interval and the distance travelled by the vehicle is measured by projecting the films during the exposure interval. The main advantage of method that, it gives a permanent record with 100% sample obtained. This method is quite and generally used in developed cities. In this we can use video recorder which give more accurate result.
  • 8.
    Traffic Engineering Page 8 DataPresentation From the above methods, the collected data have to present into the some representable form,this makes its calculation and analysis simpler and easier. The following methods to present the spot speed data: 1-Frequency Distribution Table After the collection of data in the given conditions, arrange the spot speed values in order to their magnitudes. Then select an interval speed (e.g. 5 kmph) and make grouping of data which come under this range. Now, prepare the frequency distribution table. 2- Frequency Distribution Curve For each speed group, the % frequency of observations within the group is plotted versus the middle (mid-mark) speed of the group(s). As shown in Fig 6.5. From this curve the modal speed and pace of traffic flow can be determine. Generally the shape of the curve follows the normal distribution curve, this because the most of the vehicles move on road near by mean speed and very few deviate from mean speed. 3- Cumulative Frequency Distribution Curve For each speed group, the % cumulative frequency of observations is plotted versus the higher limit of the speed group. The cumulative frequency distribution curve, however, results in a very useful plot of speed versus the percent of vehicles traveling at or below the designated speed. For this reason, the upper limit of the speed group is used as the plotting point. In both the distribution curve, the plots are connected by a smooth curve that minimizes the total distance of points falling above the line and those falling below the line. A smooth curve is defined as one without.
  • 9.
    Traffic Engineering Page 9 Calculation: Thecalculated mean (or average) speed is used to represent the true mean value of all vehicle speeds at that location. The accuracy of this assumption depends on the number of vehicles in the sample. The larger the sample size, the greater the probability that the estimated mean is not significantly different from the true mean. It is therefore necessary to select a sample size that will give an estimated mean within acceptable error limits. Statistical procedures are used to determine this minimum sample size. Before discussing these procedures, it is first necessary to define certain significant values that are needed to describe speed characteristics. They are: 1. Average Speed which is the arithmetic mean of all observed vehicle speeds (which is the sum of all spot speeds divided by the number of recorded speeds). It is given as ∑ ∑ where u = arithmetic mean Ii = number of observations in each speed group Uj = mid value for the ith speed group N = number of observed values. 2. Median Speed which is the speed at the middle value in a series of spot speeds that are arranged in ascending order. 50 percent of the speed values will be greater than the median; 50 percent will be less than the median . 3. Modal Speed which is the speed value that occurs most frequently in a sample of spot speeds . 4. .The ith-percentile Spot Speed which is the spot speed value below which i percent of the vehicles travel; for example, 85th-percentile spot speed is the speed below which 85 percent of the vehicles travel and above which 15 percent of the vehicles travel. 5. Pace Speed: the highest speed within a specific range of speeds that represents more vehicles than in any other like range of speed. The range of speeds typically used is 10 km/h or 10 mph. Pace – 6. Standard Deviation of Speeds which is a measure of the spread of the individual speeds. It is estimated as The 10 Kmh speed range representing the speeds of the largest percentage of vehicles in the traffic stream. √ ∑
  • 10.
    Traffic Engineering Page 10 where S= standard deviation u = arithmetic mean Uj = jth observation N = number of observation
  • 11.
  • 12.
    Traffic Engineering Page 12 1. Vt= Σfi=329, Σfivi= 16461.05 ,Vt= = 50.03km/ℎ𝑟 2. The standard deviation is computed as Sd= Σfi × (Vi − Vt)2 = 28203.95 n-1=329-1=328 Sd2 = Sd= 9.27 kph 3. Median speed =47.7 kPh 4. Pace = 42.6-57.6 kph 5. Modal speed = 47.45kph 6. 85% ile speed = 56.6kph 7. M Standard error of the mean is computed as SE= SE= ValueParameter kph74.4Median speed 42.6-57.6 kphPace 47.45kphModal speed 45.45kphMean speed 9.27kphStandard Deviation 0.51kphStandard error 56.6kph58th percentile speed
  • 13.