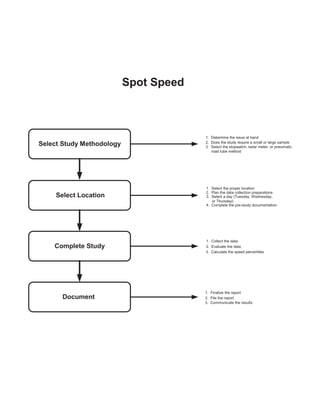
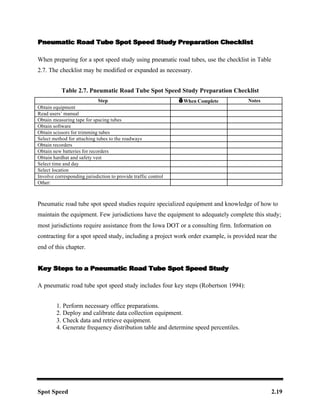
This document describes the process for conducting a spot speed study using the stopwatch method. The key steps are:
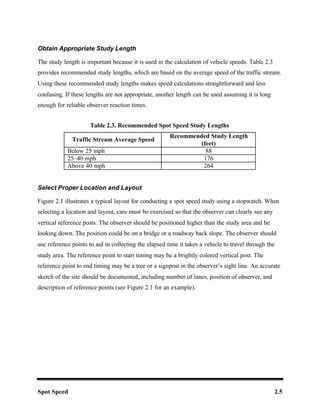
1. Determine the appropriate study length based on average traffic speed and select a proper location and layout with reference points.
2. Use a stopwatch to record the start and end times for vehicles traveling through the study area and calculate their speeds.
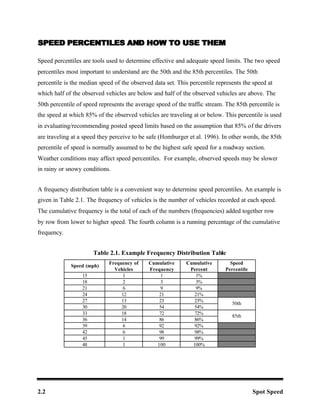
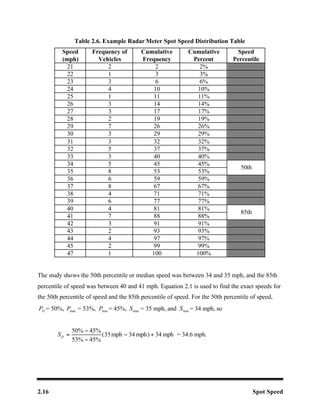
3. Input the speed data into a frequency distribution table to determine the 50th and 85th percentile speeds. These percentiles are used to evaluate speed limits and roadway designs.