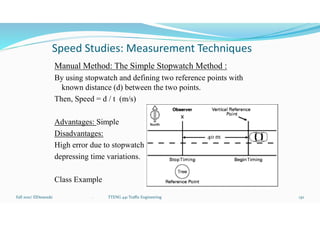
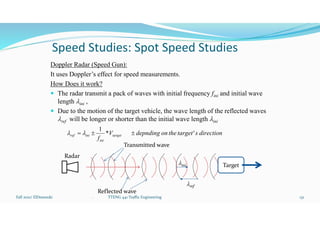
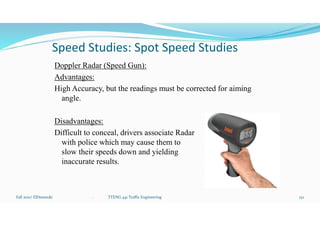
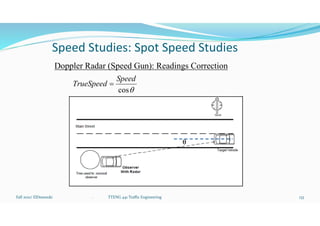
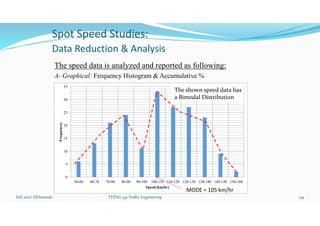
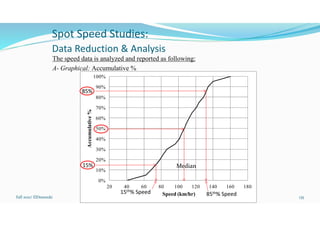
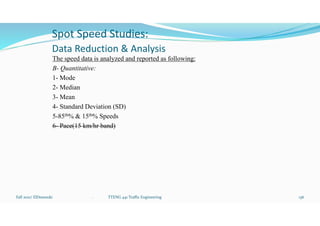
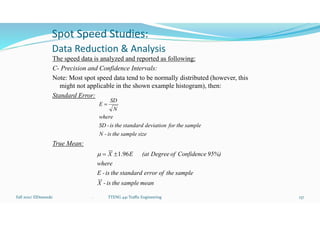
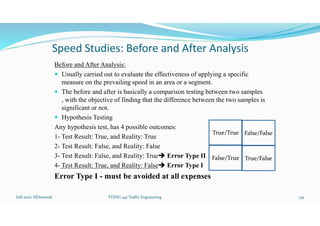
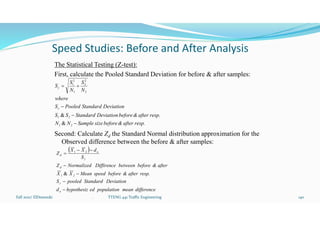
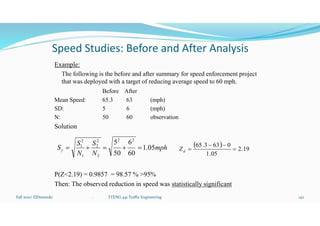
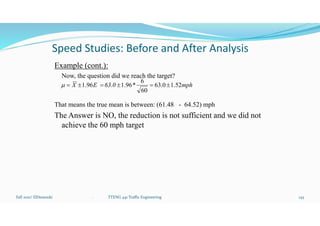
Traffic Studies: Spot speed study and analysis of speed data. Volume Studies: highway and intersection volume studies. Delay studies at signalized intersections.
In this module, we will discuss different techniques for lane management and the method for feasibility assessment.
Lane Reversal
High Occupancy Vehicle (HOV) Lane
Shoulder Lane
Tteng 441 traffic engineering fall 2021 part5Wael ElDessouki
Capacity analysis and design for signalized and un-signalized intersections. Level of Service at Signalized Intersection. Traffic control delay estimation.
Grade Separation and Weaving Segment Analysis
This module will cover the following topics:
1- Interchange Layout
2- Weaving segments analysis and Level of Service Assessment.
Conen 442 module1c: Capacity analysis and Level of ServiceWael ElDessouki
This module focuses on Capacity concepts and the Level of Service for transportation facilities. LOS analysis will be discussed for the multilane highway facility.
Two models are present, the first is point to point model and demonstrated the minimizing cost issue, while the other model is Multi-stops operating model, and it is addressing profit maximization.
Our project is the complete study about both Spot speed studies and Speed delay time survey. This topic is a part of Transportation Engineering. This report helps you to understand this topic in detail. This report will also help you to make project on associated topics in traffic engineering. In spot speed, We discussed regarding various methods available to perform the test, Our team practically performed test and established a speed limit zone near a school. Coming to speed delay time survey, we conducted a survey at a selected stretch and came out with solutions to the problems faced by the vehicle users using that stretch.
TRIP GENERATION Survey and ORIGIN / DESTINATION STUDYGrant Johnson, PE
Origin Destination Surveys OD调查…and Trip Generation Surveys…交通出行率调查
Sample Size (100 vehicles or more) of randomly selected vehicles that turned left to go south at Interchange/Intersection 8.
In this Survey:
55% of samples went south past机场高速
45% turned right onto黄山大道
Total Left Turn Vol = 1630 vph
Result: 900 vehicles (55%) go south
730 vehicles go west on黄山大道
Train Arrival Times At Highway Railroad Grade CrossingKittelson Slides
Estimating Train Arrival Times at Highway-Railroad Grade Crossing Using Multiple Sensors. By Diego B. Franca, M.Sc., Kittelson and Associates, Inc and Elizabeth “Libby” Jones, PhD
Assoc. Professor, Civil Engineering, University of Nebraska - Lincoln
Assoc. Director , Mid-America Transportation Center. Presented at 89th TRB Annual Meeting – Jan 2010.
exit exam preparatiomn Login code: 92566. Do not give this code to anyone, even if they say they are from Telegram!
This code can be used to log in to your Telegram account. We never ask it for anything else.
If you didn't request this code by trying to log in on another device, simply ignore this message.
Evaluation of level of service at chatikara, MathuraSHASHANK KAMAL
Evaluation of level of service. Level of service (LOS) is a qualitative measure used to relate the quality of traffic service. LOS is used to analyze highways by categorizing traffic flow and assigning quality levels of traffic based on performance measure like speed, density,etc.
PSU Friday Transportation Seminar 10/4/2013, featuring Michael Mauch of DKS Associates: Real-world traffic trends observed in PORTAL and INRIX traffic data are used to expand the performance measures that can be obtained from Portland Metro's travel demand model to include the number of hours of congestion that can be expected during a typical weekday and travel time reliability measures for congested freeway corridors.
Introduction to operations research and mathematical modeling. Development of linear programming mathematical model. Solving linear mathematical models using the graphical method and simplex method. Integer programming and solving integer models using branch and bound method.
Conen 442 module3 S2021 Pavement Design and Construction Wael ElDessouki
In this module, we present the two types of pavement commonly used, rigid and flexible pavements. The design and construction methods will be discussed also.
In this part, we focus on the fundamental objectives for the geometric design of roundabouts. Then we discuss the different checks to assess the safety of the roundabout geometric design.
Lec1: https://youtu.be/rMsXWw2BBv8
Conen 442 module1a: Elements of Traffic SystemWael ElDessouki
In this document, we focus on the characteristics of the components comprising traffic systems, namely: Road Users, Vehicles, Infrastructure, Control Devices, and the environment.
Hybrid optimization of pumped hydro system and solar- Engr. Abdul-Azeez.pdffxintegritypublishin
Advancements in technology unveil a myriad of electrical and electronic breakthroughs geared towards efficiently harnessing limited resources to meet human energy demands. The optimization of hybrid solar PV panels and pumped hydro energy supply systems plays a pivotal role in utilizing natural resources effectively. This initiative not only benefits humanity but also fosters environmental sustainability. The study investigated the design optimization of these hybrid systems, focusing on understanding solar radiation patterns, identifying geographical influences on solar radiation, formulating a mathematical model for system optimization, and determining the optimal configuration of PV panels and pumped hydro storage. Through a comparative analysis approach and eight weeks of data collection, the study addressed key research questions related to solar radiation patterns and optimal system design. The findings highlighted regions with heightened solar radiation levels, showcasing substantial potential for power generation and emphasizing the system's efficiency. Optimizing system design significantly boosted power generation, promoted renewable energy utilization, and enhanced energy storage capacity. The study underscored the benefits of optimizing hybrid solar PV panels and pumped hydro energy supply systems for sustainable energy usage. Optimizing the design of solar PV panels and pumped hydro energy supply systems as examined across diverse climatic conditions in a developing country, not only enhances power generation but also improves the integration of renewable energy sources and boosts energy storage capacities, particularly beneficial for less economically prosperous regions. Additionally, the study provides valuable insights for advancing energy research in economically viable areas. Recommendations included conducting site-specific assessments, utilizing advanced modeling tools, implementing regular maintenance protocols, and enhancing communication among system components.
Saudi Arabia stands as a titan in the global energy landscape, renowned for its abundant oil and gas resources. It's the largest exporter of petroleum and holds some of the world's most significant reserves. Let's delve into the top 10 oil and gas projects shaping Saudi Arabia's energy future in 2024.
Sachpazis:Terzaghi Bearing Capacity Estimation in simple terms with Calculati...Dr.Costas Sachpazis
Terzaghi's soil bearing capacity theory, developed by Karl Terzaghi, is a fundamental principle in geotechnical engineering used to determine the bearing capacity of shallow foundations. This theory provides a method to calculate the ultimate bearing capacity of soil, which is the maximum load per unit area that the soil can support without undergoing shear failure. The Calculation HTML Code included.
Explore the innovative world of trenchless pipe repair with our comprehensive guide, "The Benefits and Techniques of Trenchless Pipe Repair." This document delves into the modern methods of repairing underground pipes without the need for extensive excavation, highlighting the numerous advantages and the latest techniques used in the industry.
Learn about the cost savings, reduced environmental impact, and minimal disruption associated with trenchless technology. Discover detailed explanations of popular techniques such as pipe bursting, cured-in-place pipe (CIPP) lining, and directional drilling. Understand how these methods can be applied to various types of infrastructure, from residential plumbing to large-scale municipal systems.
Ideal for homeowners, contractors, engineers, and anyone interested in modern plumbing solutions, this guide provides valuable insights into why trenchless pipe repair is becoming the preferred choice for pipe rehabilitation. Stay informed about the latest advancements and best practices in the field.
NO1 Uk best vashikaran specialist in delhi vashikaran baba near me online vas...Amil Baba Dawood bangali
Contact with Dawood Bhai Just call on +92322-6382012 and we'll help you. We'll solve all your problems within 12 to 24 hours and with 101% guarantee and with astrology systematic. If you want to take any personal or professional advice then also you can call us on +92322-6382012 , ONLINE LOVE PROBLEM & Other all types of Daily Life Problem's.Then CALL or WHATSAPP us on +92322-6382012 and Get all these problems solutions here by Amil Baba DAWOOD BANGALI
#vashikaranspecialist #astrologer #palmistry #amliyaat #taweez #manpasandshadi #horoscope #spiritual #lovelife #lovespell #marriagespell#aamilbabainpakistan #amilbabainkarachi #powerfullblackmagicspell #kalajadumantarspecialist #realamilbaba #AmilbabainPakistan #astrologerincanada #astrologerindubai #lovespellsmaster #kalajaduspecialist #lovespellsthatwork #aamilbabainlahore#blackmagicformarriage #aamilbaba #kalajadu #kalailam #taweez #wazifaexpert #jadumantar #vashikaranspecialist #astrologer #palmistry #amliyaat #taweez #manpasandshadi #horoscope #spiritual #lovelife #lovespell #marriagespell#aamilbabainpakistan #amilbabainkarachi #powerfullblackmagicspell #kalajadumantarspecialist #realamilbaba #AmilbabainPakistan #astrologerincanada #astrologerindubai #lovespellsmaster #kalajaduspecialist #lovespellsthatwork #aamilbabainlahore #blackmagicforlove #blackmagicformarriage #aamilbaba #kalajadu #kalailam #taweez #wazifaexpert #jadumantar #vashikaranspecialist #astrologer #palmistry #amliyaat #taweez #manpasandshadi #horoscope #spiritual #lovelife #lovespell #marriagespell#aamilbabainpakistan #amilbabainkarachi #powerfullblackmagicspell #kalajadumantarspecialist #realamilbaba #AmilbabainPakistan #astrologerincanada #astrologerindubai #lovespellsmaster #kalajaduspecialist #lovespellsthatwork #aamilbabainlahore #Amilbabainuk #amilbabainspain #amilbabaindubai #Amilbabainnorway #amilbabainkrachi #amilbabainlahore #amilbabaingujranwalan #amilbabainislamabad
Final project report on grocery store management system..pdfKamal Acharya
In today’s fast-changing business environment, it’s extremely important to be able to respond to client needs in the most effective and timely manner. If your customers wish to see your business online and have instant access to your products or services.
Online Grocery Store is an e-commerce website, which retails various grocery products. This project allows viewing various products available enables registered users to purchase desired products instantly using Paytm, UPI payment processor (Instant Pay) and also can place order by using Cash on Delivery (Pay Later) option. This project provides an easy access to Administrators and Managers to view orders placed using Pay Later and Instant Pay options.
In order to develop an e-commerce website, a number of Technologies must be studied and understood. These include multi-tiered architecture, server and client-side scripting techniques, implementation technologies, programming language (such as PHP, HTML, CSS, JavaScript) and MySQL relational databases. This is a project with the objective to develop a basic website where a consumer is provided with a shopping cart website and also to know about the technologies used to develop such a website.
This document will discuss each of the underlying technologies to create and implement an e- commerce website.
Immunizing Image Classifiers Against Localized Adversary Attacksgerogepatton
This paper addresses the vulnerability of deep learning models, particularly convolutional neural networks
(CNN)s, to adversarial attacks and presents a proactive training technique designed to counter them. We
introduce a novel volumization algorithm, which transforms 2D images into 3D volumetric representations.
When combined with 3D convolution and deep curriculum learning optimization (CLO), itsignificantly improves
the immunity of models against localized universal attacks by up to 40%. We evaluate our proposed approach
using contemporary CNN architectures and the modified Canadian Institute for Advanced Research (CIFAR-10
and CIFAR-100) and ImageNet Large Scale Visual Recognition Challenge (ILSVRC12) datasets, showcasing
accuracy improvements over previous techniques. The results indicate that the combination of the volumetric
input and curriculum learning holds significant promise for mitigating adversarial attacks without necessitating
adversary training.
Student information management system project report ii.pdfKamal Acharya
Our project explains about the student management. This project mainly explains the various actions related to student details. This project shows some ease in adding, editing and deleting the student details. It also provides a less time consuming process for viewing, adding, editing and deleting the marks of the students.
Overview of the fundamental roles in Hydropower generation and the components involved in wider Electrical Engineering.
This paper presents the design and construction of hydroelectric dams from the hydrologist’s survey of the valley before construction, all aspects and involved disciplines, fluid dynamics, structural engineering, generation and mains frequency regulation to the very transmission of power through the network in the United Kingdom.
Author: Robbie Edward Sayers
Collaborators and co editors: Charlie Sims and Connor Healey.
(C) 2024 Robbie E. Sayers
Water scarcity is the lack of fresh water resources to meet the standard water demand. There are two type of water scarcity. One is physical. The other is economic water scarcity.
3. Speed Studies: Spot Speed Studies
Spot Speed Studies:
Is defined as the average speed of vehicles passing a point on a
highway. This is also known as the time mean speed.
Usually conducted in free flow condition and not during
congestion, where the flow rate is:
750-1000 veh/hr/ln for freeway
<500 veh/hr/ln for other types
Speed Definition of Interest:
- Average or time mean speed
- Standard Deviation
- 85th % speed
- Median speed
Fall 2021/ ElDessouki 128
. TTENG 441 Traffic Engineering
4. Speed Studies: Spot Speed Studies
Uses of Spot Speed Data:
To determine speed limit for applications
To assess speed limit enforcement
Specific Applications:
For Level of Service (LOS) Assessment
For Signal timing: Estimation of Yellow/All Red times.
To determine appropriate sight distance
For safety and accidents analysis
Fall 2021/ ElDessouki 129
. TTENG 441 Traffic Engineering
5. Speed Studies: Measurement Techniques
Manual Method: The Simple Stopwatch Method :
By using stopwatch and defining two reference points with
known distance (d) between the two points.
Then, Speed = d / t (m/s)
Advantages: Simple
Disadvantages:
High error due to stopwatch
depressing time variations.
Class Example
Fall 2021/ ElDessouki 130
40 m
. TTENG 441 Traffic Engineering
6. Speed Studies: Spot Speed Studies
Doppler Radar (Speed Gun):
It uses Doppler’s effect for speed measurements.
How Does it work?
The radar transmit a pack of waves with initial frequency fini and initial wave
length lini ,
Due to the motion of the target vehicle, the wave length of the reflected waves
lref will be longer or shorter than the initial wave length lini
Fall 2021/ ElDessouki 131
. TTENG 441 Traffic Engineering
direction
s
target'
the
on
depnding
V
f
target
ini
ini
ref
*
1
l
l
lini
lref
Transmitted wave
Reflected wave
Target
Radar
7. Speed Studies: Spot Speed Studies
Doppler Radar (Speed Gun):
Advantages:
High Accuracy, but the readings must be corrected for aiming
angle.
Disadvantages:
Difficult to conceal, drivers associate Radar
with police which may cause them to
slow their speeds down and yielding
inaccurate results.
Fall 2021/ ElDessouki 132
. TTENG 441 Traffic Engineering
9. Spot Speed Studies:
Data Reduction & Analysis
The speed data is analyzed and reported as following:
A- Graphical: Frequency Histogram & Accumulative %
Fall 2021/ ElDessouki 134
. TTENG 441 Traffic Engineering
0
5
10
15
20
25
30
35
50-60 60-70 70-80 80-90 90-100 100-110 110-120 120-130 130-140 140-150 150-160
Frequencey
Speed (km/hr)
MODE = 105 km/hr
The shown speed data has
a Bimodal Distribution
10. Spot Speed Studies:
Data Reduction & Analysis
The speed data is analyzed and reported as following:
A- Graphical: Accumulative %
Fall 2021/ ElDessouki 135
. TTENG 441 Traffic Engineering
0%
10%
20%
30%
40%
50%
60%
70%
80%
90%
100%
20 40 60 80 100 120 140 160 180
Accumulative
%
Speed (km/hr)
Median
85%
85th% Speed
15%
15th% Speed
11. Spot Speed Studies:
Data Reduction & Analysis
The speed data is analyzed and reported as following:
B- Quantitative:
1- Mode
2- Median
3- Mean
4- Standard Deviation (SD)
5-85th% & 15th% Speeds
6- Pace(15 km/hr band)
Fall 2021/ ElDessouki 136
. TTENG 441 Traffic Engineering
12. Spot Speed Studies:
Data Reduction & Analysis
The speed data is analyzed and reported as following:
C- Precision and Confidence Intervals:
Note: Most spot speed data tend to be normally distributed (however, this
might not applicable in the shown example histogram), then:
Standard Error:
True Mean:
Fall 2021/ ElDessouki 137
. TTENG 441 Traffic Engineering
size
sample
the
is
-
N
sample
the
for
deviation
standard
the
is
-
SD
where
N
SD
E
mean
sample
the
is
-
X
sample
the
of
error
standard
the
is
-
E
where
95%)
Confidence
of
Degree
(at
E
X 96
.
1
13. Spot Speed Studies:
Data Reduction & Analysis
The speed data is analyzed and reported as following:
D- Sample Size for Prescribed Precision with Confidence Intervals:
If the Prescribed precision was set to be +/- e, the needed sample should
not be less than the following number of observations N @ a degree of
confidence 95%:
Fall 2021/ ElDessouki 138
. TTENG 441 Traffic Engineering
mean
true
the
in
error
the
i.e.
precision
needed
the
-
e
sample
the
of
deviation
standard
the
is
-
SD
where
e
SD
N
2
)
96
.
1
(
14. Speed Studies: Before and After Analysis
Before and After Analysis:
Usually carried out to evaluate the effectiveness of applying a specific
measure on the prevailing speed in an area or a segment.
The before and after is basically a comparison testing between two samples
, with the objective of finding that the difference between the two samples is
significant or not.
Hypothesis Testing
Any hypothesis test, has 4 possible outcomes:
1- Test Result: True, and Reality: True
2- Test Result: False, and Reality: False
3- Test Result: False, and Reality: True Error Type II
4- Test Result: True, and Reality: False Error Type I
Error Type I - must be avoided at all expenses
Fall 2021/ ElDessouki 139
. TTENG 441 Traffic Engineering
True/True False/False
False/True True/False
15. Speed Studies: Before and After Analysis
The Statistical Testing (Z-test):
First, calculate the Pooled Standard Deviation for before & after samples:
Second: Calculate Zd the Standard Normal distribution approximation for the
Observed difference between the before & after samples:
Fall 2021/ ElDessouki 140
. TTENG 441 Traffic Engineering
resp.
after
&
before
size
Sample
N
N
resp.
after
&
before
Deviation
Standard
S
S
Deviation
Standard
Pooled
S
where
N
S
N
S
S
2
1
2
1
&
&
2
2
2
1
2
1
difference
mean
population
ed
hypothesiz
d
Deviation
Standard
pooled
S
resp.
after
&
before
speed
Mean
X
X
after
&
before
between
Diffirence
Normalized
Z
S
d
X
X
Z
o
2
1
d
o
d
&
2
1
16. Speed Studies: Before and After Analysis
The Statistical Testing (Z-test) cont.:
Third, we use the normal distribution curve to find the probability that a value
equal to or less than Zd , assuming that both samples are normally
distributed , then:
A) If Prob.( Z<= Zd ) > 0.95 , that means the observed reduction in speed is
statistically significant.
B) If Prob.( Z<= Zd ) < 0.95 , that means the observed reduction in speed is
statistically insignificant.
For case A, that implies also that there is a 5% chance that the observed
difference in mean speed will be exceeded.
Fall 2021/ ElDessouki 141
. TTENG 441 Traffic Engineering
17. Speed Studies: Before and After Analysis
Example:
The following is the before and after summary for speed enforcement project
that was deployed with a target of reducing average speed to 60 mph.
Before After
Mean Speed: 65.3 63 (mph)
SD: 5 6 (mph)
N: 50 60 observation
Solution
P(Z<2.19) = 0.9857 = 98.57 % >95%
Then: The observed reduction in speed was statistically significant
Fall 2021/ ElDessouki 142
. TTENG 441 Traffic Engineering
mph
N
S
N
S
S 05
.
1
60
6
50
5 2
2
2
2
2
1
2
1
19
.
2
05
.
1
0
63
3
.
65
d
Z
18. Speed Studies: Before and After Analysis
Example (cont.):
Now, the question did we reach the target?
That means the true mean is between: (61.48 - 64.52) mph
The Answer is NO, the reduction is not sufficient and we did not
achieve the 60 mph target
Fall 2021/ ElDessouki 143
. TTENG 441 Traffic Engineering
mph
63.0
E
X 52
.
1
0
.
63
60
6
*
96
.
1
96
.
1
19. Speed Studies: Before and After Analysis
Before and After Analysis:
Example: Evaluating the impact of speed enforcement
project such as SAHER.
Fall 2021/ ElDessouki 144
. TTENG 441 Traffic Engineering
21. Traffic Volume Studies:
Volume studies:
Traffic counts are the most basic of traffic studies and
are the primary measure of demand; virtually all aspects
of traffic engineering require volume as an input,
including highway planning and design, decisions on
traffic control and operations, detailed signal timing, and
others.
Fall 2021/ ElDessouki 146
. TTENG 441 Traffic Engineering
22. Traffic Volume Studies:
Automated and Manual counting techniques are used to produce
estimates of the following:
1. Volume: is the number of vehicles (or persons) passing a point
during a specified time period, which is usually one hour, but need
not be it can be a day, month, year…etc.
2. Rate of flow: is the rate at which vehicles (or persons) pass a
point during a specified time period less than one hour,
expressed as an equivalent hourly rate.
3. Demand is the number of vehicles (or persons) that desire to travel
past a point during a specified period (also usually one hour).
Demand is frequently higher than actual volumes where congestion
exists. Some trips divert to alternative routes, while other trips are
simply not made.
4. Capacity is the maximum rate at which vehicles can traverse a
point or short segment during a specified time period. It is a
characteristic of the roadway.
Fall 2021/ ElDessouki 147
. TTENG 441 Traffic Engineering
24. Traffic Volume Studies:
Example: When demand exceeds capacity. What happens?
Fall 2021/ ElDessouki 149
. TTENG 441 Traffic Engineering
25. Traffic Volume Studies: Manual Counting 1
Manual counting is typically used at intersections, however,
it can be used for highways for 1-2 hours, for LOS
assessment.
Tally Sheets:
Recording data onto tally sheets is the simplest means of
conducting manual counts. The data can be recorded with
a tick mark on a pre-prepared field form. A watch or
stopwatch is necessary to measure the desired count
interval. A blank traffic volume count intersection tally
sheet is provided in Appendix B.
Fall 2021/ ElDessouki 150
. TTENG 441 Traffic Engineering
29. Traffic Volume Studies: Automated Counting 1
Portable Counters:
Portable counters serve the same purpose as manual
counts but with automatic counting equipment.
The period of data collection using this method is usually
longer than when using manual counts.
The portable counter method is mainly used for 24-hour
counts. Pneumatic road tubes are used to conduct this
method of automatic counts
Fall 2021/ ElDessouki 154
. TTENG 441 Traffic Engineering
31. Traffic Volume Studies: Automated Counting 2
Permanent Counters:
Permanent counters are used when long-term counts are to
be conducted. The counts could be
performed every day for a year or more. The data
collected may be used to monitor and evaluate
traffic volumes and trends over a long period of time.
Permanent counters are not a cost-effective
option in most situations. Few jurisdictions have access to
this equipment
Fall 2021/ ElDessouki 156
. TTENG 441 Traffic Engineering
34. Traffic Volume Studies: Automated Counting 3
Video Imaging:
Observers can record count data by videotaping traffic.
Traffic volumes can be counted by viewing videotapes
recorded with a camera at a collection site.
A digital clock in the video image can prove useful in
noting time intervals.
Videotaping is not a cost-effective option in most
situations.
Fall 2021/ ElDessouki 159
. TTENG 441 Traffic Engineering
35. Traffic Volume Studies: Automated Counting 3
Video Imaging:
Fall 2021/ ElDessouki 160
. TTENG 441 Traffic Engineering
37. Travel Time Studies:
Travel Time is defined as:
The time required o traverse a segment of specific distance
in the network at specific time.
Travel-time is a Popular Performance Measure, why?:
Because:
Easy to understand by decision makers and the general
public.
Easy to work with.
It can be used in mode choice models and comparing
between different modes.
Fall 2021/ ElDessouki 162
. TTENG 441 Traffic Engineering
38. Travel Time Studies:
How do we use Travel-time information? :
To identify problem locations on facilities by virtue of high
travel times and or delay.
To measure arterial level of service, based on average travel
speeds and travel times.
To provide necessary input to traffic assignment models, which
focus on link travel time as a key determinant of route
selection.
To provide travel-time data for economic evaluation of
transportation improvements.
To develop time contour maps and other depictions of traffic
congestion in an area or region
Fall 2021/ ElDessouki 163
. TTENG 441 Traffic Engineering
39. Travel Time: Field Study Techniques:
Driving Test Cars: The test car driver MUST use only one of the
following Techniques
1. Floating-car technique.
In this technique, the test-car driver is asked to pass as many vehicles
as pass the test car. In this way, the vehicle’s relative position in the
traffic stream remains unchanged, and the test car approximates the
behavior of an average vehicle in the traffic stream. (Mean Speed)
2. Maximum-car technique.
In this procedure, the driver is asked to drive as fast as is safely
practical in the traffic stream without ever exceeding the design
speed of the facility. (85% Speed)
3. Average-car technique.
The driver is instructed to drive at the approximate average speed of
the traffic stream. (Mean Speed)
Fall 2021/ ElDessouki 164
. TTENG 441 Traffic Engineering
40. Travel Time: Field Study Techniques:
Travel Times Indications of the Driving Techniques
The floating-car and average-car techniques result in estimates of the
average travel time through the section.
The floating-car technique is generally applied only on two-lane highways,
where passing is rare, and the number of passing cars can be counted and
balanced relatively easily.
On a multilane freeway, such a driving technique would be difficult at best,
and might cause dangerous situations to arise as a test vehicle attempts to
“keep up” with the number of vehicles that have passed it.
The average-car technique yields similar results with less stress experienced
by the driver of the test vehicle.
The maximum-car technique does not result in measurement of average
conditions in the traffic stream. Rather, the measured travel times represent
the lower range of the distribution of travel times. Travel times are more
indicative of a 15th percentile than an average. Speeds computed from these
travel times are approximately indicative of the 85th percentile speed.
Fall 2021/ ElDessouki 165
. TTENG 441 Traffic Engineering
41. Travel Time Studies Results: Contour Map
Fall 2021/ ElDessouki 166
. TTENG 441 Traffic Engineering
42. Travel Time: Field Study Techniques:
Travel Times Indications of the Driving Techniques
The floating-car and average-car techniques result in estimates of the
average travel time through the section.
The floating-car technique is generally applied only on two-lane highways,
where passing is rare, and the number of passing cars can be counted and
balanced relatively easily.
On a multilane freeway, such a driving technique would be difficult at best,
and might cause dangerous situations to arise as a test vehicle attempts to
“keep up” with the number of vehicles that have passed it.
The average-car technique yields similar results with less stress experienced
by the driver of the test vehicle.
The maximum-car technique does not result in measurement of average
conditions in the traffic stream. Rather, the measured travel times represent
the lower range of the distribution of travel times. Travel times are more
indicative of a 15th percentile than an average. Speeds computed from these
travel times are approximately indicative of the 85th percentile speed.
Fall 2021/ ElDessouki 167
. TTENG 441 Traffic Engineering
43. Travel Time: Field Study Techniques:
Some Considerations for Test Car Driving Technique
For practicality, too many test cars released into the traffic stream
over a short period of time will affect its operation, in effect altering
the observed results.
For most common applications, the number of test-car runs that will
yield travel-time measurements with reasonable confidence and
precision ranges from a low of 6 to 10 to a high of 50, depending
upon the type of facility and the amount of traffic.
Fall 2021/ ElDessouki 168
. TTENG 441 Traffic Engineering
44. Travel Time: Other Techniques
GPS Data loggers:
It is basically a GPS data recorder that record the location of the vehicle in
terms of lat/long coordinates and the time & speed. It is very accurate and
does not distract the driver.
But the disadvantage is that details regarding delay causes are lost.
Smart Phone Applications .(myTracks)
License Plate Matching:
Roadside observers can record license plate numbers as vehicles pass
designated points along the route. The time of passage is noted along with
the license plate number.
The detail of delay information at intermediate points is lost with this
technique.
Fall 2021/ ElDessouki 169
. TTENG 441 Traffic Engineering
45. Travel Time: GPS Data Sample
Fall 2021/ ElDessouki 170
. TTENG 441 Traffic Engineering
Record Time Lat Long Speed Heading Date
GPRMC 184441 A 2620.391 N 5007.252 E 50.65 300.71 10317 A*5C
GPRMC 184441 A 2620.395 N 5007.225 E 50.07 298.18 10317 A*55
GPRMC 184443 A 2620.405 N 5007.225 E 50.07 298.18 10317 A*55
0
20
40
60
80
100
120
2620.35
2620.4
2620.45
2620.5
2620.55
2620.6
5006.35 5006.4 5006.45 5006.5 5006.55 5006.6 5006.65 5006.7 5006.75 5006.8 5006.85 5006.9 5006.95 5007 5007.05 5007.1 5007.15 5007.2 5007.25
Location
Speed (km/hr)
46. Delay Studies at Signalized Intersections:
Delay components due to traffic control device at an Intersection.
Fall 2021/ ElDessouki 171
. TTENG 441 Traffic Engineering
47. Delay Studies at Signalized Intersections:
The Highway Capacity Manual Method(HCM2000 ):
This method is based on direct observation of vehicles-in-queue at frequent
intervals. This method requires at least two observers.
To apply this method, the following conditions must be taken into
consideration:
1. The method is intended for undersaturated flow conditions, and for cases
where the maximum queue is about 20 to 25 vehicles.
2. The method does not directly measure acceleration/deceleration delay but
uses an adjustment factor to estimate this component.
3. The method also uses an adjustment to correct for errors that are likely to
occur in the sampling process.
4. Observers must make an estimate of free-flow speed before beginning a
detailed survey. This is done by driving a vehicle through the intersection
during periods when the light is green and there are no queues and/or by
measuring approach speeds at a position where they axe unaffected by the
signal.
Fall 2021/ ElDessouki 172
. TTENG 441 Traffic Engineering
48. Delay Studies: The HCM2000 Method
Observer 1:
Keeps track of the end of standing queues for each cycle by observing the
last vehicle in each lane that stops due to the signal. This count includes
vehicles that arrive on green but stop or approach within one car length of
queued vehicles that have not yet started to move.
At intervals between 10 s and 20 s, the number of vehicles in queue are
recorded on the field sheet. The regular intervals for these observations
should be an integral divisor of the cycle length. Vehicles in queue are
those that are included in the queue of stopping vehicles (as defined
above) and have not yet exited the intersection. For through vehicles,
“exiting the intersection” occurs when the rear wheels cross the STOP
line; for turning vehicles, “exiting” occurs when the vehicle clears the
opposing vehicular or pedestrian flow to which it must yield and begins to
accelerate.
Fall 2021/ ElDessouki 173
. TTENG 441 Traffic Engineering
49. Delay Studies: The HCM2000 Method
Observer 2:
During the entire study period, separate counts are maintained of vehicles
arriving during the survey period and of vehicles that stop one or more
times during the survey period. Stopping vehicles are counted only once,
regardless of how many times they stop.
Fall 2021/ ElDessouki 174
. TTENG 441 Traffic Engineering
50. Delay Studies: The HCM2000 Method
HCM2000 Worksheet (see Attachment):
Fall 2021/ ElDessouki 175
. TTENG 441 Traffic Engineering
51. Delay Studies: The HCM2000 Method
HCM2000 Worksheet (see Attachment):
Fall 2021/ ElDessouki 176
. TTENG 441 Traffic Engineering
52. Delay Studies: The HCM2000 Method
Calculations:
1. Sum each column of vehicle-in-queue counts, then sum the column totals
for the entire survey period.
2. Estimate the average time-in-queue per vehicle arriving during the survey
period is estimated using the following equation:
3. Calculate number of vehicles stopped per lane per cycle :
Vstop- Number of stopped vehicles, Nc- Number of cycles, N- Number of lanes.
Fall 2021/ ElDessouki 177
. TTENG 441 Traffic Engineering
53. Delay Studies: The HCM2000 Method
Calculations (cont.) :
4. Calculate the fraction of the stopped vehicles, FVS = Vstop/VT
5- Then, estimate the Acceleration /Deceleration correction delay:
CF is a correction factor that can be obtained from EXHIBIT A16-2 using number of
vehicles stopped per lane per cycle calculated in Step 3
6- Then, the Average Total Control Delay (Sec/Veh) will be:
Fall 2021/ ElDessouki 178
. TTENG 441 Traffic Engineering
54. Delay Studies: The HCM2000 Method
Example:
For the shown delay study
worksheet, estimate the average
delay per vehicle.
Fall 2021/ ElDessouki 179
. TTENG 441 Traffic Engineering