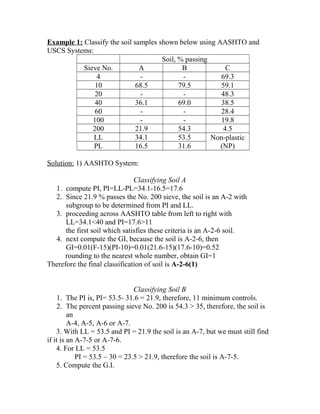
The document provides examples of classifying soils using the AASHTO and USCS soil classification systems. Key steps include determining the particle size distribution, plasticity characteristics (liquid limit, plastic limit, plasticity index), and using this data on classification charts to identify the appropriate soil type symbols. Soils are classified as sand, silt, clay or combinations based on their grain size and plasticity properties.
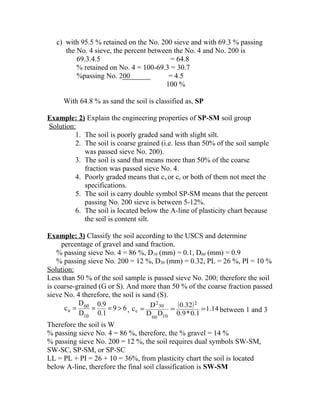
![GI = (F200-35)[0.2+0.005(LL-40)]+0.01(F200-15)(PI-10)
= (54.3-35)[0.2+0.005(53.5-40]+0.01(54.3-15)(21.9-10)
=9.84, use 10
6. The final classification of the soil B is: A-7-5(10)
Classifying Soil C
The soil is either A-1 or A-3.with the percent passing the sieve No. 40 of
38.5 < 51, but 38.5 > 30, the soil must be A-1-b.
There is no group index for this soil.
The final classification of the soil C is A-1-b
Solution: 2) USCS System:
Classifying Soil A
1. we have 21.9<50 % passing the No. 200 sieve and more than 50%
passing the No. 4 sieve (since 68.5 % passed the No. 10) therefore, the
soil is either SM or SC
2. based on LL of 34.1 and PI=34.1-16.5=17.6, we obtained the
coordinates on the plasticity chart that the soil is a CL. Taking C for
"clay" the soil is classified as , SC
Classifying Soil B
a) Since 54.3% passes the No. 200 sieve, the soil is immediately fine-
grained and is MH, OH, or CH because the LL = 53.5 > 50 percent.
b) From the plasticity chart at LL = 53.5 and PI = 21.9, the soil
coordinates are difficult to read so we will compute PI = 0.73(LL-20)
= 0.73(53.5-20) = 24.4 > 21.9 therefore, the soil is an MH from the
coordinate location.
Classifying Soil C
a) with 4.5 % passing the No. 200 sieve, soil is either GW, GP, SW, SP
b) it will be necessary to plot a grain size distribution curve and obtained
D60=2.00 mm
D30=0.29 mm
D10=0.086 mm
To compute
Cu=2/0.086=23.3 > 6
Cc=0.292
/(2*0.086)=0.5 < 1 (not between 1 and 3)
Since the gradation criteria are not met for well-graded, the soil is
poorly graded (P suffix)](https://image.slidesharecdn.com/examplesonsoilclassification-180320121604/85/Examples-on-soil-classification-2-320.jpg)
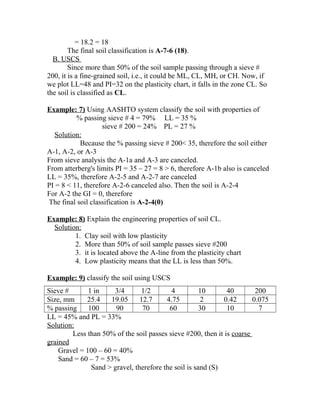
![Example: 4) Ninety-five percent of a soil passes through the No. 200 sieve
and has a LL = 60 % and PL = 20 %. Classify the soil by AASHTO System.
Solution:
PI = 60-20 = 40 %
Passing sieve No. 200 = 95 %
Therefore, the soil is A-7
For A-7-5, PI ≤ LL-30 = 40-30 = 10 not correct
For A-7-6, PI > LL-30 = 40-30 = 10 correct
Therefore the soil classified as A-7-6, hence
GI = (F200-35) [0.2+0.005(LL-40)] +0.01(F200-15) (PI-10)
= (95-35) [0.2+0.005(60-40)] +0.01(95-15) (40-10)
= 42
So, the final soil classification is A-7-6(42)
Example: 5) Classify the following soil using AASHTO system.
% passing sieve # 10 = 100% LL = 30 %
sieve # 40 = 80% PL = 20 %
sieve # 200 = 58%
Solution:
1. PI = 30 – 20 = 10 %
2. % passing sieve # 200 > 35, therefore the soil is A-4, A-5, A-6 or A-7.
3. LL = 30 % and PI = 10%, therefore the soil is A-4.
4. GI = (F200-35) [0.2+0.005(LL-40)] +0.01(F200-15) (PI-10)
= (58-35) [0.2+0.005(30-40)] +0.01(58-15) (10-10)
= 3.45 round to (3.0)
Therefore the final soil classification is A-4 (3).
Example: 6) For, a soil specimen, given the following
% passing sieve # 4 = 92% sieve # 10 = 81%
sieve # 40 = 78% sieve # 200 = 65%
LL = 48 % PI = 32 %
Classify the soil by AASHTO and USCS .
Solution: A. AASHTO system
1. PI = 32 %
2. % passing sieve # 200 > 35, therefore the soil is A-4, A-5, A-6 or A-7.
3. LL = 48 % and PI = 32%, therefore the soil is A-7.
4. LL – 30 = 48 – 30 = 18 % < PI, therefore the soil is A-7-5.
5. GI = (F200-35) [0.2+0.005(LL-40)] +0.01(F200-15) (PI-10)
= (65-35) [0.2+0.005(48-40)] +0.01(65-15) (32-10)](https://image.slidesharecdn.com/examplesonsoilclassification-180320121604/85/Examples-on-soil-classification-4-320.jpg)
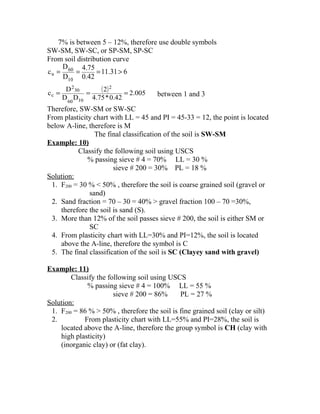
![Example: 12)
Classify the following soil using USCS and AASHTO.
% passing sieve # 4 = 71% LL = 41 %
sieve # 200 = 43% PL = 27 %
Solution: A. AASHTO system
1. PI = 41 – 27 =14 %
2. % passing sieve # 200 > 35, therefore the soil is A-4, A-5, A-6
or A-7.
3. LL = 41 % and PI = 14%, therefore the soil is A-7.
4. LL – 30 = 41 – 30 = 11 % < PI, therefore the soil is A-7-5.
5. GI = (F200-35) [0.2+0.005(LL-40)] +0.01(F200-15) (PI-10)
= (43-35) [0.2+0.005(41-40)] +0.01(43-15) (14-10)
= 2.76 = 3
The final soil classification is A-7-6 (3).
B. USCS
1. F200 = 43 % < 50% , therefore the soil is coarse grained soil
(gravel or sand)
2. Gravel fraction = 100 – 71 = 29% > Sand fraction 71 – 43
=28%, therefore the soil is sand (G).
3. More than 12% of the soil passes sieve # 200, the soil is either
GM or GC
4. From plasticity chart with LL=41% and PI=14%, the soil is
located below the A-line, therefore the symbol is M.
5. Therefore the final soil classification is GM.](https://image.slidesharecdn.com/examplesonsoilclassification-180320121604/85/Examples-on-soil-classification-7-320.jpg)
![Geotechnical Engineering-I [Lec #11: USCS & AASHTO]](https://cdn.slidesharecdn.com/ss_thumbnails/11-180923183816-thumbnail.jpg?width=640&height=640&fit=bounds)


![Geotechnical Engineering-I [Lec #7: Sieve Analysis-2]](https://cdn.slidesharecdn.com/ss_thumbnails/7-180923180808-thumbnail.jpg?width=640&height=640&fit=bounds)
![Geotechnical Engineering-I [Lec #12: AASHTO Soil Classification]](https://cdn.slidesharecdn.com/ss_thumbnails/12-180923183952-thumbnail.jpg?width=640&height=640&fit=bounds)
![Geotechnical Engineering-I [Lec #8: Hydrometer Analysis]](https://cdn.slidesharecdn.com/ss_thumbnails/8-180923180849-thumbnail.jpg?width=640&height=640&fit=bounds)


![Geotechnical Engineering-I [Lec #21: Consolidation Problems]](https://cdn.slidesharecdn.com/ss_thumbnails/21-180924141121-thumbnail.jpg?width=640&height=640&fit=bounds)
![Geotechnical Engineering-I [Lec #9: Atterberg limits]](https://cdn.slidesharecdn.com/ss_thumbnails/9-180923180923-thumbnail.jpg?width=640&height=640&fit=bounds)


![Geotechnical Engineering-I [Lec #24: Soil Permeability - II]](https://cdn.slidesharecdn.com/ss_thumbnails/24-180924141149-thumbnail.jpg?width=640&height=640&fit=bounds)