Downloaded 122 times


![Selected references
Bender-deMoll, S. 2014. ndtv: Network Dynamic Temporal Visualizations. R package version 0.5.1. [Software].
Available from http://CRAN.R-project.org/package=ndtv
Butts, C.T. (2015). relevent: Relational Event Models. R package version 1.0-4, URL http:
//CRAN.R-project.org/package=relevent.
Creemers, B. P. M., & Kyriakides, L. (2008). The dynamics of educational effectiveness: A contribution to policy,
practice and theory in contemporary schools. London: Routledge
Freeman, L. (2004). The development of Social Network Analysis: A Study in the Sociology of Science. Empirical
Press.
Gephi Consortium. (2014). Gephi (Version 0.8.2 beta) [Software]. Available from https://gephi.github.io/
Givvin, K.B., Hiebert, J., Jacobs, J.K., Hollingsworth, H., & Gallimore, R. (2005). Are there national patterns of
teaching? Evidence from the TIMSS 1999 Video Study. Comparative Education Review, 49(3), 311-343.
Handcock, M.S., D. Hunter, C. Butts, S. Goodreau, P. Krivitsky, S. Bender-deMoll, and M. Morris. 2014. Statnet:
Software Tools for the Statistical Analysis of Network Data. The Statnet Project. http://www.statnet.org. R package
version 2014.2.0.
Hiebert, J., Gallimore, R., Garnier, H., Givvin, K. B., Hollingsworth, H., Jacobs, J., Chui, A. M., Wearne, D., Smith, M.,
Kersting, N., Manaster, A., Tseng, E., Etterbeek, W., Manaster, C., Gonzales, P., & Stigler, J. (2003). Teaching
Mathematics in Seven Countries: Results from the TIMSS 1999 Video Study, NCES (2003-013), U.S. Department of
Education. Washington, DC: National Center for Education Statistics.
Howe, C., & Abedin, M. (2013). Classroom dialogue: A systematic review across four decades of research, Cambridge
Journal of Education, 43(3), 325-356.
Marcum, C.S., & Butts, C.T. (2015). Constructing and Modifying Sequence Statistics for relevent Using informR in R.
Journal of Statistical Software, 64(5).
Moody, J., McFarland, D.A., & Bender-deMoll, S. (2005). Dynamic network visualization: Methods for meaning with
longitudinal network movies. American Journal of Sociology, 110, 1206-1241.](https://image.slidesharecdn.com/seds2017educationseminarseriesonsnafinal-170316170738/85/Social-Network-Analysis-applications-for-education-research-85-320.jpg)

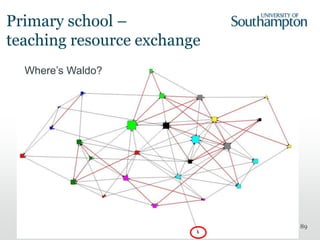
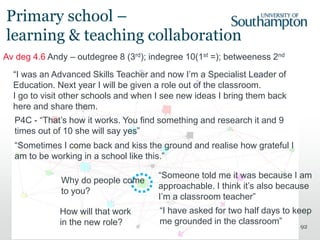

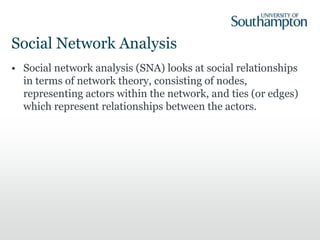
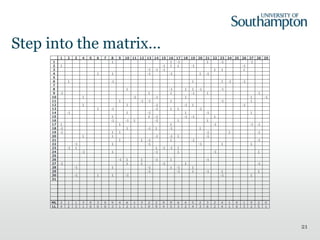
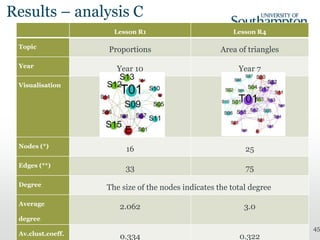
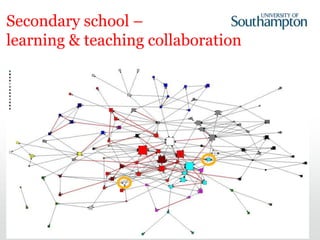
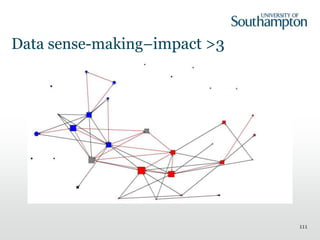
![97
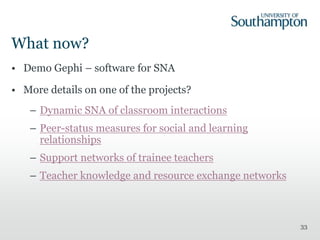
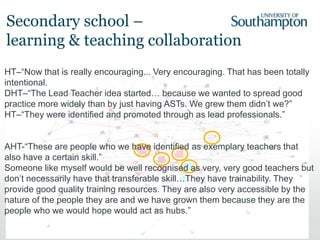
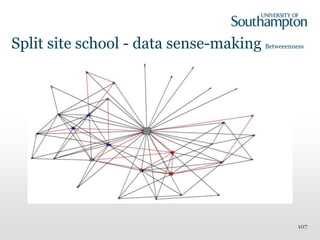
AHT – “We’d expect [teachers A, B & C] to be there.
Someone like [teacher D] would be increasingly in the middle], more over
last year.”
DHT - “ And also [teacher E]
Secondary school –
learning & teaching collaboration](https://image.slidesharecdn.com/seds2017educationseminarseriesonsnafinal-170316170738/85/Social-Network-Analysis-applications-for-education-research-97-320.jpg)
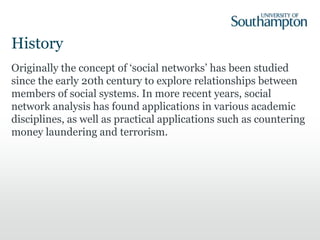
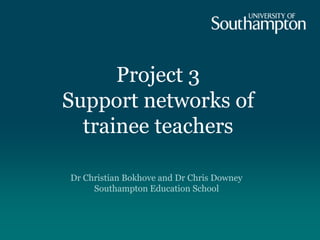
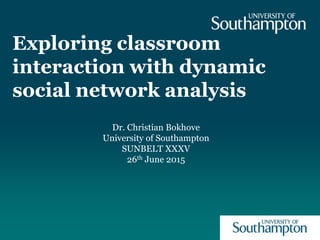
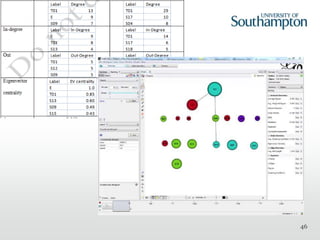
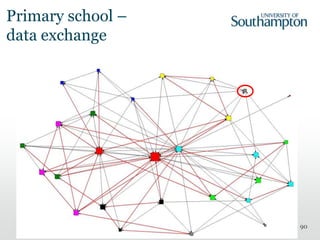
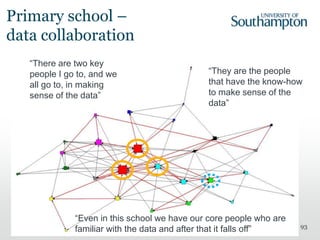
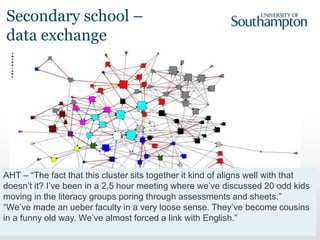
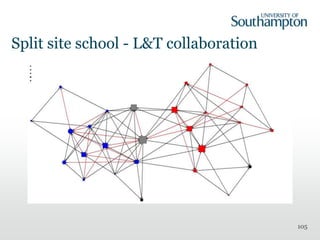
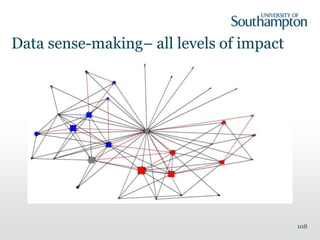
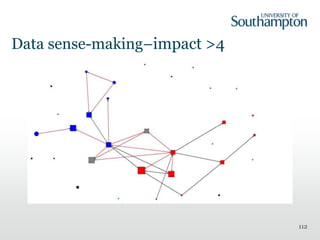
![99
AHT – “This doesn’t surprise me… [science have] an internal data system
they put out there. ‘We have our own system, we set up our [data type] in a
certain way’.
This makes sense to me. Maths share their own data, ‘Because our data
doesn’t make sense to other people’.
Secondary school –
data exchange](https://image.slidesharecdn.com/seds2017educationseminarseriesonsnafinal-170316170738/85/Social-Network-Analysis-applications-for-education-research-99-320.jpg)

The document discusses social network analysis (SNA) and its applications in educational research, particularly focusing on classroom interactions and peer relationships among students. It highlights four projects that utilize dynamic SNA to measure and analyze interactions and networks among trainees and educators, with a variety of data collection methods and visualization tools like Gephi. The findings emphasize the importance of social networks in understanding educational dynamics and potential areas for future research.