Downloaded 27 times
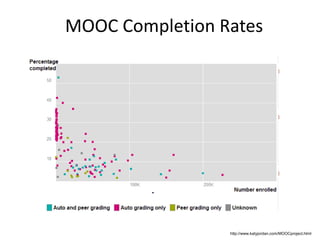
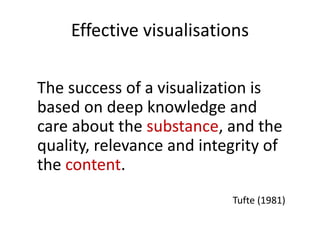
![[1] UCT Student Experience Survey
• Understand students’
overall experience
• Data to effect change,
improve decisions and
policies, affirm good
practices & quality
assure
• Good practice](https://image.slidesharecdn.com/seminar2014leaninganalytics-cput-share-140527095131-phpapp01/85/Learning-Analytics-Seeking-new-insights-from-educational-data-7-320.jpg)
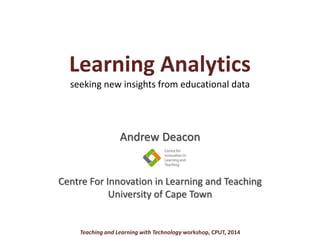
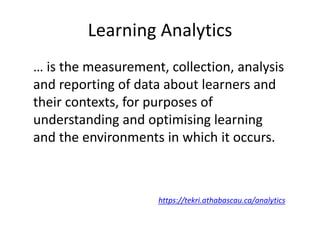
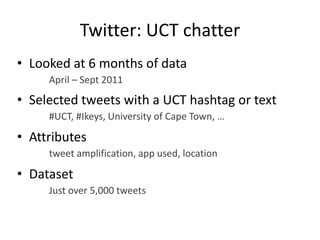
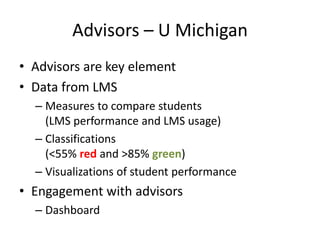
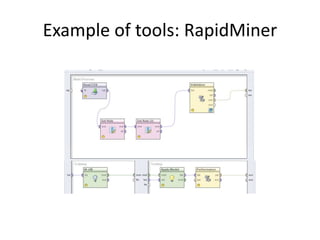
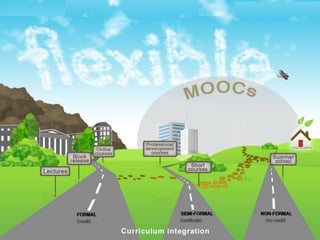
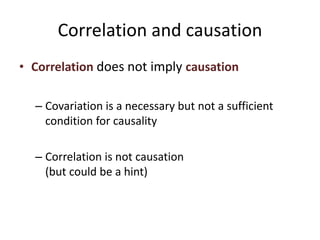
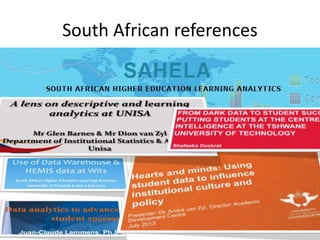
![[2] Are streams being disadvantaged?
Within Degree Type:
• Differences in mean
final mark are
significant
• Across years,
differences in
means are similar
• Differences in 2013
are not unusual
Change in mode
of delivery](https://image.slidesharecdn.com/seminar2014leaninganalytics-cput-share-140527095131-phpapp01/85/Learning-Analytics-Seeking-new-insights-from-educational-data-9-320.jpg)
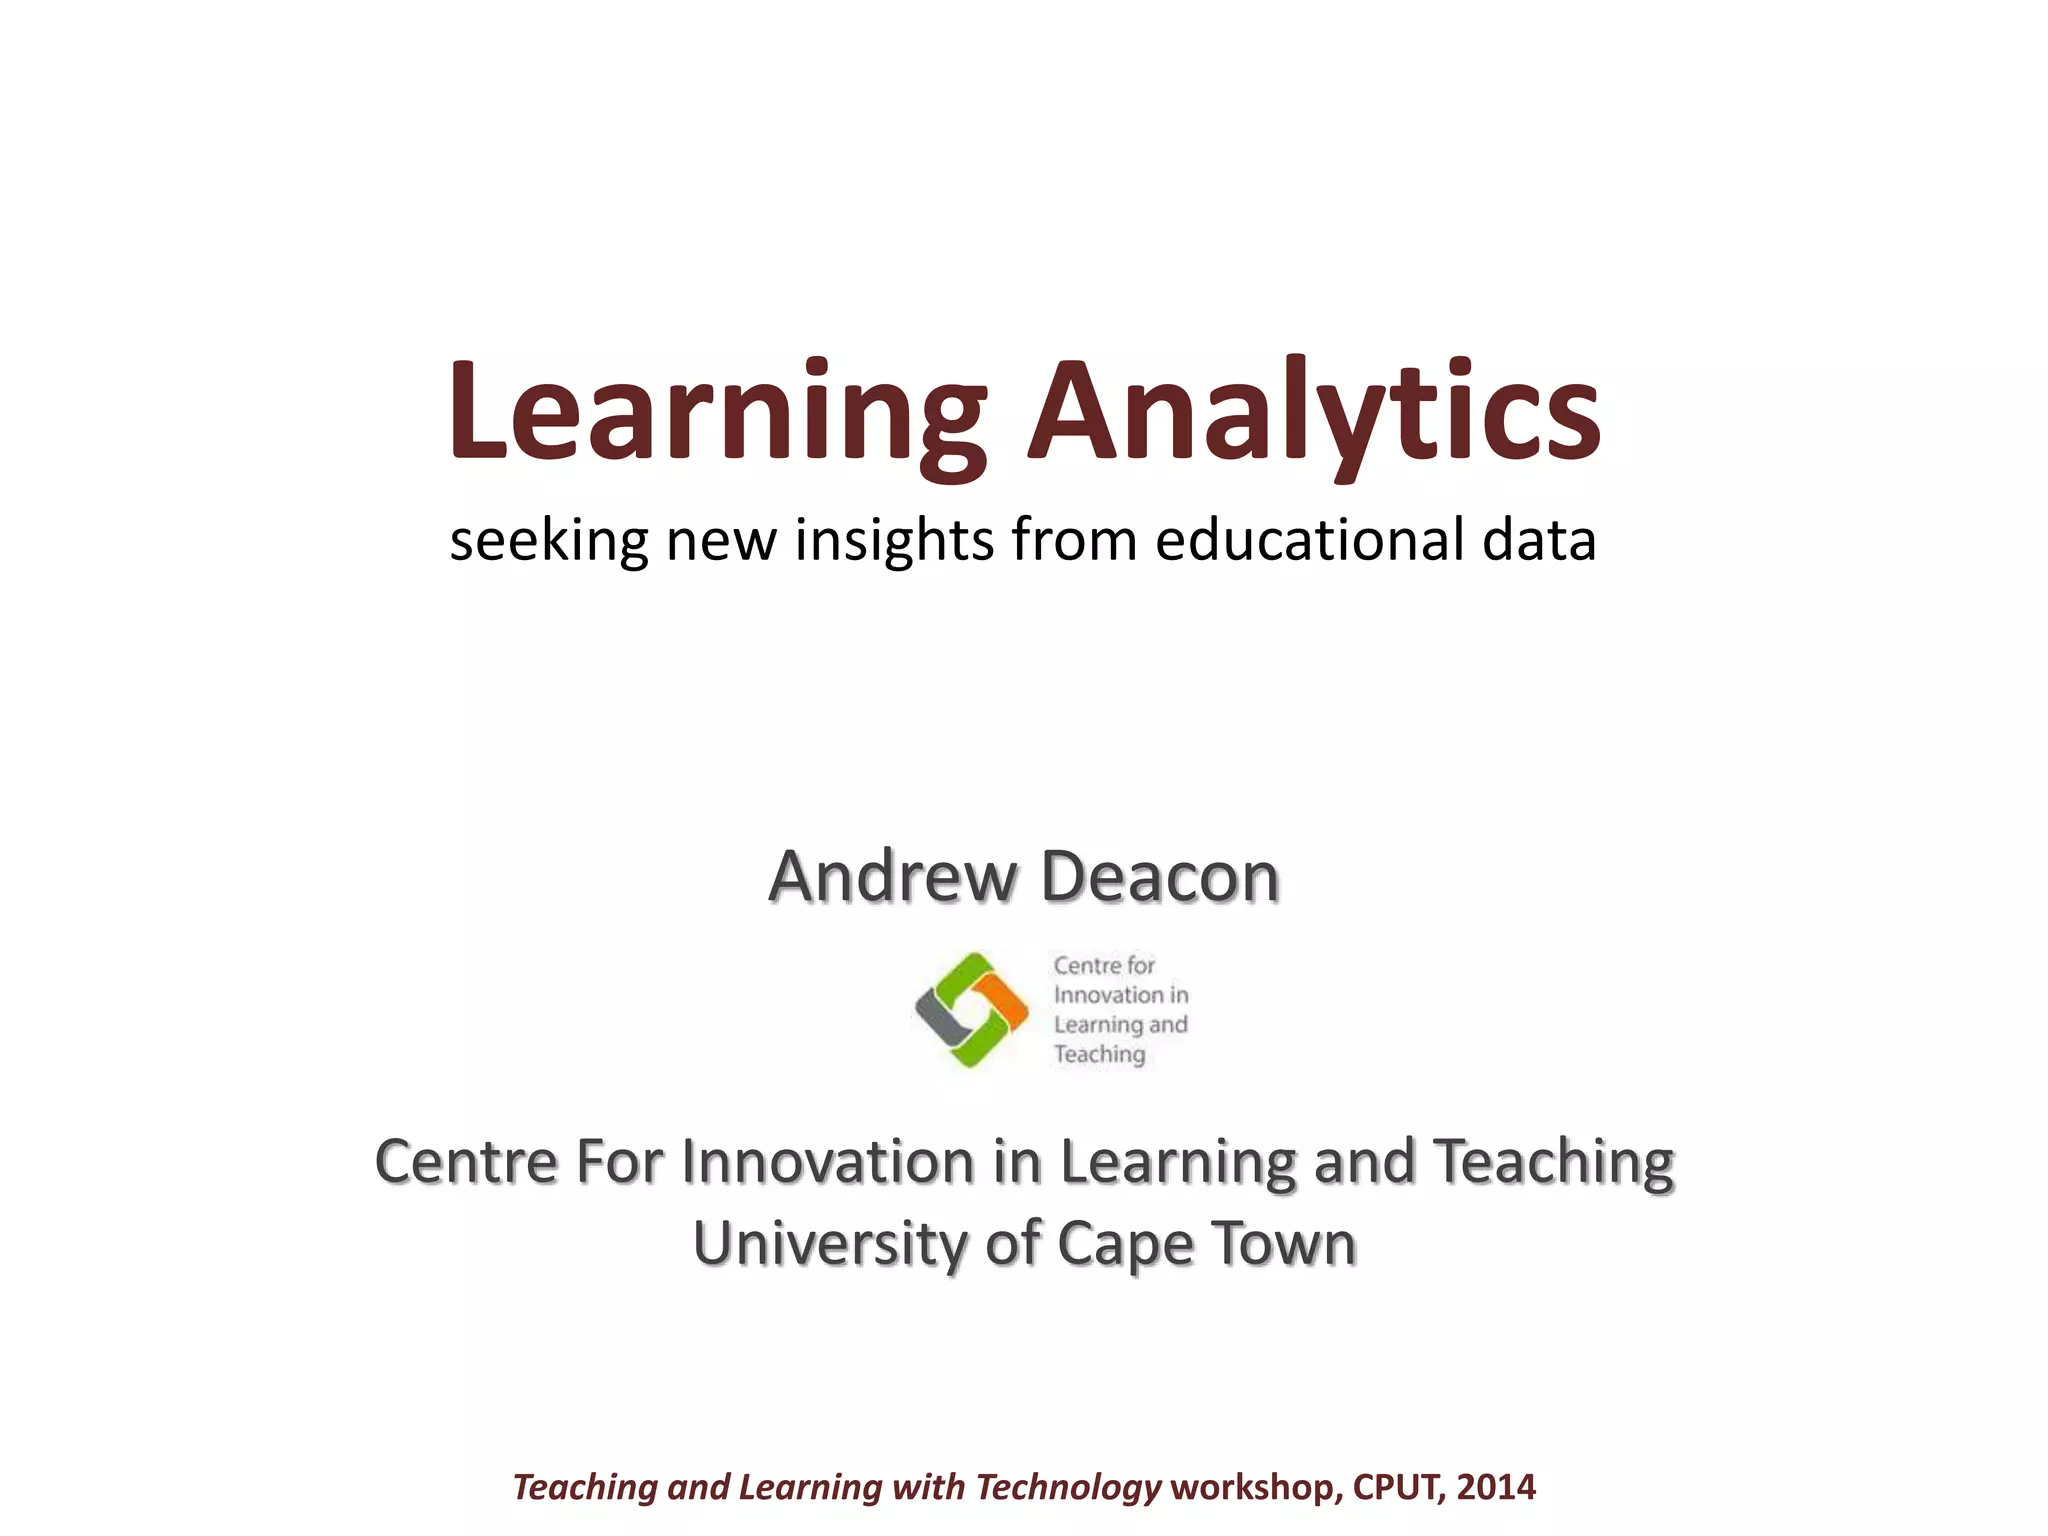
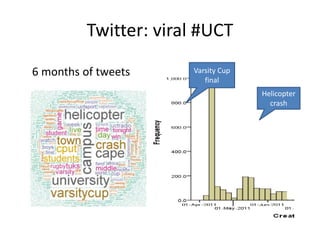
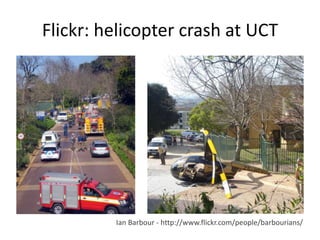
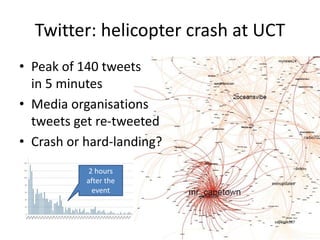
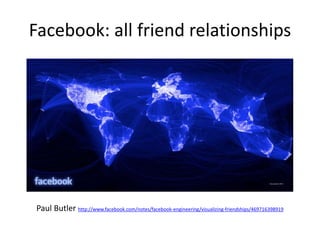
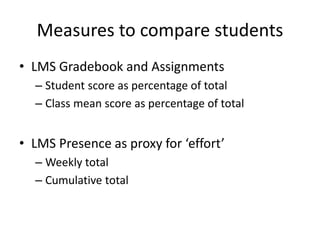
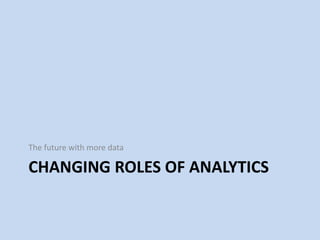
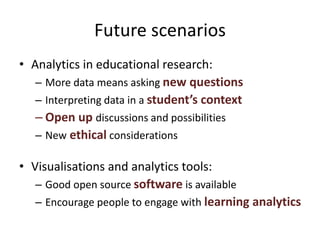
![[3] UCT and social media
Prominent links to:
– Facebook
– Flickr
– LinkedIn
– Twitter](https://image.slidesharecdn.com/seminar2014leaninganalytics-cput-share-140527095131-phpapp01/85/Learning-Analytics-Seeking-new-insights-from-educational-data-10-320.jpg)
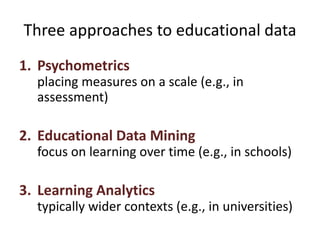
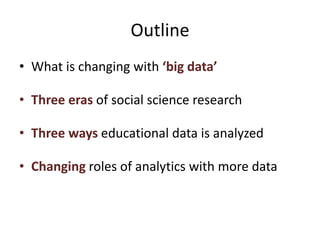
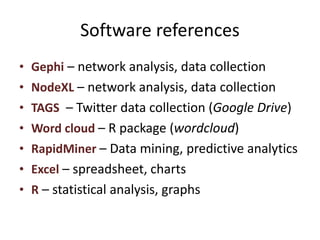
![[3] Developing learning analytics](https://image.slidesharecdn.com/seminar2014leaninganalytics-cput-share-140527095131-phpapp01/85/Learning-Analytics-Seeking-new-insights-from-educational-data-21-320.jpg)

1) Learning analytics seeks new insights from educational data by measuring, collecting, analyzing and reporting data about learners and learning environments to optimize learning. 2) There are three eras of social science research: collecting simple data on important questions; getting the most from little data; and today's "big data" deluge allowing new questions. 3) Educational data can be analyzed through psychometrics, educational data mining, and learning analytics, typically focusing on assessment, learning over time, and wider contexts respectively.