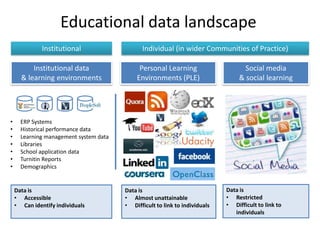
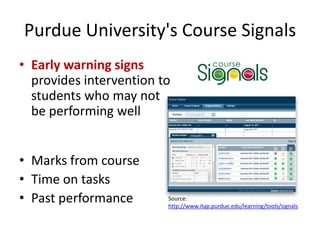
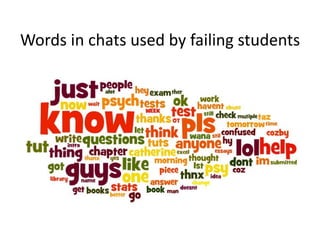
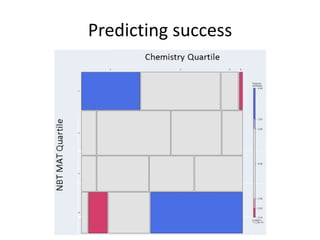
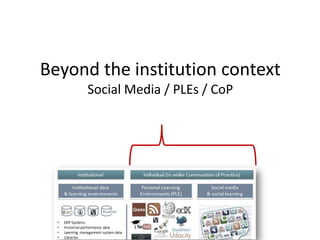
Learning Analytics
      explorations of learning data


                  Andrew Deacon
        Centre for Educational Technology
            University of Cape Town


Learning and Development community of practice – 9 Nov 2012
Outline
•   Understandings of learning analytics
•   Instructional design case
•   Data landscape in learning organizations
•   Trends within the organization context
•   Connections with external contexts
•   Future scenarios
Search-term: ‘Analytics’


                  Google Trends
Learning Analytics

The measurement, collection, analysis
and reporting of data about learners
and their contexts, for purposes of
understanding and optimising learning
and the environments in which it
occurs.

Learning Analytics 2011 Conference, https://tekri.athabascau.ca/analytics
Age of Big Data


Source: The Economist
An Instructional Design Case
Merrill on ID
Instruction involves directing students to
appropriate learning activities;
guiding students to appropriate knowledge;
helping students rehearse, encode, and
process information;
monitoring student performance;
and providing feedback as to the
appropriateness of the student’s learning
activities and practice performance.
NewsScripts: Scriptwriting exercise


 1) Watch footage, note     2) Write script following   3) Take note of
  significant details and       TV news writing          feedback on
     research online.            conventions.            some issues.
NewsScripts: Nit-picking bot
• Rather than lots of instructions
  – that students would not follow anyway
• Provide feedback on script
  – Check script length
    e.g., read at 3 words per second
  – Flag words editors avoid
    e.g., never use: ‘As the footage shows’
  – Emphasise active voice
    e.g., avoid: ‘were’
NewsScripts: Context
• 2nd year UCT Media Studies course
• Linked to lectures on media writing genres
• 250 students
• 2h to complete
  180-word script
• 10% of mark
• Used since 2001
  (with gaps)
Questions for ID
• Why is it so difficult to entrench such learning
  interventions in university curricula?

• Curriculum integration tensions (relevance)
  – Media writing & Essay writing
  – Media production & Theory & critique
  – Online teaching spaces & Traditional modes
Educational data landscape
              Institutional                   Individual (in wider Communities of Practice)

          Institutional data                 Personal Learning                      Social media
      & learning environments               Environments (PLE)                    & social learning


•     ERP Systems
•     Historical performance data
•     Learning management system data
•     Libraries
•     School application data
•     Turnitin Reports
•     Demographics


    Data is                             Data is                              Data is
    • Accessible                        • Almost unattainable                • Restricted
    • Can identify individuals          • Difficult to link to individuals   • Difficult to link to
                                                                                individuals
Within the institutional contexts
Purdue University's Course Signals
• Early warning signs
  provides intervention to
  students who may not
  be performing well


• Marks from course
• Time on tasks
• Past performance       Source:
                         http://www.itap.purdue.edu/learning/tools/signals
Students’ use of Vula in a course

                           Submission of
                            assignments
Polling of
students


                                  Site visits
               Content
               accessed


                              Chat room
                               activity
Sectioning
of students
Sociogram of a discussion forum


                      Dawson (2010)
Words in chats used by failing students
Words used by Lecturers vs Students
                                    Marks;
                                    thanks;
‘Weiten’ –                           test;
 textbook                             Tut;
  author                             guys


     Week;
     pages


 Used more by                     Used more by
Lecturers/tutors                    Students
Predicting success


  Chemistry – 1st year course

NBT - National Benchmark Tests
Predicting success
Predicting success
Predicting success
Beyond the institution context
     Social Media / PLEs / CoP
Big breakthroughs happen
when what is suddenly
possible meets what is
desperately necessary.

                      Thomas Friedman
           New York Times, 15 May 2012
High profile MOOCs
Coursera open online course
• Gamification course
  – 81,000 registrations
  – 8,280 received certificates (10%)
• Participation
  – 20,000 forum posts
  – 187,000 peer evaluations by 13,000 students
  – Facebook group: 3,400 members
  – Twitter: > 2,700 tweets #gamification12
Gamification course participation
100%

80%                           Registers
60%                           Watchers
                              Submitters
40%                           Writers
                              Certificate
20%

 0%
Coursera: learning from videos
               Concept Mapping or Retrieval Practice


J D Karpicke, J R Blunt Science 2011;331:772-775


  Published by AAAS
If our aim is to understand people’s
behaviour rather than simply to record
it, we want to know about primary
groups, neighbourhoods, organizations,
social circles, and communities; about
interaction, communication, role
expectations, and social control.
Allen Barton, 1968, cited in Freeman (2004)


                                              Source: CC BY-SA 3.0
UCT and social media
• Prominent links to:
  – Facebook
  – Flickr
  – LinkedIn
  – YouTube
Twitter: UCT chatter
• Six months of data (April – Sept 2011)
• Tweets including a UCT hashtag or text
      #UCT, #Ikeys, University of Cape Town, …
• Attributes; how tweets are amplified
• Just over 5,000 tweets


  Cannot capture every tweet on the topic
  And some data cleaning required
Twitter: apps & locations
Blackberry     Twitter   Ubersocial   Others

         17%
                                           Blackberry
                               27%

                                                        Smartphone
                                                        geo-location

  20%


                         36%


 Cell phones
Twitter: tweeter relationships
Small number of
frequent tweeters
1. Drama student
  (162)
2. UCT Radio
  (132)
3. Science student
  (84)
Twitter: viral #UCT

6 months of tweets     Varsity Cup
                          final
                                     Helicopter
                                       crash
Flickr: helicopter crash at UCT


         Ian Barbour - http://www.flickr.com/people/barbourians/
Twitter: helicopter crash at UCT
• Peak of 140 tweets
  in 5 minutes
• Media organisations
  tweets get re-tweeted
• Crash or hard-landing?
            2 hours
           after the
             event
Facebook: all friend relationships


Paul Butler http://www.facebook.com/notes/facebook-engineering/visualizing-friendships/469716398919
1st-year course
combinations                   HS


                   HUM
COM


             SCI
                         EBE
Effective visualisations


The success of a visualization is based
on deep knowledge and care about
the substance, and the
quality, relevance and integrity of the
content.

                                (Tufte 1981)
Correlation and causation
• Correlation does not imply causation

  – Covariation is a necessary but not a sufficient
    condition for causality

  – Correlation is not causation
    (but could be a hint)
Future scenarios
• Learning analytics for educational research
   –   Instructional data within wider contexts
   –   Social media & PLE outside formal contexts
   –   Modelling and predicting success
   –   Supporting intervention opportunities
   –   Reproducible research
   –   Ethical considerations

• Learning analytics for visualisations
   – Presenting data in engaging forms
   – Relating several variables
Software references
•   Gephi – network analysis, data collection
•   NodeXL – network analysis, data collection
•   TAGS – Twitter data collection (Google Drive)
•   Word cloud – R package (wordcloud)
•   Geo-location map – R package (RgoogleMaps)
•   Excel – spreadsheet, charts
•   SPSS – statistical analysis, graphs
Literature references
• Baker, S.J.D., Yacef, K. (2009) The State of Educational Data Mining
  in 2009: A Review and Future Visions:
  http://www.educationaldatamining.org/JEDM/images/articles/vol1
  /issue1/JEDMVol1Issue1_BakerYacef.pdf
• Dawson, S. 2010. ‘Seeing’ the learning community: An exploration
  of the development of a resource for monitoring online student
  networking. British Journal of Educational Technology, 41(5), 736-
  752.
• Freeman, C. (2004) The Development of Social Network Analysis: A
  Study in the Sociology of Science. Empirical Press: Vancouver, BC
  Canada.
• Fritz, J. (2011) Learning Analytics. Presentation prepared for
  Learning and Knowledge Analytics course 2011
  (LAK11). http://www.slideshare.net/BCcampus/learning-analytics-
  fritz
FatFonts references
• by Miguel Nacenta, Uta Hinrichs, and Sheelagh Carpendale
• Area of each number is exactly proportional to
  its value - http://fatfonts.org


                                                  Source: http://fatfonts.org

Learning Analytics - L&D Community of Practice 2012

  • 1.
    Learning Analytics explorations of learning data Andrew Deacon Centre for Educational Technology University of Cape Town Learning and Development community of practice – 9 Nov 2012
  • 2.
    Outline • Understandings of learning analytics • Instructional design case • Data landscape in learning organizations • Trends within the organization context • Connections with external contexts • Future scenarios
  • 3.
  • 4.
    Learning Analytics The measurement,collection, analysis and reporting of data about learners and their contexts, for purposes of understanding and optimising learning and the environments in which it occurs. Learning Analytics 2011 Conference, https://tekri.athabascau.ca/analytics
  • 5.
    Age of BigData Source: The Economist
  • 6.
  • 7.
    Merrill on ID Instructioninvolves directing students to appropriate learning activities; guiding students to appropriate knowledge; helping students rehearse, encode, and process information; monitoring student performance; and providing feedback as to the appropriateness of the student’s learning activities and practice performance.
  • 8.
    NewsScripts: Scriptwriting exercise 1) Watch footage, note 2) Write script following 3) Take note of significant details and TV news writing feedback on research online. conventions. some issues.
  • 9.
    NewsScripts: Nit-picking bot •Rather than lots of instructions – that students would not follow anyway • Provide feedback on script – Check script length e.g., read at 3 words per second – Flag words editors avoid e.g., never use: ‘As the footage shows’ – Emphasise active voice e.g., avoid: ‘were’
  • 10.
    NewsScripts: Context • 2ndyear UCT Media Studies course • Linked to lectures on media writing genres • 250 students • 2h to complete 180-word script • 10% of mark • Used since 2001 (with gaps)
  • 11.
    Questions for ID •Why is it so difficult to entrench such learning interventions in university curricula? • Curriculum integration tensions (relevance) – Media writing & Essay writing – Media production & Theory & critique – Online teaching spaces & Traditional modes
  • 12.
    Educational data landscape Institutional Individual (in wider Communities of Practice) Institutional data Personal Learning Social media & learning environments Environments (PLE) & social learning • ERP Systems • Historical performance data • Learning management system data • Libraries • School application data • Turnitin Reports • Demographics Data is Data is Data is • Accessible • Almost unattainable • Restricted • Can identify individuals • Difficult to link to individuals • Difficult to link to individuals
  • 13.
  • 14.
    Purdue University's CourseSignals • Early warning signs provides intervention to students who may not be performing well • Marks from course • Time on tasks • Past performance Source: http://www.itap.purdue.edu/learning/tools/signals
  • 16.
    Students’ use ofVula in a course Submission of assignments Polling of students Site visits Content accessed Chat room activity Sectioning of students
  • 17.
    Sociogram of adiscussion forum Dawson (2010)
  • 18.
    Words in chatsused by failing students
  • 19.
    Words used byLecturers vs Students Marks; thanks; ‘Weiten’ – test; textbook Tut; author guys Week; pages Used more by Used more by Lecturers/tutors Students
  • 20.
    Predicting success Chemistry – 1st year course NBT - National Benchmark Tests
  • 21.
  • 22.
  • 23.
  • 24.
    Beyond the institutioncontext Social Media / PLEs / CoP
  • 25.
    Big breakthroughs happen whenwhat is suddenly possible meets what is desperately necessary. Thomas Friedman New York Times, 15 May 2012
  • 26.
  • 27.
  • 28.
    Coursera open onlinecourse • Gamification course – 81,000 registrations – 8,280 received certificates (10%) • Participation – 20,000 forum posts – 187,000 peer evaluations by 13,000 students – Facebook group: 3,400 members – Twitter: > 2,700 tweets #gamification12
  • 29.
    Gamification course participation 100% 80% Registers 60% Watchers Submitters 40% Writers Certificate 20% 0%
  • 30.
    Coursera: learning fromvideos Concept Mapping or Retrieval Practice J D Karpicke, J R Blunt Science 2011;331:772-775 Published by AAAS
  • 31.
    If our aimis to understand people’s behaviour rather than simply to record it, we want to know about primary groups, neighbourhoods, organizations, social circles, and communities; about interaction, communication, role expectations, and social control. Allen Barton, 1968, cited in Freeman (2004) Source: CC BY-SA 3.0
  • 32.
    UCT and socialmedia • Prominent links to: – Facebook – Flickr – LinkedIn – YouTube
  • 33.
    Twitter: UCT chatter •Six months of data (April – Sept 2011) • Tweets including a UCT hashtag or text #UCT, #Ikeys, University of Cape Town, … • Attributes; how tweets are amplified • Just over 5,000 tweets Cannot capture every tweet on the topic And some data cleaning required
  • 34.
    Twitter: apps &locations Blackberry Twitter Ubersocial Others 17% Blackberry 27% Smartphone geo-location 20% 36% Cell phones
  • 35.
    Twitter: tweeter relationships Smallnumber of frequent tweeters 1. Drama student (162) 2. UCT Radio (132) 3. Science student (84)
  • 36.
    Twitter: viral #UCT 6months of tweets Varsity Cup final Helicopter crash
  • 37.
    Flickr: helicopter crashat UCT Ian Barbour - http://www.flickr.com/people/barbourians/
  • 38.
    Twitter: helicopter crashat UCT • Peak of 140 tweets in 5 minutes • Media organisations tweets get re-tweeted • Crash or hard-landing? 2 hours after the event
  • 39.
    Facebook: all friendrelationships Paul Butler http://www.facebook.com/notes/facebook-engineering/visualizing-friendships/469716398919
  • 40.
  • 41.
    Effective visualisations The successof a visualization is based on deep knowledge and care about the substance, and the quality, relevance and integrity of the content. (Tufte 1981)
  • 42.
    Correlation and causation •Correlation does not imply causation – Covariation is a necessary but not a sufficient condition for causality – Correlation is not causation (but could be a hint)
  • 43.
    Future scenarios • Learninganalytics for educational research – Instructional data within wider contexts – Social media & PLE outside formal contexts – Modelling and predicting success – Supporting intervention opportunities – Reproducible research – Ethical considerations • Learning analytics for visualisations – Presenting data in engaging forms – Relating several variables
  • 44.
    Software references • Gephi – network analysis, data collection • NodeXL – network analysis, data collection • TAGS – Twitter data collection (Google Drive) • Word cloud – R package (wordcloud) • Geo-location map – R package (RgoogleMaps) • Excel – spreadsheet, charts • SPSS – statistical analysis, graphs
  • 45.
    Literature references • Baker,S.J.D., Yacef, K. (2009) The State of Educational Data Mining in 2009: A Review and Future Visions: http://www.educationaldatamining.org/JEDM/images/articles/vol1 /issue1/JEDMVol1Issue1_BakerYacef.pdf • Dawson, S. 2010. ‘Seeing’ the learning community: An exploration of the development of a resource for monitoring online student networking. British Journal of Educational Technology, 41(5), 736- 752. • Freeman, C. (2004) The Development of Social Network Analysis: A Study in the Sociology of Science. Empirical Press: Vancouver, BC Canada. • Fritz, J. (2011) Learning Analytics. Presentation prepared for Learning and Knowledge Analytics course 2011 (LAK11). http://www.slideshare.net/BCcampus/learning-analytics- fritz
  • 46.
    FatFonts references • byMiguel Nacenta, Uta Hinrichs, and Sheelagh Carpendale • Area of each number is exactly proportional to its value - http://fatfonts.org Source: http://fatfonts.org