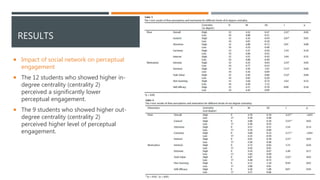
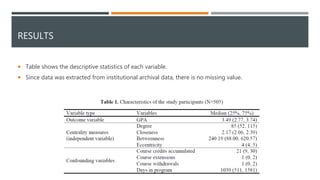
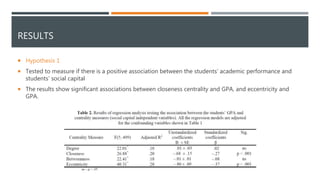
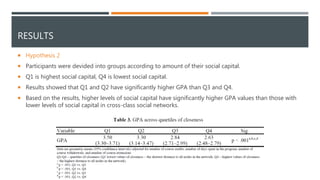
LEARNING ANALYTICS IN EDUCATION
SOCIAL NETWORK ANALYSIS
YILDIZ UZUN
A SOCIAL NETWORK ANALYSIS ON ELEMENTARY STUDENT
ENGAGEMENT
IN THE NETWORKED CREATION COMMUNITY
CHEN-CHUNG LIU , YU-CHI CHEN , SHU-JU DIANA TAI (COMPUTERS AND EDUCATION, 2017)
CONTEXT OF THE STUDY
 The goals of the study is to understand the impact of the social networking activities on elementary
students' engagement in the networked creation community.
 Compares students' engagement in two settings;
 Students freely team up with peers (dynamic teaming)
 Students work with a fixed peer (fixed relation)
RESEARCH QUESTIONS
 Do the dynamic teaming activities impact the students' flow and motivation in the networked creation
activity?
 How do the students team and collaborate with peers to participate in the networked creation activity?
 Do the students' properties in the social network have an impact on their flow and motivation in the
networked creation activity
RESEARCH METHOD- PARTICIPANTS
 This study is part of a year-long program aiming at helping students develop their proficiency in English,
computer use, and collaboration through collaborative digital storytelling.
 26- third grade students in an elementary school in northern Taiwan, aged between 8 and 9
RESEARCH METHOD- INSTRUMENTS
 There are 3 instruments:
 Storytelling and social networking
 to create multimedia stories on the Internet, Story &
Painting House, social networking application was
developed to facilitate the process of the networked
creation activity
 students could invite peers to create a shared
multimedia story
 Once an invitation was sent, it would be instantly logged
by the system and a link from inviter to invitee would be
presented in the SNA tool for further analysis.
RESEARCH METHOD- INSTRUMENTS
 The flow perception survey
 this survey investigates student engagement in four basic flow components including the level of control,
attention, curiosity and intrinsic interest
 consists of only four 5-point Likert items and
 administrated right at the end of each activity section
 Motivated Strategies for Learning Questionnaire (MSLQ)
 While the flow survey was conducted to obtain students' short term engagement right after each activity section,
the Motivated Strategies for Learning Questionnaire (MSLQ) was conducted to uncover the long-term impact of
the networked creation activity on participants' motivation associated with the fixed relation and dynamic teaming
activities.
 The questionnaire includes 25 items asking students’ motivation in the dimensions of self-efficacy,
extrinsic/intrinsic goal orientation, task value and peer learning
RESEARCH METHOD- PROCEDURE
 The networked creation activity was implemented during a semester, for an 80-min session per week.
 Students
 First 5 weeks => fixed teams, from 6 to 13 week => dynamic teams (total 13 section)
 After each section, they answered flow perception survey. Motivated Strategies for Learning
Questionnaire (MSLQ) was administrated in week 5 and 13 to assess motivation
Read the story
Create picture
book
collaboratively
Publish the books
RESEARCH METHOD- DATA ANALYSIS
 Flow perception and motivation questionnaires were analyzed with dependent t-test. (RQ1)
 Participants’ invitation activities on the social network were analyzed with the UCINET SNA tool. (RQ2)
 Their perceptual engagement was also compared based on their degree centrality with t-test (RQ3)
RESULTS
 Perceptual engagement in fixed relation and
dynamic alignment activities
 participants perceived relatively lower level of
flow in the first 5 weeks when the fixed relation
activity was implemented and the flow
perception was at a higher level during week 6
to 13 when the dynamic teaming activity was
administered.
RESULTS
 Perceptual engagement in fixed relation and
dynamic alignment activities
 in the dynamic teaming activity, participants’ average
flow perception was 4.52, which is significantly higher
than that in fixed relation activity (table 1)
 Participants perceived a significantly higher level of
motivation in the dynamic teaming activity than they
did in the fixed relation activity in two dimensions:
intrinsic motivation and task value
RESULTS
 Social Network Analysis
 elementary students tended to team up with
students of the same gender when participating
in the networked creation activity.
 Figure shows in-degree centrality (who recieved
more invitation), there are 12 student in the circle
6 boys and 6 girls. High popularity not depends
on gender on elementary students.
 Also, their content knowledge varies among 12.
content knowledge not effect popularity. They
were not invited because of their knowledge.
Girls BoysDensity=0.0
7
RESULTS
 Social Network Analysis
 Figure shows out-degree centrality.
There are 9 participant in the circle 5 boy,
4 girl.
 Their english profeciency levels are mid
and low.
 Results show that the lower-proficiency
students are more active in teaming up
and invitations. They seek for help.
Girls BoysDensity=0.07
RESULTS
 Impact of social network on perceptual
engagement
 The 12 students who showed higher in-
degree centrality (centrality 2)
perceived a significantly lower
perceptual engagement.
 The 9 students who showed higher out-
degree centrality (centrality 2)
perceived higher level of perceptual
engagement.
“CHOOSE YOUR CLASSMATES, YOUR GPA IS AT STAKE!”
THE ASSOCIATION OF CROSS-CLASS SOCIAL TIES AND
ACADEMIC PERFORMANCE
DRAGAN GASEVIC, AMAL ZOUAQ, AND ROBERT JANZEN (2013)
CONTEXT OF THE STUDY
 Aim of the study is to investigate the relationship between student academic performance and social
ties.
 The term (generally used in the article) Social capital can be defined as-» investment in social relations
with expected returns in the marketplace »
 Position in social networks is an important predictor of individual and group performance
RESEARCH QUESTIONS
 Hypothesis 1: Students’ social capital accumulated through their enrollment in courses while pursuing a
degree program is positively associated with their academic performance.
 Hypothesis 2: Students with more social capital in cross-class networks have a significantly higher
academic performance.
RESEARCH METHOD- SAMPLE
 10 years (between 2001 and 2011)of student course enrolment records (N=505) in a master’s degree
program offered through distance education at a Canadian university.
 The program is completely delivered through an online, distance education model with courses enrolling
up to 30-40 students per session. Course content and group learning is delivered by using the learning
management system Moodle.
RESEARCH METHOD- DATA COLLECTION
 For the extraction of data from institutional archival data,
 A link was created between all students who enrolled into same section of a course.
 This helped to create undirected social graphs.
 Weight of link between two students depends on the number of course they took together.
RESEARCH METHOD- VARIABLES AND MEASUREMENT
 The Gephi open source software used for social network analysis to compute below social networking
variables
 Degree centrality ( the number of social ties a node has in a social network)
 Closeness centrality (the distance of a node to all other nodes in a social network)
 Betweenness centrality (the number of shortest paths between any two nodes that go through a given node)
 Eccentricity (the distance between a node and its farthest node in a social network)
RESEARCH METHOD- ANALYSIS
 Distribution of variables was explored by using Kolmogorov-Smirnov and Shapiro-Walk tests.
 For Hypothesis 1;
 Linear regression was used (GPA was the outcome variable)
 The regression models were adjusted for confounding variables like days in program, course withdrawals, course
cedits.
 For Hypothesis II;
 Sample was split into groups based on students’ amount of social capital which was defined by centrality
measures.
RESULTS
 Table shows the descriptive statistics of each variable.
 Since data was extracted from institutional archival data, there is no missing value.
RESULTS
 Hypothesis 1
 Tested to measure if there is a positive association between the students’ academic performance and
students’ social capital
 The results show significant associations between closeness centrality and GPA, and eccentricity and
GPA.
RESULTS
 Hypothesis 2
 Participants were devided into groups according to amount of their social capital.
 Q1 is highest social capital, Q4 is lowest social capital.
 Results showed that Q1 and Q2 have significantly higher GPA than Q3 and Q4.
 Based on the results, higher levels of social capital have significantly higher GPA values than those with
lower levels of social capital in cross-class social networks.
THANK YOU FOR LISTENING 
RECOMMENDATION:
PLEASE READ THE ARTICLES, THERE CAN BE MISSING POINTS IN THE PRESENTATION

Learnıng analytıcs ın educatıon

  • 1.
    LEARNING ANALYTICS INEDUCATION SOCIAL NETWORK ANALYSIS YILDIZ UZUN
  • 2.
    A SOCIAL NETWORKANALYSIS ON ELEMENTARY STUDENT ENGAGEMENT IN THE NETWORKED CREATION COMMUNITY CHEN-CHUNG LIU , YU-CHI CHEN , SHU-JU DIANA TAI (COMPUTERS AND EDUCATION, 2017)
  • 3.
    CONTEXT OF THESTUDY  The goals of the study is to understand the impact of the social networking activities on elementary students' engagement in the networked creation community.  Compares students' engagement in two settings;  Students freely team up with peers (dynamic teaming)  Students work with a fixed peer (fixed relation)
  • 4.
    RESEARCH QUESTIONS  Dothe dynamic teaming activities impact the students' flow and motivation in the networked creation activity?  How do the students team and collaborate with peers to participate in the networked creation activity?  Do the students' properties in the social network have an impact on their flow and motivation in the networked creation activity
  • 5.
    RESEARCH METHOD- PARTICIPANTS This study is part of a year-long program aiming at helping students develop their proficiency in English, computer use, and collaboration through collaborative digital storytelling.  26- third grade students in an elementary school in northern Taiwan, aged between 8 and 9
  • 6.
    RESEARCH METHOD- INSTRUMENTS There are 3 instruments:  Storytelling and social networking  to create multimedia stories on the Internet, Story & Painting House, social networking application was developed to facilitate the process of the networked creation activity  students could invite peers to create a shared multimedia story  Once an invitation was sent, it would be instantly logged by the system and a link from inviter to invitee would be presented in the SNA tool for further analysis.
  • 7.
    RESEARCH METHOD- INSTRUMENTS The flow perception survey  this survey investigates student engagement in four basic flow components including the level of control, attention, curiosity and intrinsic interest  consists of only four 5-point Likert items and  administrated right at the end of each activity section  Motivated Strategies for Learning Questionnaire (MSLQ)  While the flow survey was conducted to obtain students' short term engagement right after each activity section, the Motivated Strategies for Learning Questionnaire (MSLQ) was conducted to uncover the long-term impact of the networked creation activity on participants' motivation associated with the fixed relation and dynamic teaming activities.  The questionnaire includes 25 items asking students’ motivation in the dimensions of self-efficacy, extrinsic/intrinsic goal orientation, task value and peer learning
  • 8.
    RESEARCH METHOD- PROCEDURE The networked creation activity was implemented during a semester, for an 80-min session per week.  Students  First 5 weeks => fixed teams, from 6 to 13 week => dynamic teams (total 13 section)  After each section, they answered flow perception survey. Motivated Strategies for Learning Questionnaire (MSLQ) was administrated in week 5 and 13 to assess motivation Read the story Create picture book collaboratively Publish the books
  • 9.
    RESEARCH METHOD- DATAANALYSIS  Flow perception and motivation questionnaires were analyzed with dependent t-test. (RQ1)  Participants’ invitation activities on the social network were analyzed with the UCINET SNA tool. (RQ2)  Their perceptual engagement was also compared based on their degree centrality with t-test (RQ3)
  • 10.
    RESULTS  Perceptual engagementin fixed relation and dynamic alignment activities  participants perceived relatively lower level of flow in the first 5 weeks when the fixed relation activity was implemented and the flow perception was at a higher level during week 6 to 13 when the dynamic teaming activity was administered.
  • 11.
    RESULTS  Perceptual engagementin fixed relation and dynamic alignment activities  in the dynamic teaming activity, participants’ average flow perception was 4.52, which is significantly higher than that in fixed relation activity (table 1)  Participants perceived a significantly higher level of motivation in the dynamic teaming activity than they did in the fixed relation activity in two dimensions: intrinsic motivation and task value
  • 12.
    RESULTS  Social NetworkAnalysis  elementary students tended to team up with students of the same gender when participating in the networked creation activity.  Figure shows in-degree centrality (who recieved more invitation), there are 12 student in the circle 6 boys and 6 girls. High popularity not depends on gender on elementary students.  Also, their content knowledge varies among 12. content knowledge not effect popularity. They were not invited because of their knowledge. Girls BoysDensity=0.0 7
  • 13.
    RESULTS  Social NetworkAnalysis  Figure shows out-degree centrality. There are 9 participant in the circle 5 boy, 4 girl.  Their english profeciency levels are mid and low.  Results show that the lower-proficiency students are more active in teaming up and invitations. They seek for help. Girls BoysDensity=0.07
  • 14.
    RESULTS  Impact ofsocial network on perceptual engagement  The 12 students who showed higher in- degree centrality (centrality 2) perceived a significantly lower perceptual engagement.  The 9 students who showed higher out- degree centrality (centrality 2) perceived higher level of perceptual engagement.
  • 15.
    “CHOOSE YOUR CLASSMATES,YOUR GPA IS AT STAKE!” THE ASSOCIATION OF CROSS-CLASS SOCIAL TIES AND ACADEMIC PERFORMANCE DRAGAN GASEVIC, AMAL ZOUAQ, AND ROBERT JANZEN (2013)
  • 16.
    CONTEXT OF THESTUDY  Aim of the study is to investigate the relationship between student academic performance and social ties.  The term (generally used in the article) Social capital can be defined as-» investment in social relations with expected returns in the marketplace »  Position in social networks is an important predictor of individual and group performance
  • 17.
    RESEARCH QUESTIONS  Hypothesis1: Students’ social capital accumulated through their enrollment in courses while pursuing a degree program is positively associated with their academic performance.  Hypothesis 2: Students with more social capital in cross-class networks have a significantly higher academic performance.
  • 18.
    RESEARCH METHOD- SAMPLE 10 years (between 2001 and 2011)of student course enrolment records (N=505) in a master’s degree program offered through distance education at a Canadian university.  The program is completely delivered through an online, distance education model with courses enrolling up to 30-40 students per session. Course content and group learning is delivered by using the learning management system Moodle.
  • 19.
    RESEARCH METHOD- DATACOLLECTION  For the extraction of data from institutional archival data,  A link was created between all students who enrolled into same section of a course.  This helped to create undirected social graphs.  Weight of link between two students depends on the number of course they took together.
  • 20.
    RESEARCH METHOD- VARIABLESAND MEASUREMENT  The Gephi open source software used for social network analysis to compute below social networking variables  Degree centrality ( the number of social ties a node has in a social network)  Closeness centrality (the distance of a node to all other nodes in a social network)  Betweenness centrality (the number of shortest paths between any two nodes that go through a given node)  Eccentricity (the distance between a node and its farthest node in a social network)
  • 21.
    RESEARCH METHOD- ANALYSIS Distribution of variables was explored by using Kolmogorov-Smirnov and Shapiro-Walk tests.  For Hypothesis 1;  Linear regression was used (GPA was the outcome variable)  The regression models were adjusted for confounding variables like days in program, course withdrawals, course cedits.  For Hypothesis II;  Sample was split into groups based on students’ amount of social capital which was defined by centrality measures.
  • 22.
    RESULTS  Table showsthe descriptive statistics of each variable.  Since data was extracted from institutional archival data, there is no missing value.
  • 23.
    RESULTS  Hypothesis 1 Tested to measure if there is a positive association between the students’ academic performance and students’ social capital  The results show significant associations between closeness centrality and GPA, and eccentricity and GPA.
  • 24.
    RESULTS  Hypothesis 2 Participants were devided into groups according to amount of their social capital.  Q1 is highest social capital, Q4 is lowest social capital.  Results showed that Q1 and Q2 have significantly higher GPA than Q3 and Q4.  Based on the results, higher levels of social capital have significantly higher GPA values than those with lower levels of social capital in cross-class social networks.
  • 25.
    THANK YOU FORLISTENING  RECOMMENDATION: PLEASE READ THE ARTICLES, THERE CAN BE MISSING POINTS IN THE PRESENTATION