Download to read offline
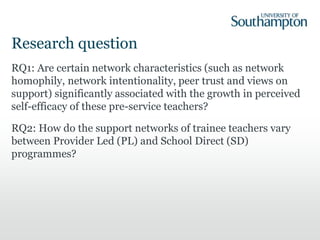
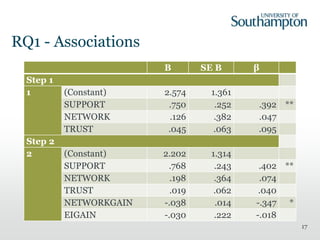
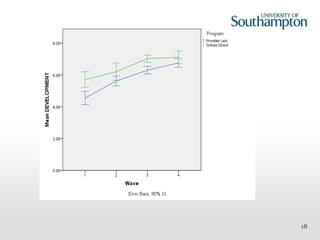
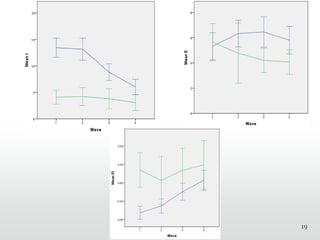

This document summarizes a longitudinal study of the support networks of pre-service mathematics and science teachers in the UK. The study collected data from teachers in both provider-led and school-directed training programs over 4 time periods. It found that: 1) Teachers' views on the importance of support remained consistent over time, while their self-efficacy and networks changed, with self-efficacy increasing significantly. 2) Having more positive views on support was associated with greater growth in self-efficacy, while increasing network heterogeneity over time was associated with less growth. 3) Teachers in school-directed programs started with higher self-efficacy but increased less over time, while provider-led teachers'


