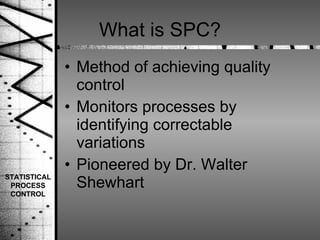
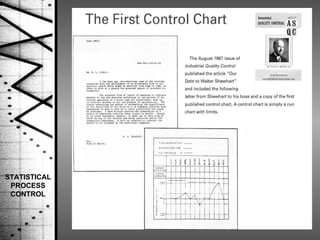
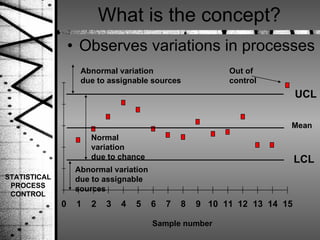
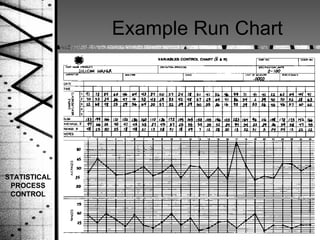
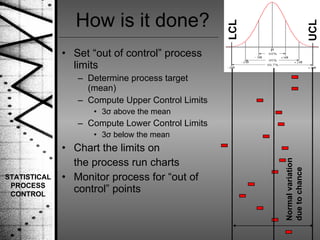
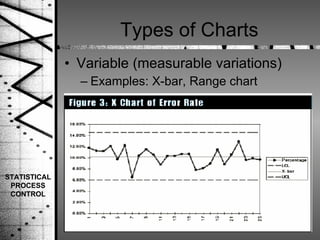
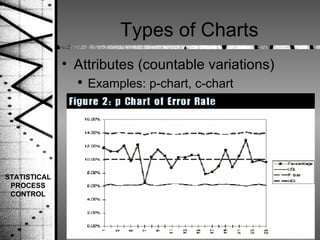
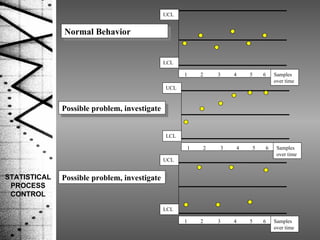
STATISTICAL PROCESS CONTROL Presented by:  Alisha Payton
What is SPC? Method of achieving quality control Monitors processes by identifying correctable variations Pioneered by Dr. Walter Shewhart STATISTICAL PROCESS CONTROL
STATISTICAL PROCESS CONTROL
What is the concept? Observes variations in processes 0 1 2 3 4 5 6 7 8 9 10 11 12 13 14 15 UCL LCL Sample number Mean Out of control Normal variation due to chance Abnormal variation due to assignable sources Abnormal variation due to assignable sources STATISTICAL PROCESS CONTROL
Example Run Chart STATISTICAL PROCESS CONTROL
How is it done? Set “out of control” process limits Determine process target (mean) Compute Upper Control Limits 3 σ  above the mean Compute Lower Control Limits 3 σ  below the mean Chart the limits on  the process run charts  Monitor process for “out of control” points Normal variation due to chance UCL LCL STATISTICAL PROCESS CONTROL
Types of Charts Variable (measurable variations) Examples: X-bar, Range chart STATISTICAL PROCESS CONTROL
Types of Charts Attributes (countable variations) Examples: p-chart, c-chart STATISTICAL PROCESS CONTROL
Normal Behavior Possible problem, investigate Possible problem, investigate UCL LCL Samples over time  1  2  3  4  5  6 UCL LCL Samples over time  1  2  3  4  5  6 UCL LCL Samples over time  1  2  3  4  5  6 STATISTICAL PROCESS CONTROL
How to use SPC software STATISTICAL PROCESS CONTROL
 

Statistical Process Control

  • 1.
    STATISTICAL PROCESS CONTROLPresented by: Alisha Payton
  • 2.
    What is SPC?Method of achieving quality control Monitors processes by identifying correctable variations Pioneered by Dr. Walter Shewhart STATISTICAL PROCESS CONTROL
  • 3.
  • 4.
    What is theconcept? Observes variations in processes 0 1 2 3 4 5 6 7 8 9 10 11 12 13 14 15 UCL LCL Sample number Mean Out of control Normal variation due to chance Abnormal variation due to assignable sources Abnormal variation due to assignable sources STATISTICAL PROCESS CONTROL
  • 5.
    Example Run ChartSTATISTICAL PROCESS CONTROL
  • 6.
    How is itdone? Set “out of control” process limits Determine process target (mean) Compute Upper Control Limits 3 σ above the mean Compute Lower Control Limits 3 σ below the mean Chart the limits on the process run charts Monitor process for “out of control” points Normal variation due to chance UCL LCL STATISTICAL PROCESS CONTROL
  • 7.
    Types of ChartsVariable (measurable variations) Examples: X-bar, Range chart STATISTICAL PROCESS CONTROL
  • 8.
    Types of ChartsAttributes (countable variations) Examples: p-chart, c-chart STATISTICAL PROCESS CONTROL
  • 9.
    Normal Behavior Possibleproblem, investigate Possible problem, investigate UCL LCL Samples over time 1 2 3 4 5 6 UCL LCL Samples over time 1 2 3 4 5 6 UCL LCL Samples over time 1 2 3 4 5 6 STATISTICAL PROCESS CONTROL
  • 10.
    How to useSPC software STATISTICAL PROCESS CONTROL
  • 11.

Editor's Notes