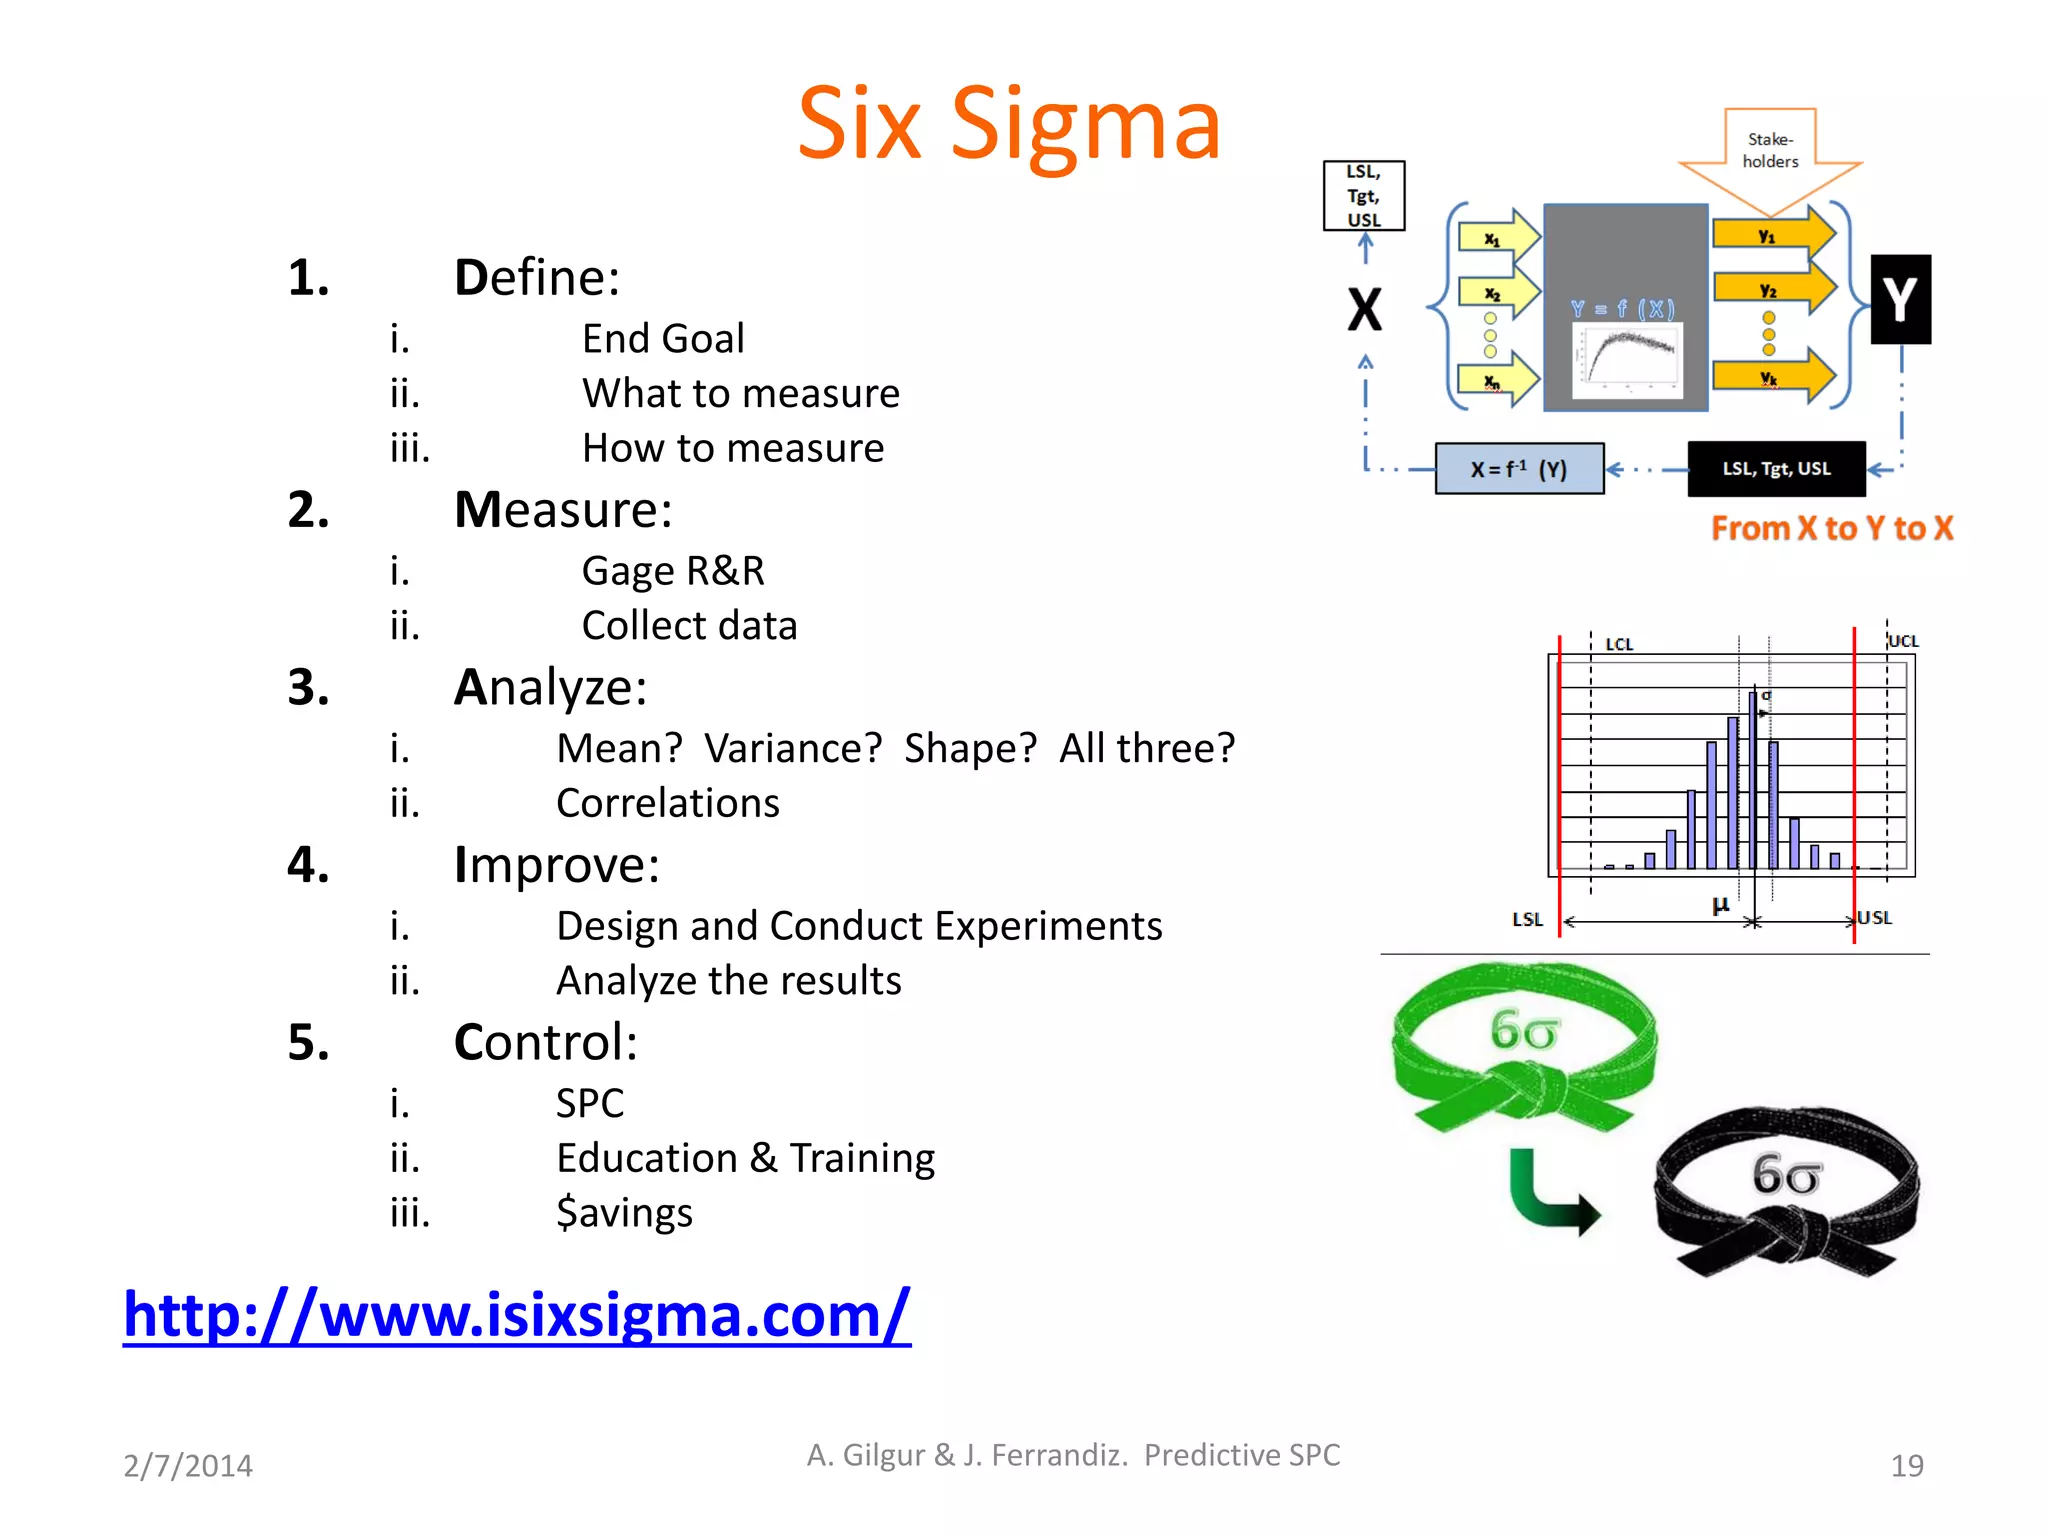
Download as PDF, PPTX
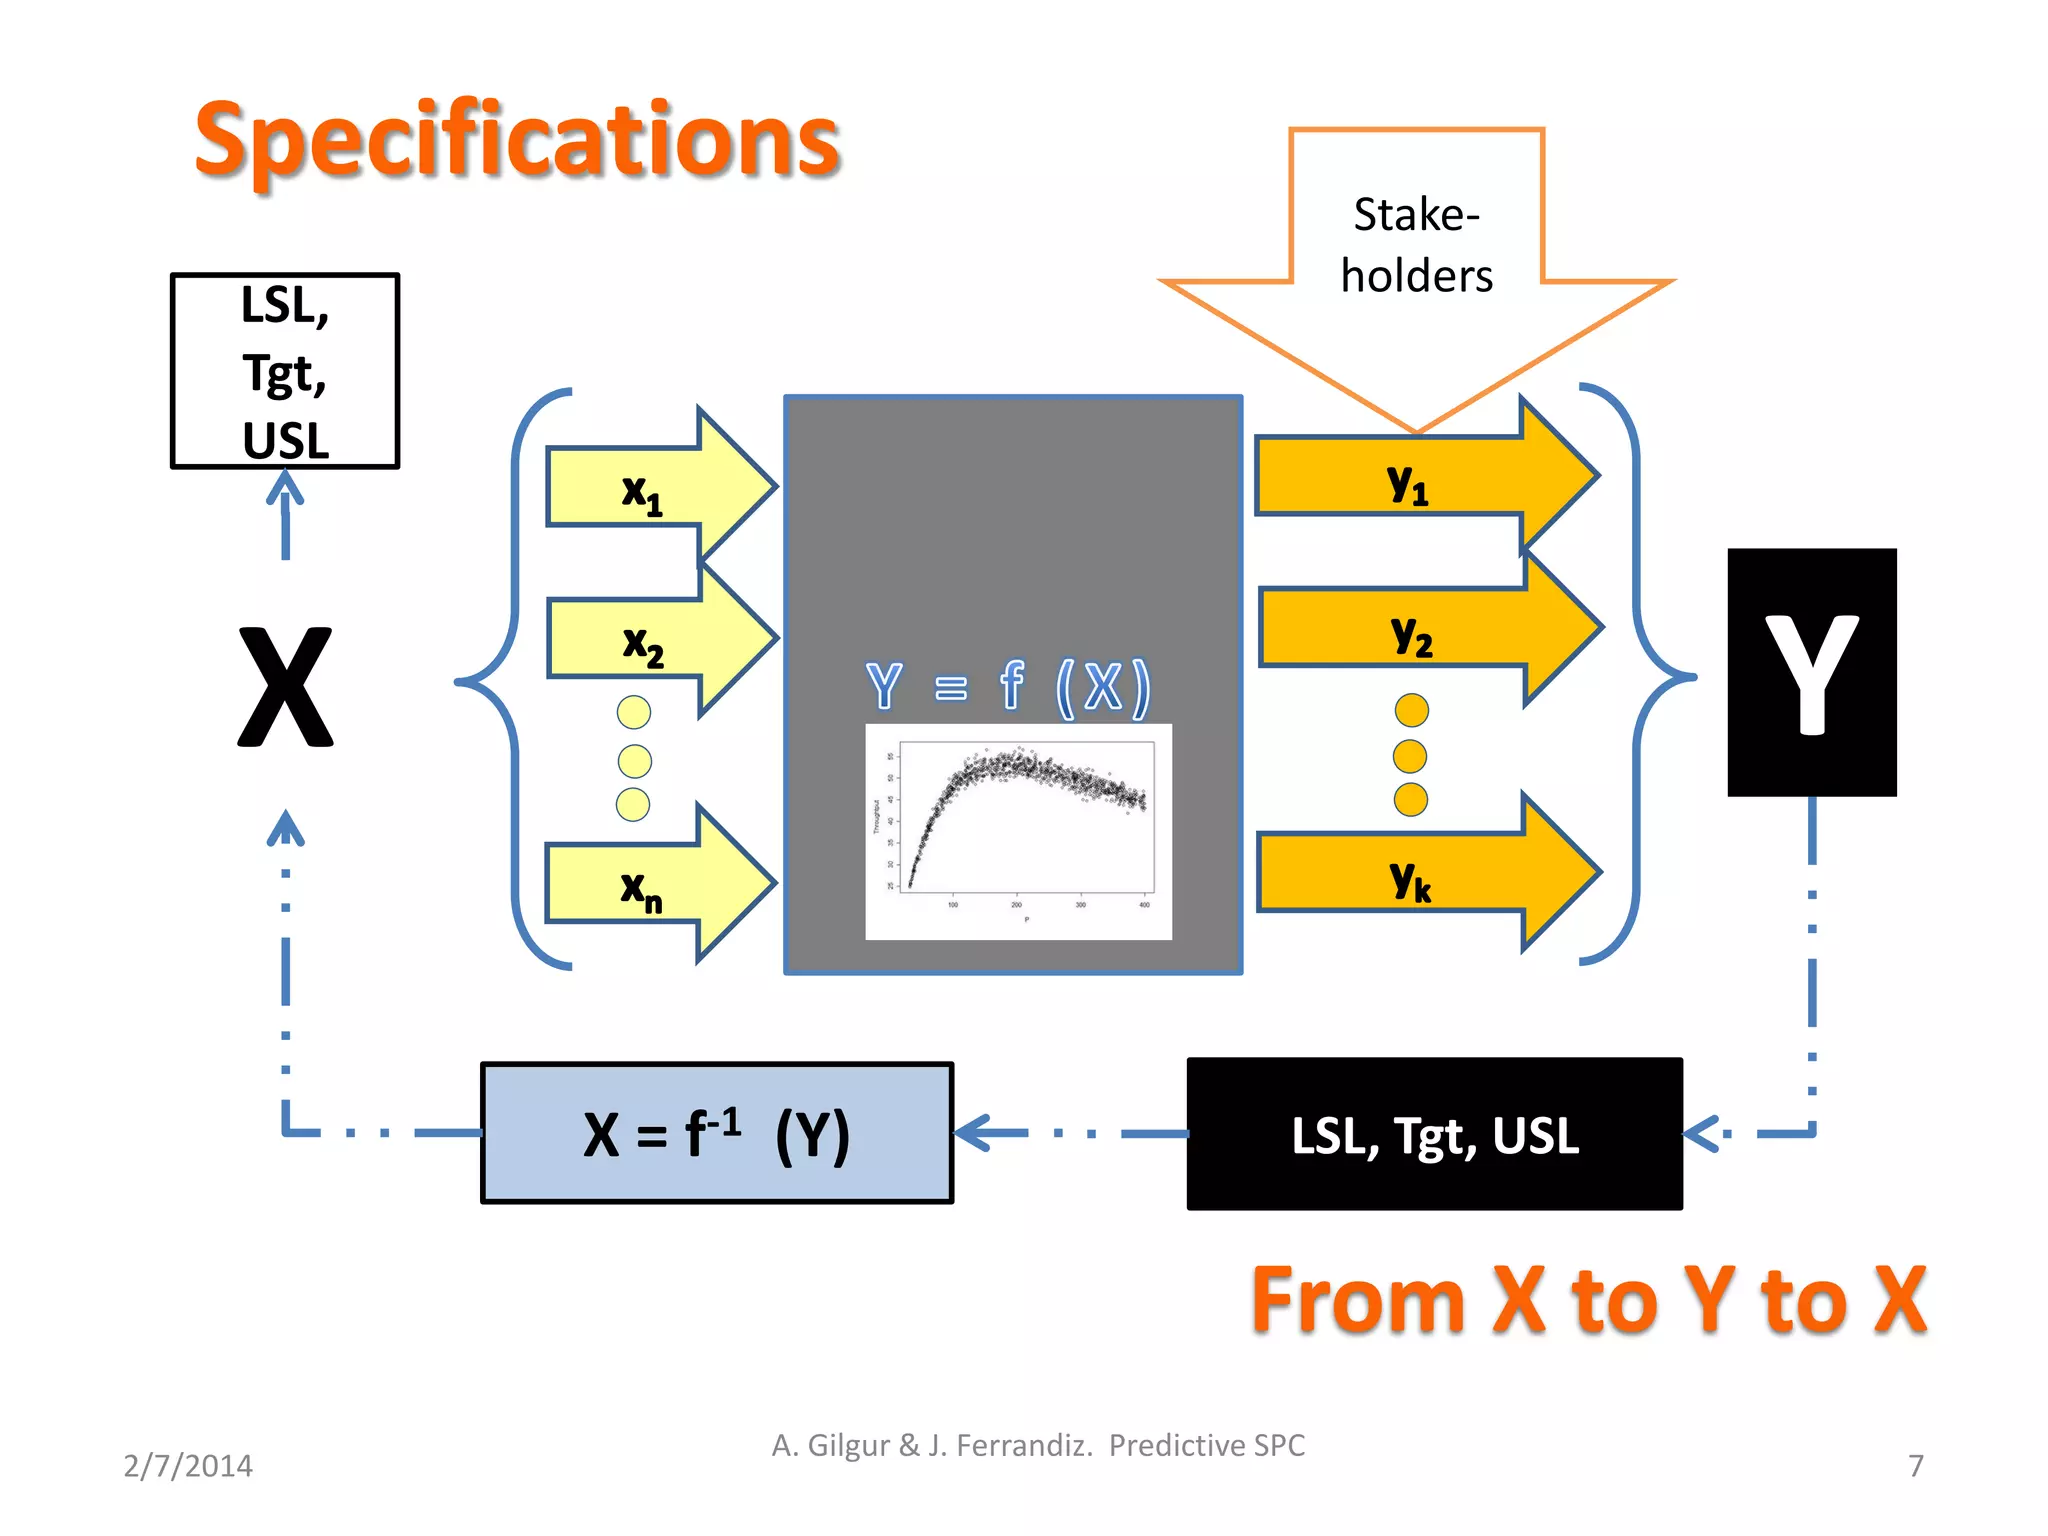
![Setting Specs is an optimization problem
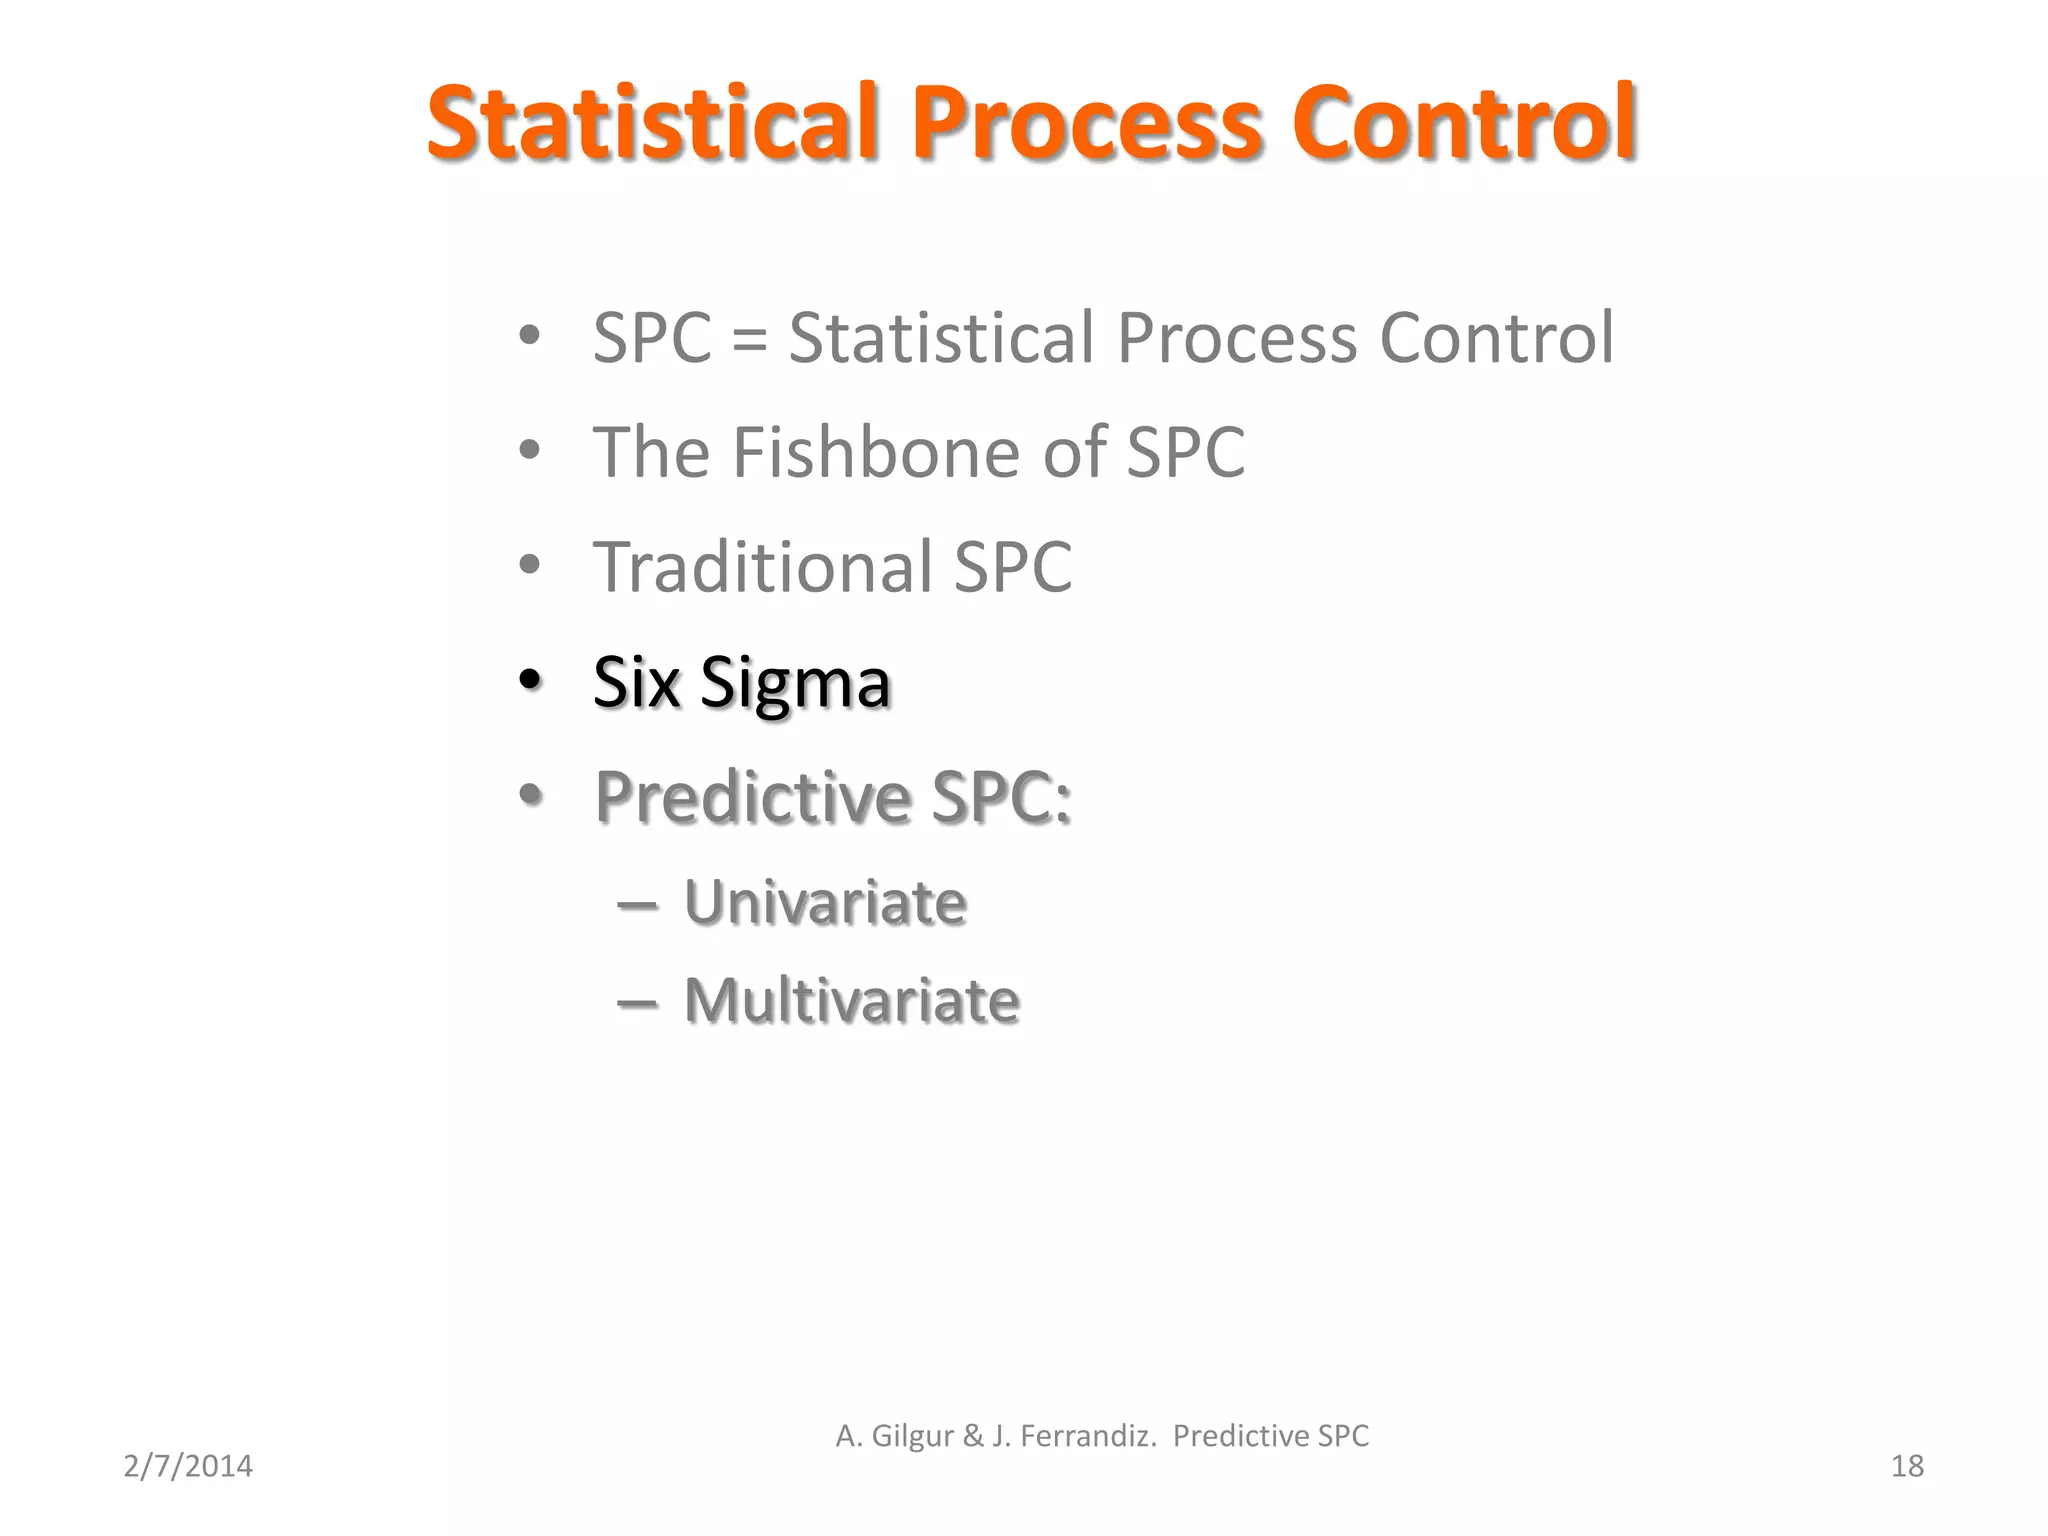
2/7/2014 6
p
Servers = argmax (Revenue |Budget)
Revenue = f[Throughput (Servers, SW, Budget)]
Servers = argmin (Budget | Revenue)
•Throughput = t (UX)
•Revenue = r (Throughput)
•Budget = f(SW, Servers)
Constraints:
•Domain
•Budget ≤ B
The business drives the specs
A. Gilgur & J. Ferrandiz. Predictive SPC](https://image.slidesharecdn.com/csp14predictivespc-150813074824-lva1-app6892/75/CSP2014-Predictive-SPC-6-2048.jpg)
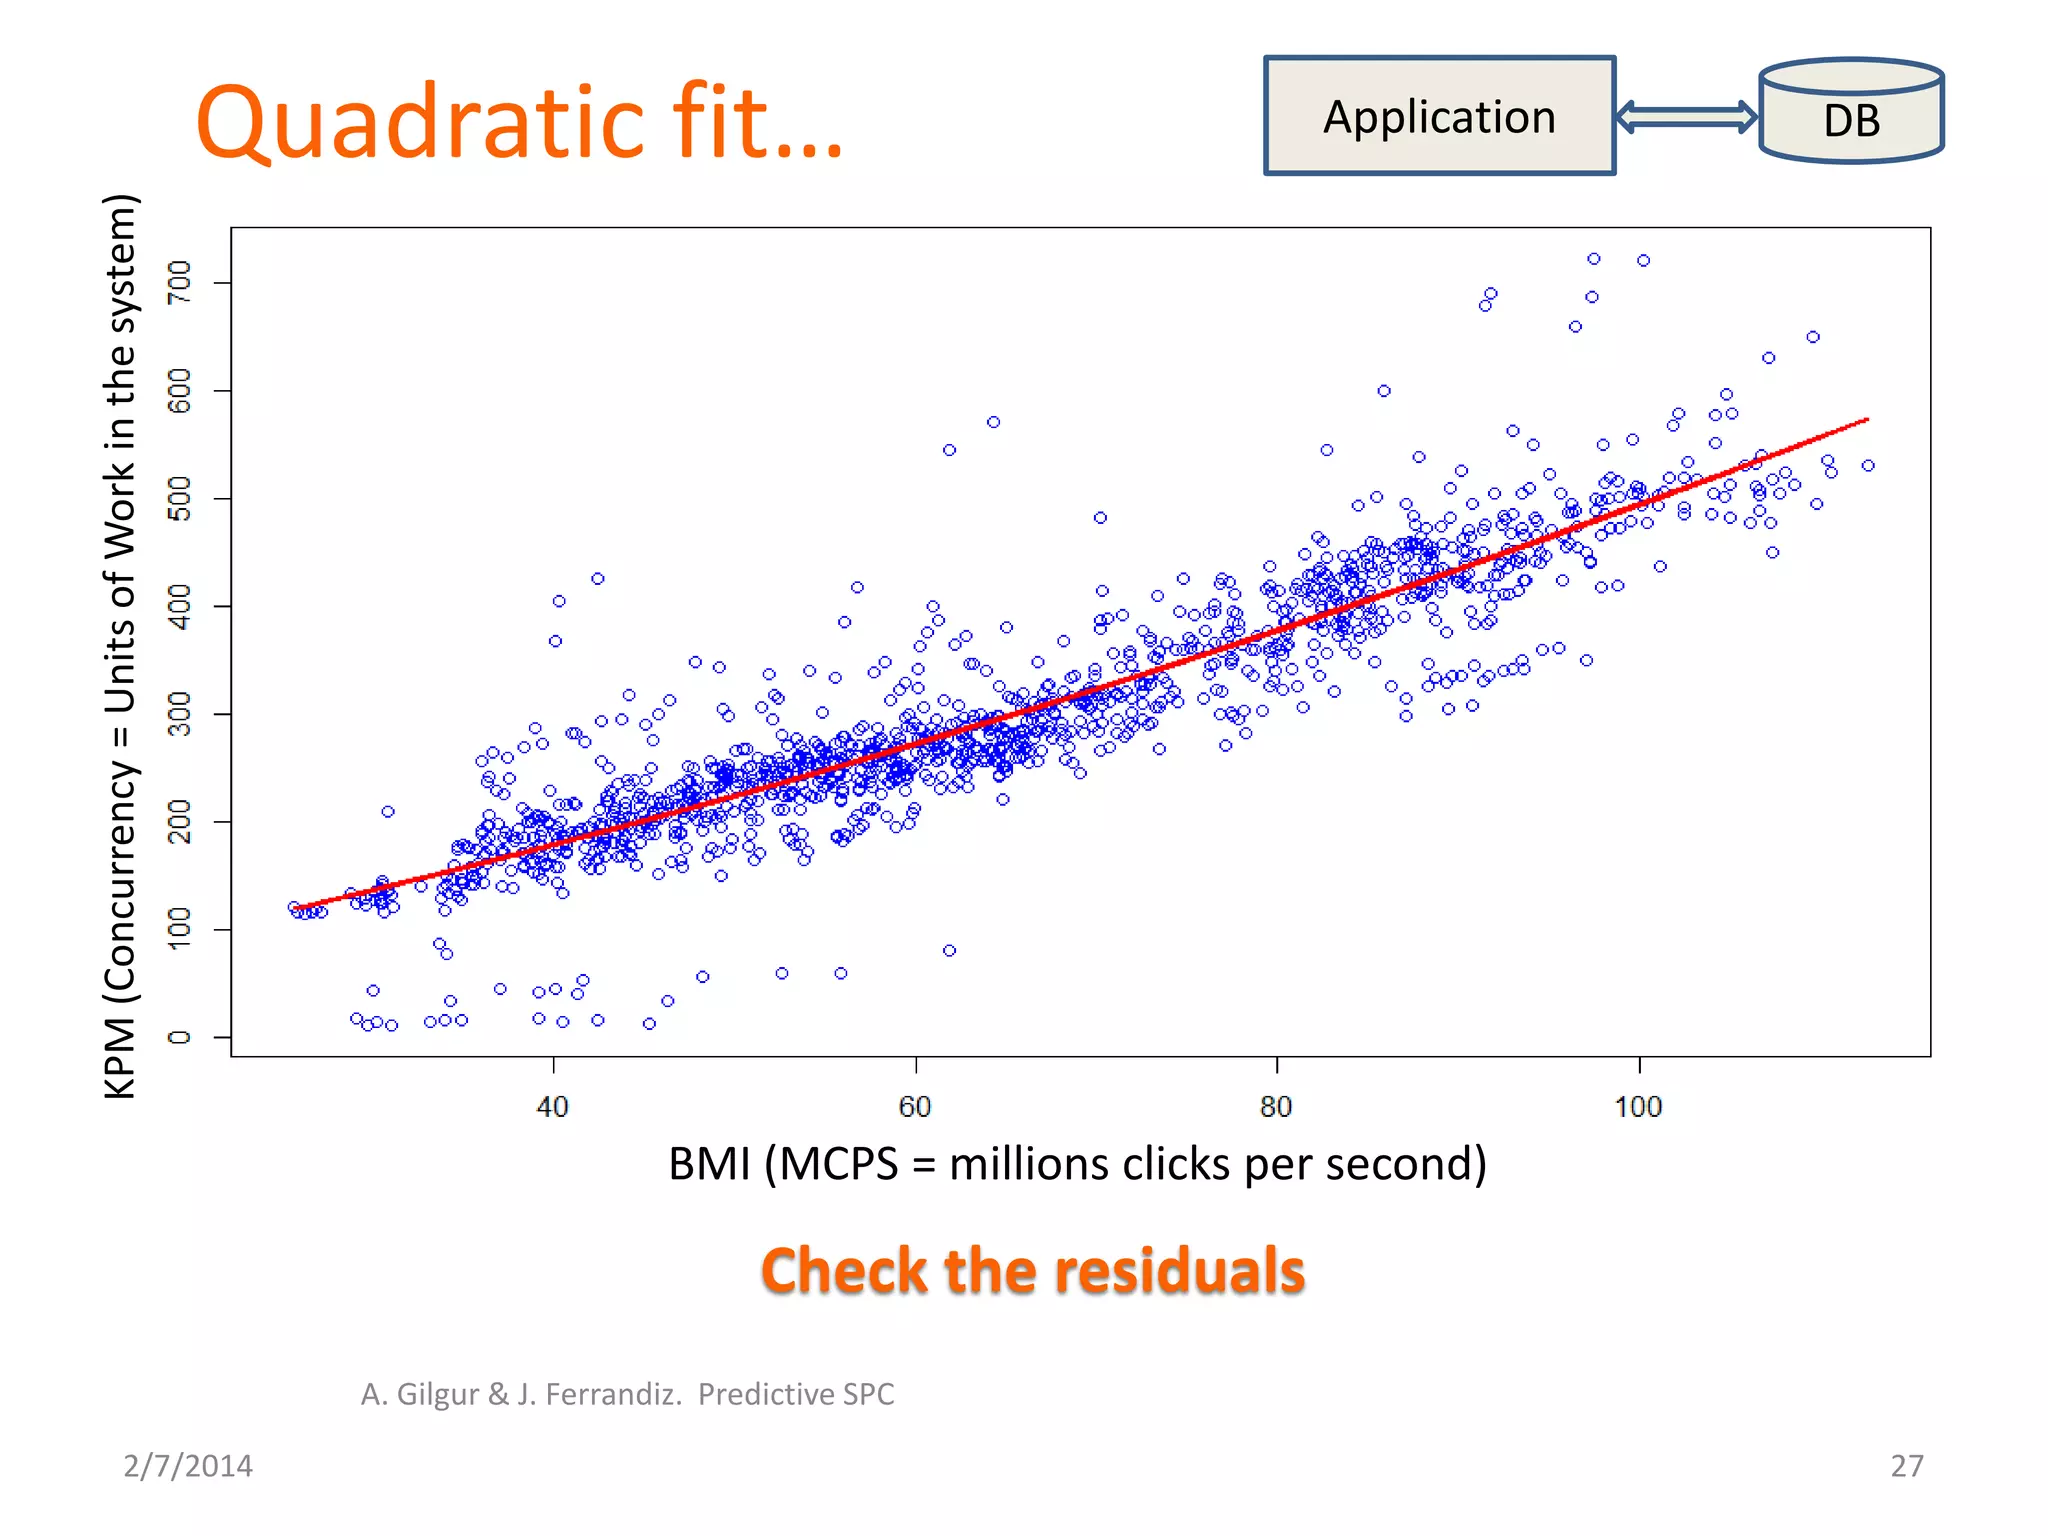
![A Business Model
2/7/2014
A. Gilgur & J. Ferrandiz. Predictive SPC
26
Application DB
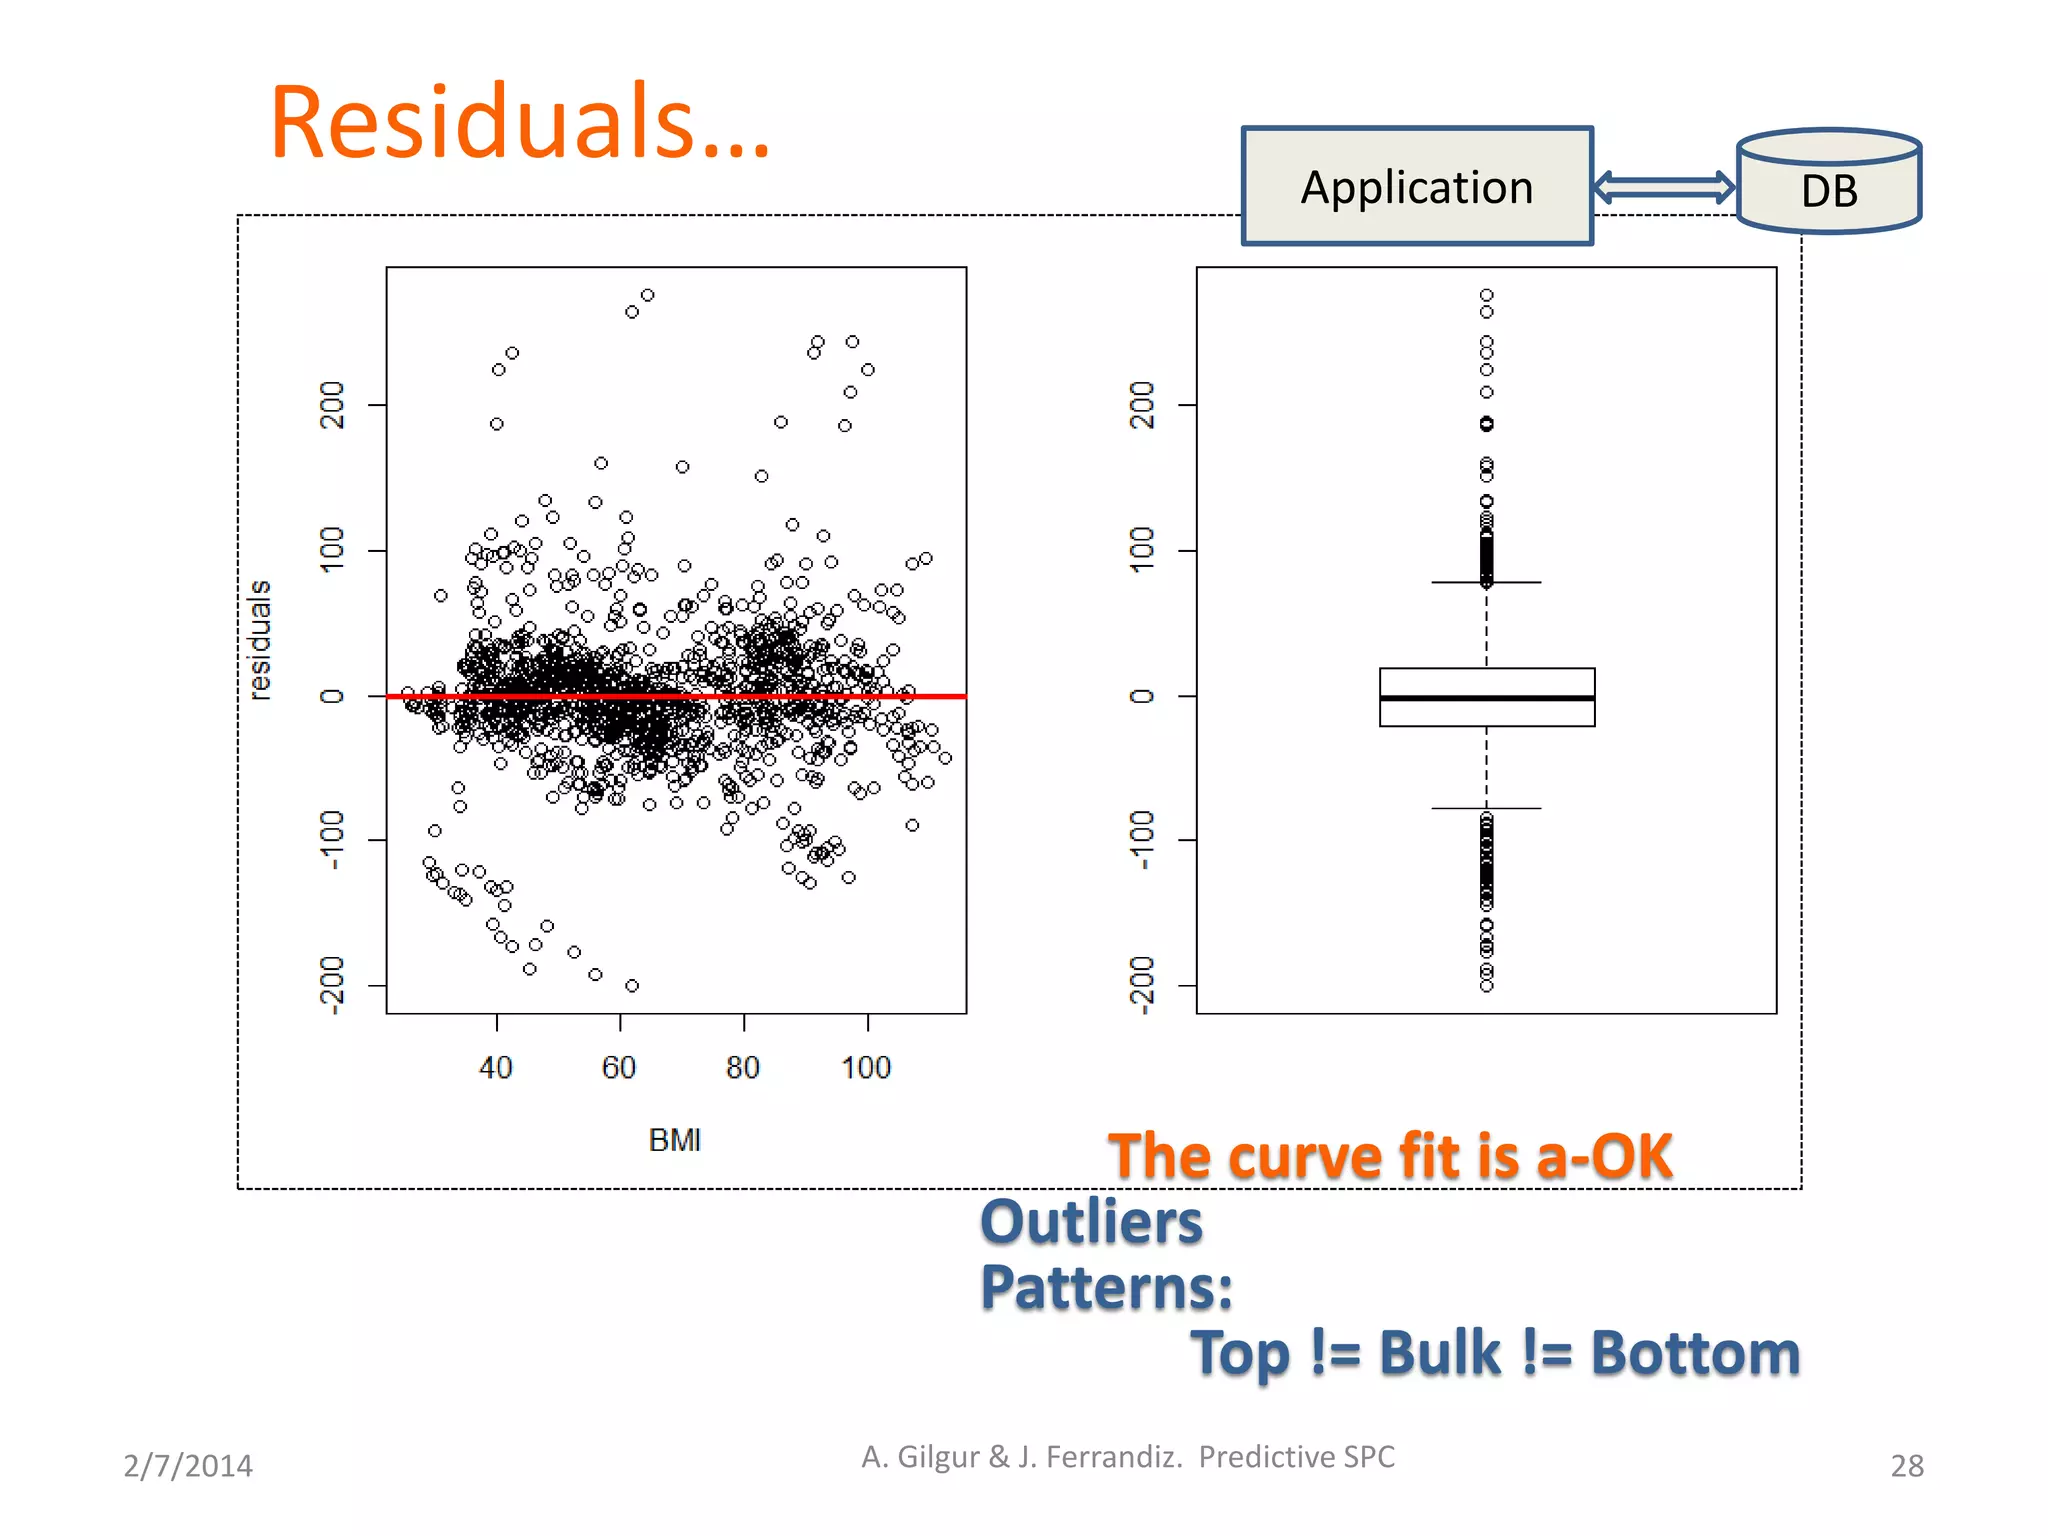
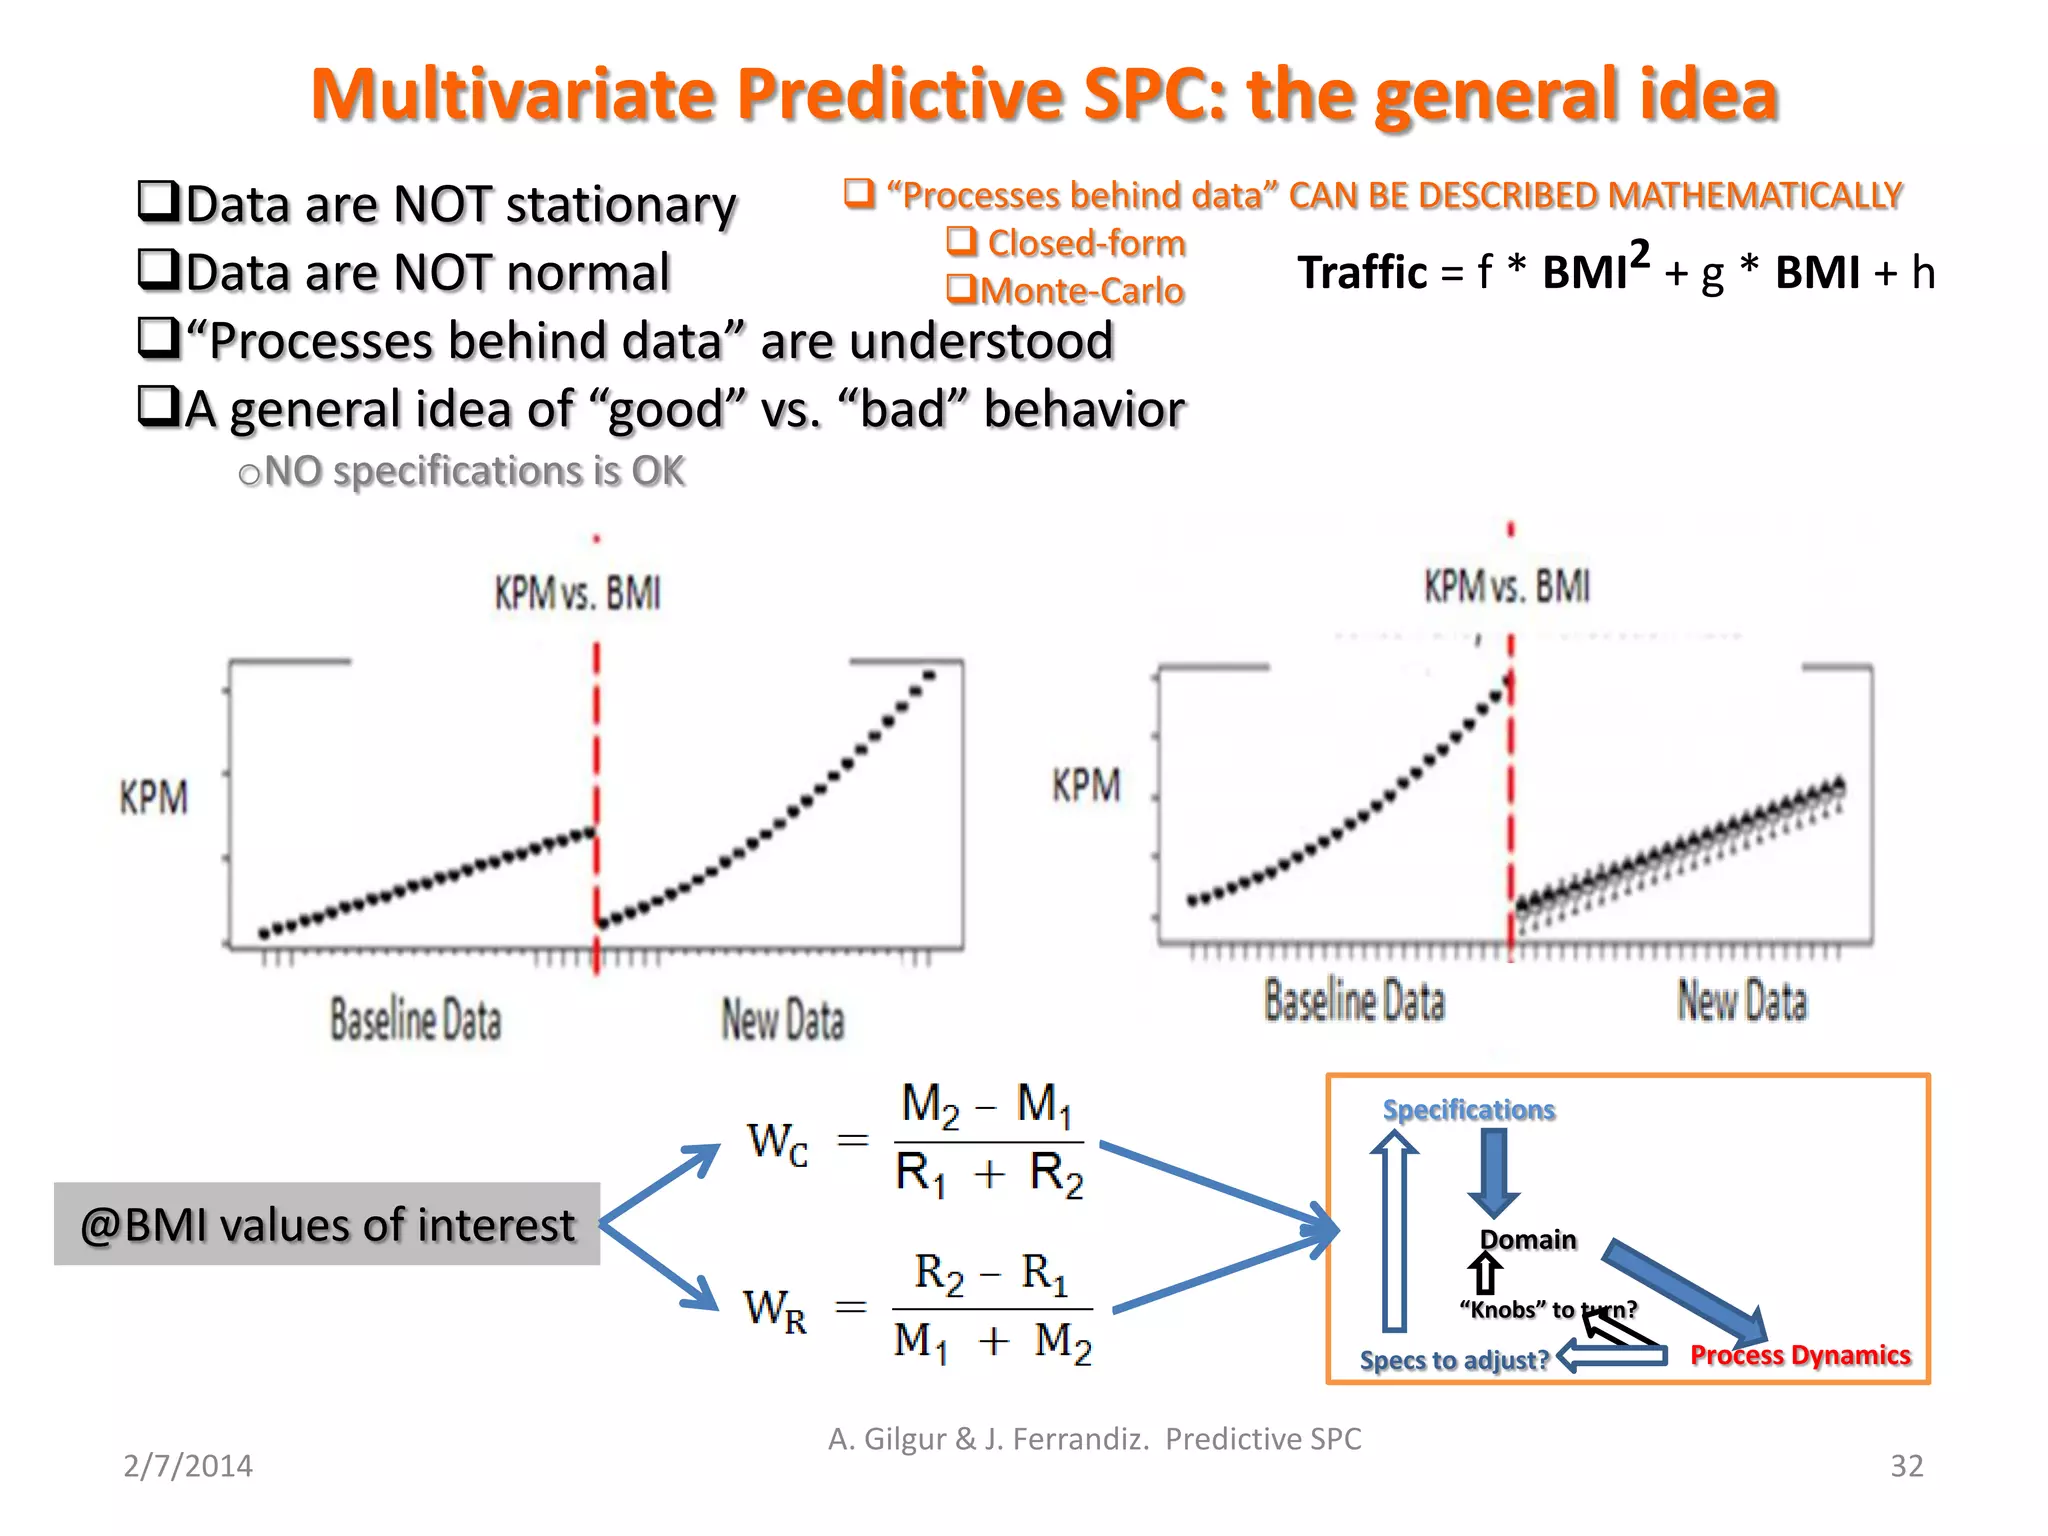
Makes sense to use parabola …
Traffic = # of units of work (worker threads in use) in the system
Little’s Law:
Traffic = Arrival_rate * Processing_time
Arrival_Rate = a * BMI + b
Processing_time = c * Arrival_rate + d
Traffic = (a * BMI + b) * [c * (a * BMI + b) + d]
Traffic = f * BMI2 + g * BMI + h
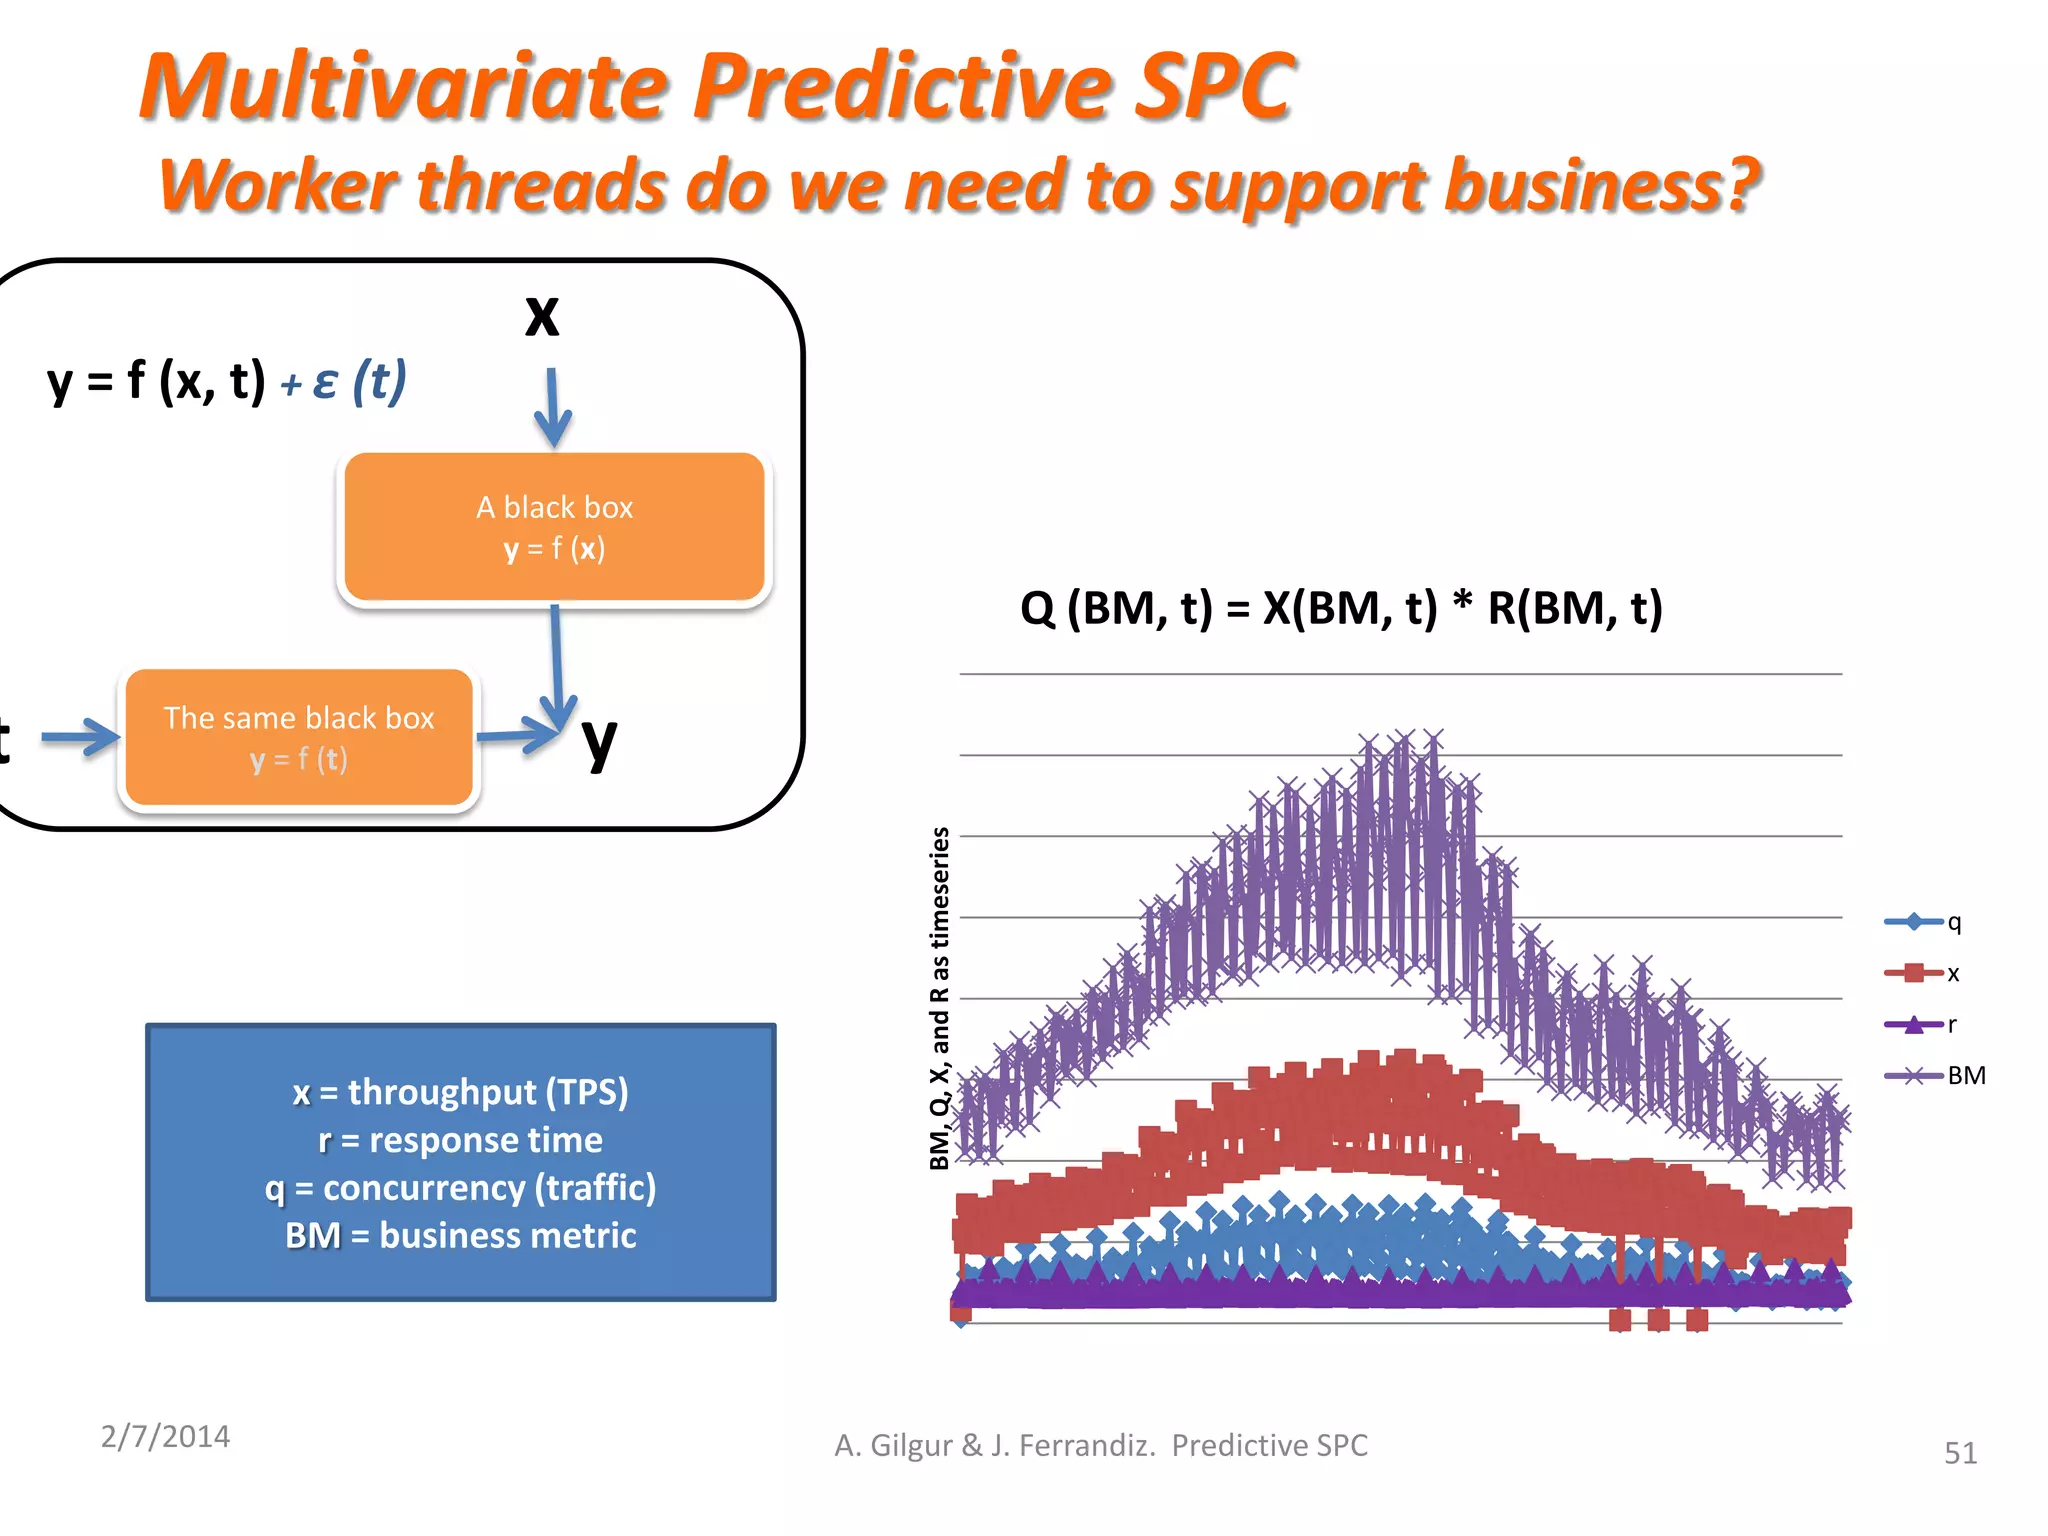
Multivariate Predictive SPC
x = throughput
r = response time
q = # of worker threads
BM = business metric](https://image.slidesharecdn.com/csp14predictivespc-150813074824-lva1-app6892/75/CSP2014-Predictive-SPC-26-2048.jpg)


![2/7/2014 44
Process Dynamics: A change in variance
Application DB
Server 1
Server 2
Server 3
Server N
Load
Balancer
Server [N+1]
Server [N+2]
Server [N + K]
Load Balancer:
• Has the load variance changed?
P-value
A. Gilgur & J. Ferrandiz. Predictive SPC](https://image.slidesharecdn.com/csp14predictivespc-150813074824-lva1-app6892/75/CSP2014-Predictive-SPC-44-2048.jpg)
![2/7/2014
A. Gilgur & J. Ferrandiz. Predictive SPC
45
Practical Application: Load Balancer
Application DB
Server 1
Server 2
Server 3
Server NLoad
Balancer
Server [N+1]
Server [N+2]
Server [N + K]
P-value
Normal distribution
Stationary processes
Xi: Server “i” got the transaction
wear and tear
from within
External
interaction](https://image.slidesharecdn.com/csp14predictivespc-150813074824-lva1-app6892/75/CSP2014-Predictive-SPC-45-2048.jpg)

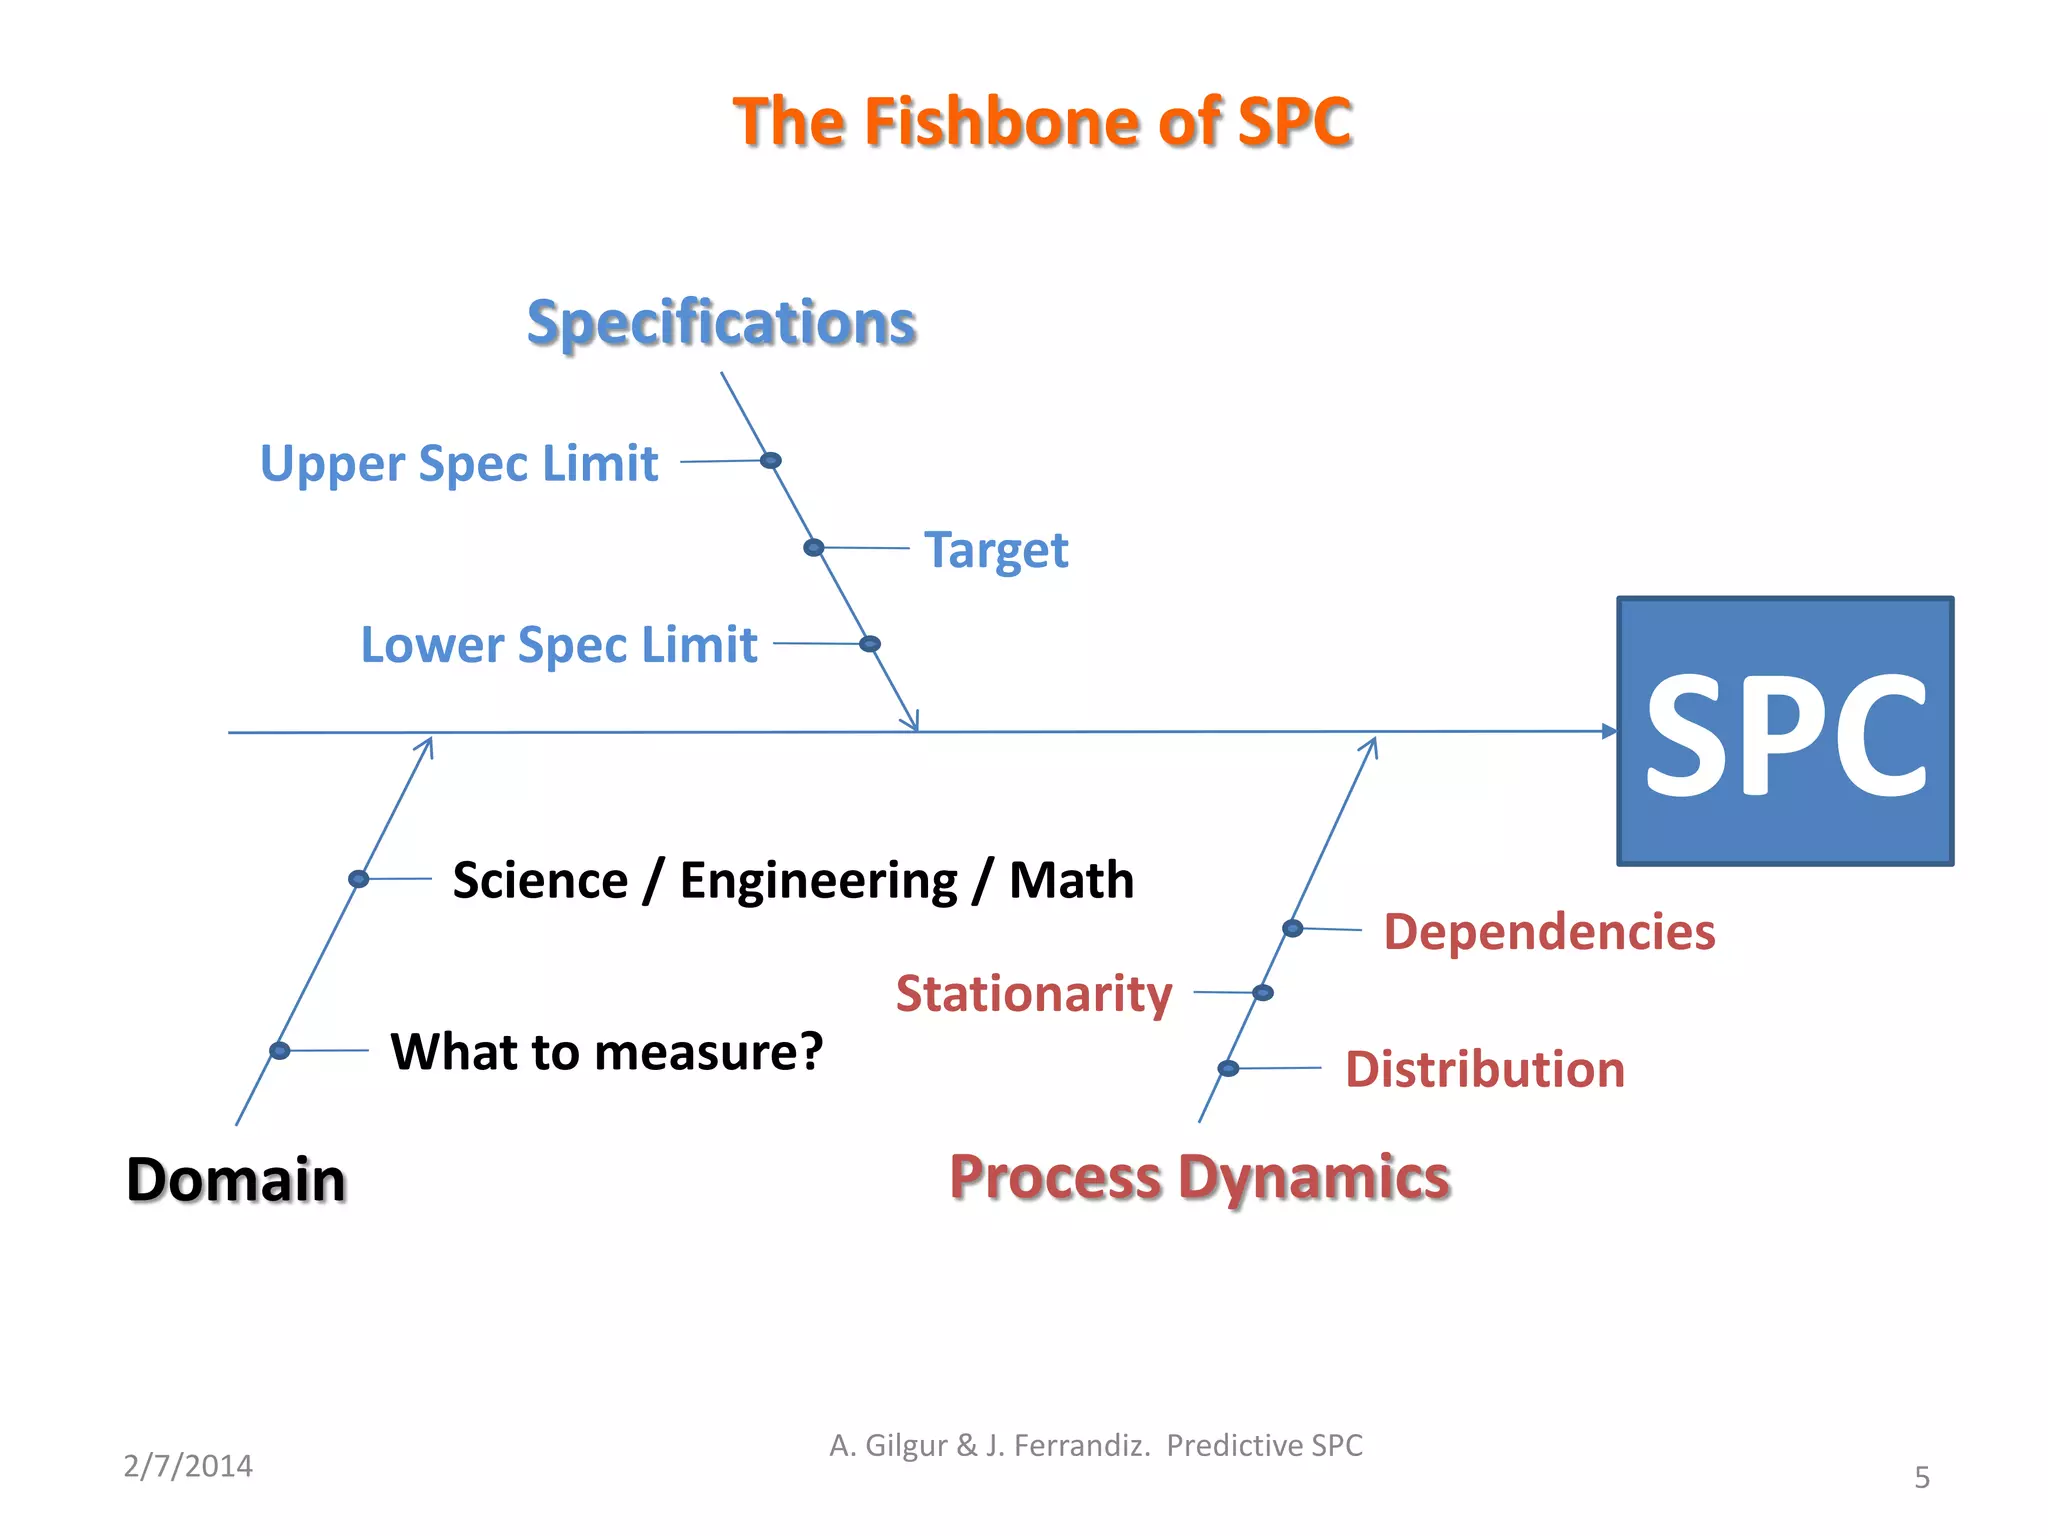
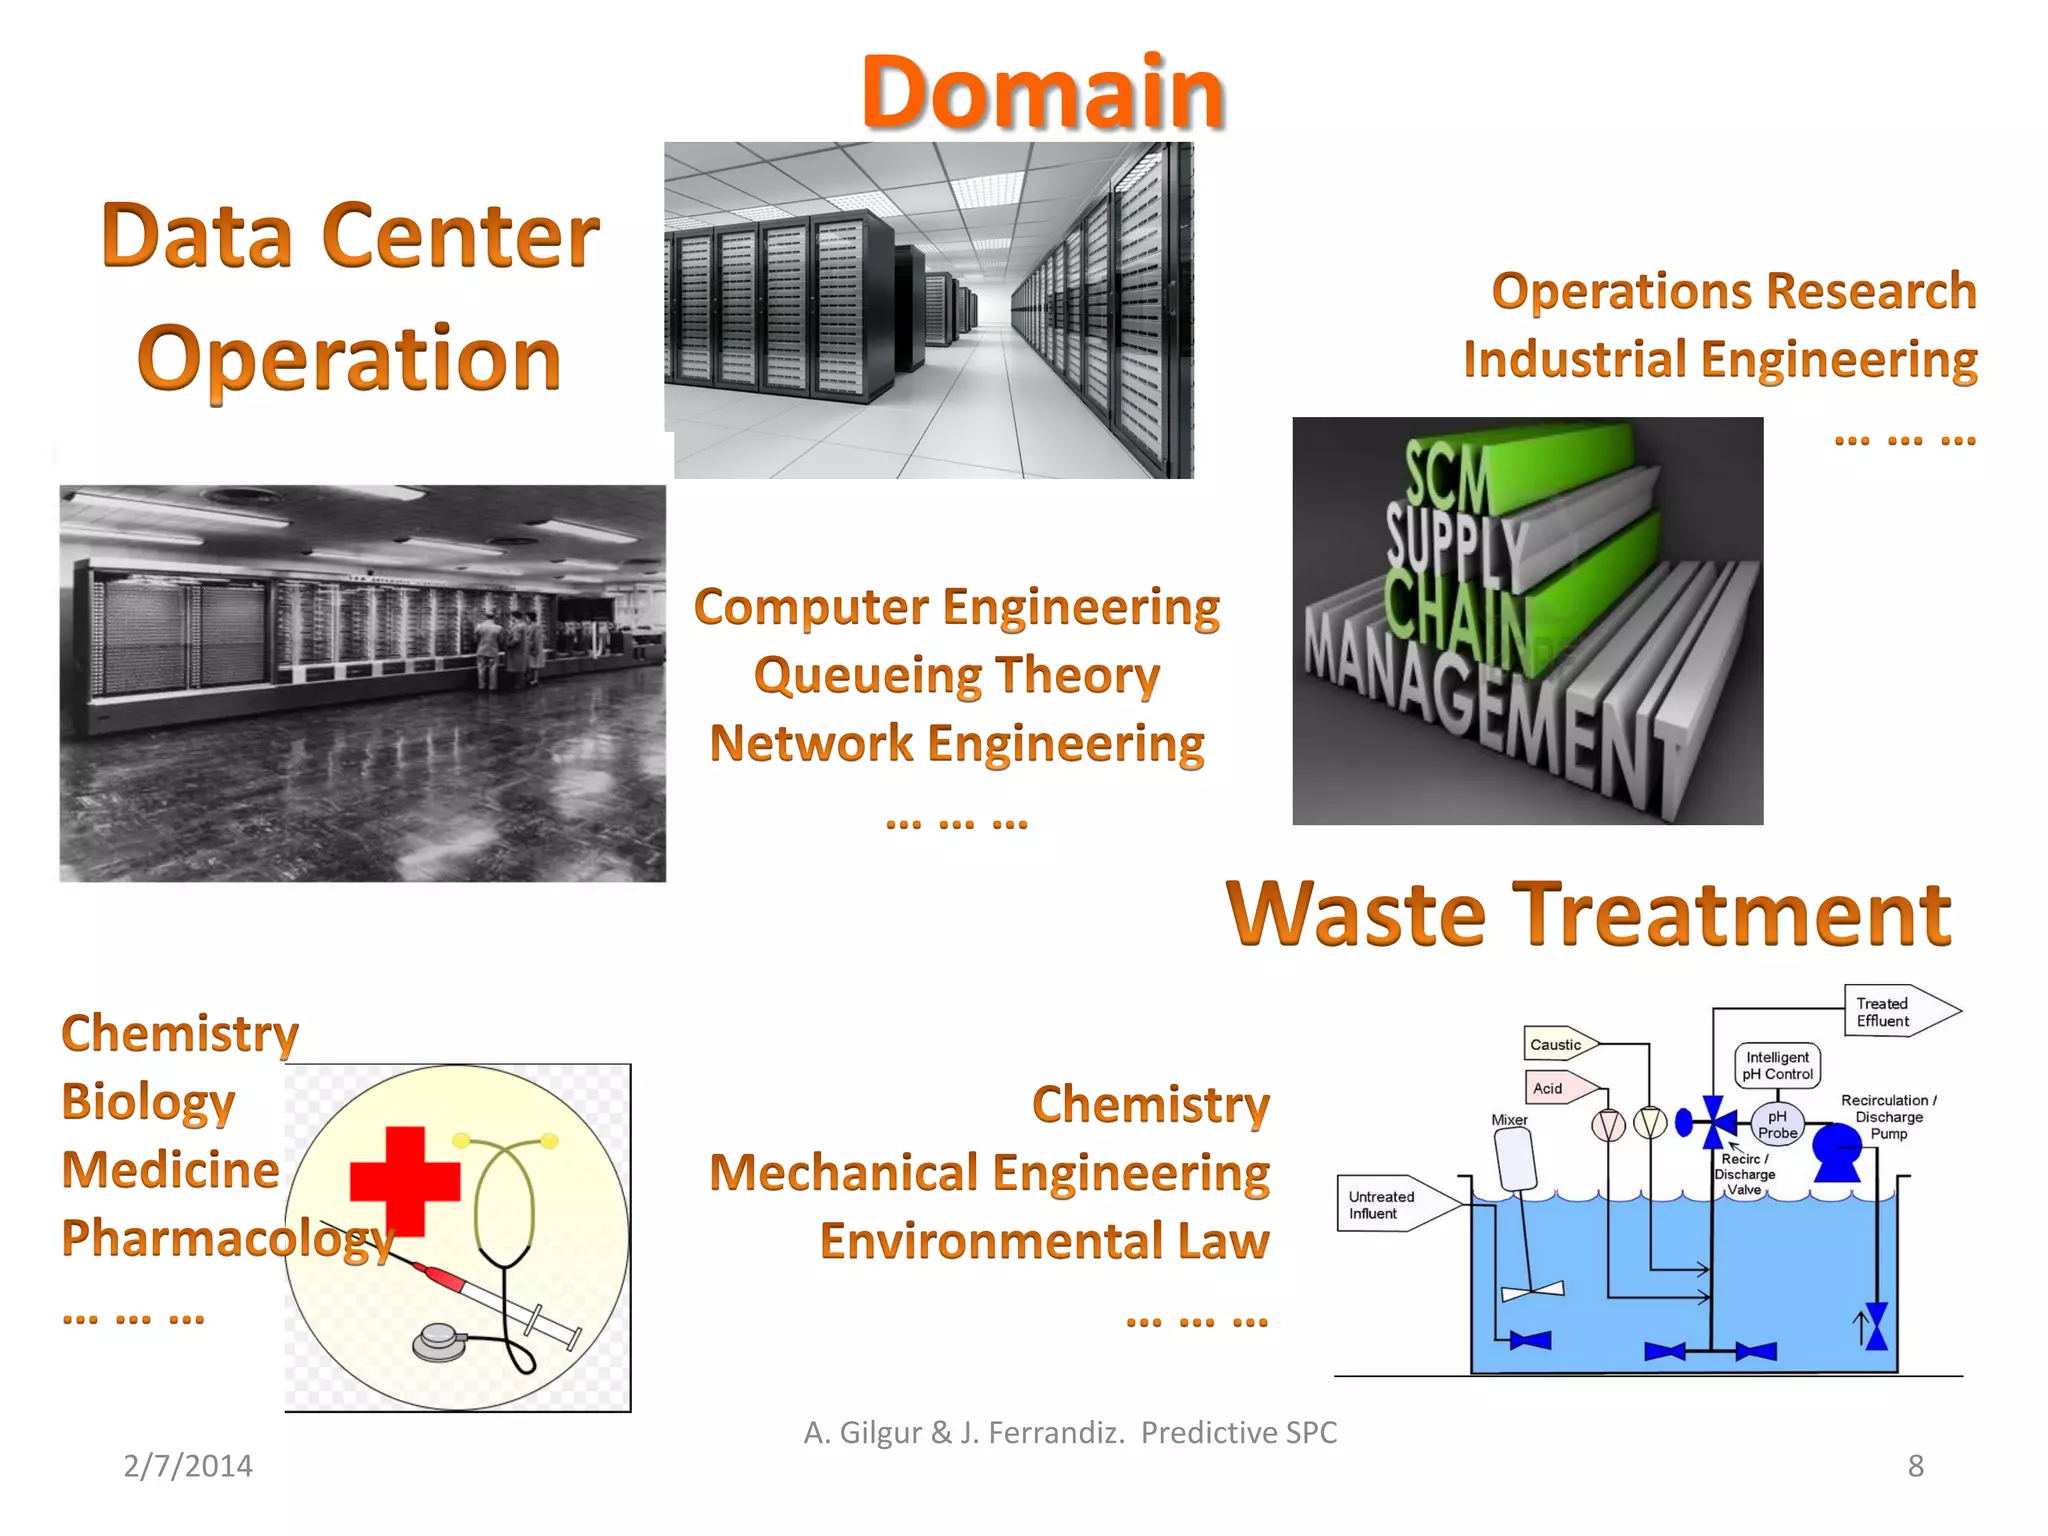
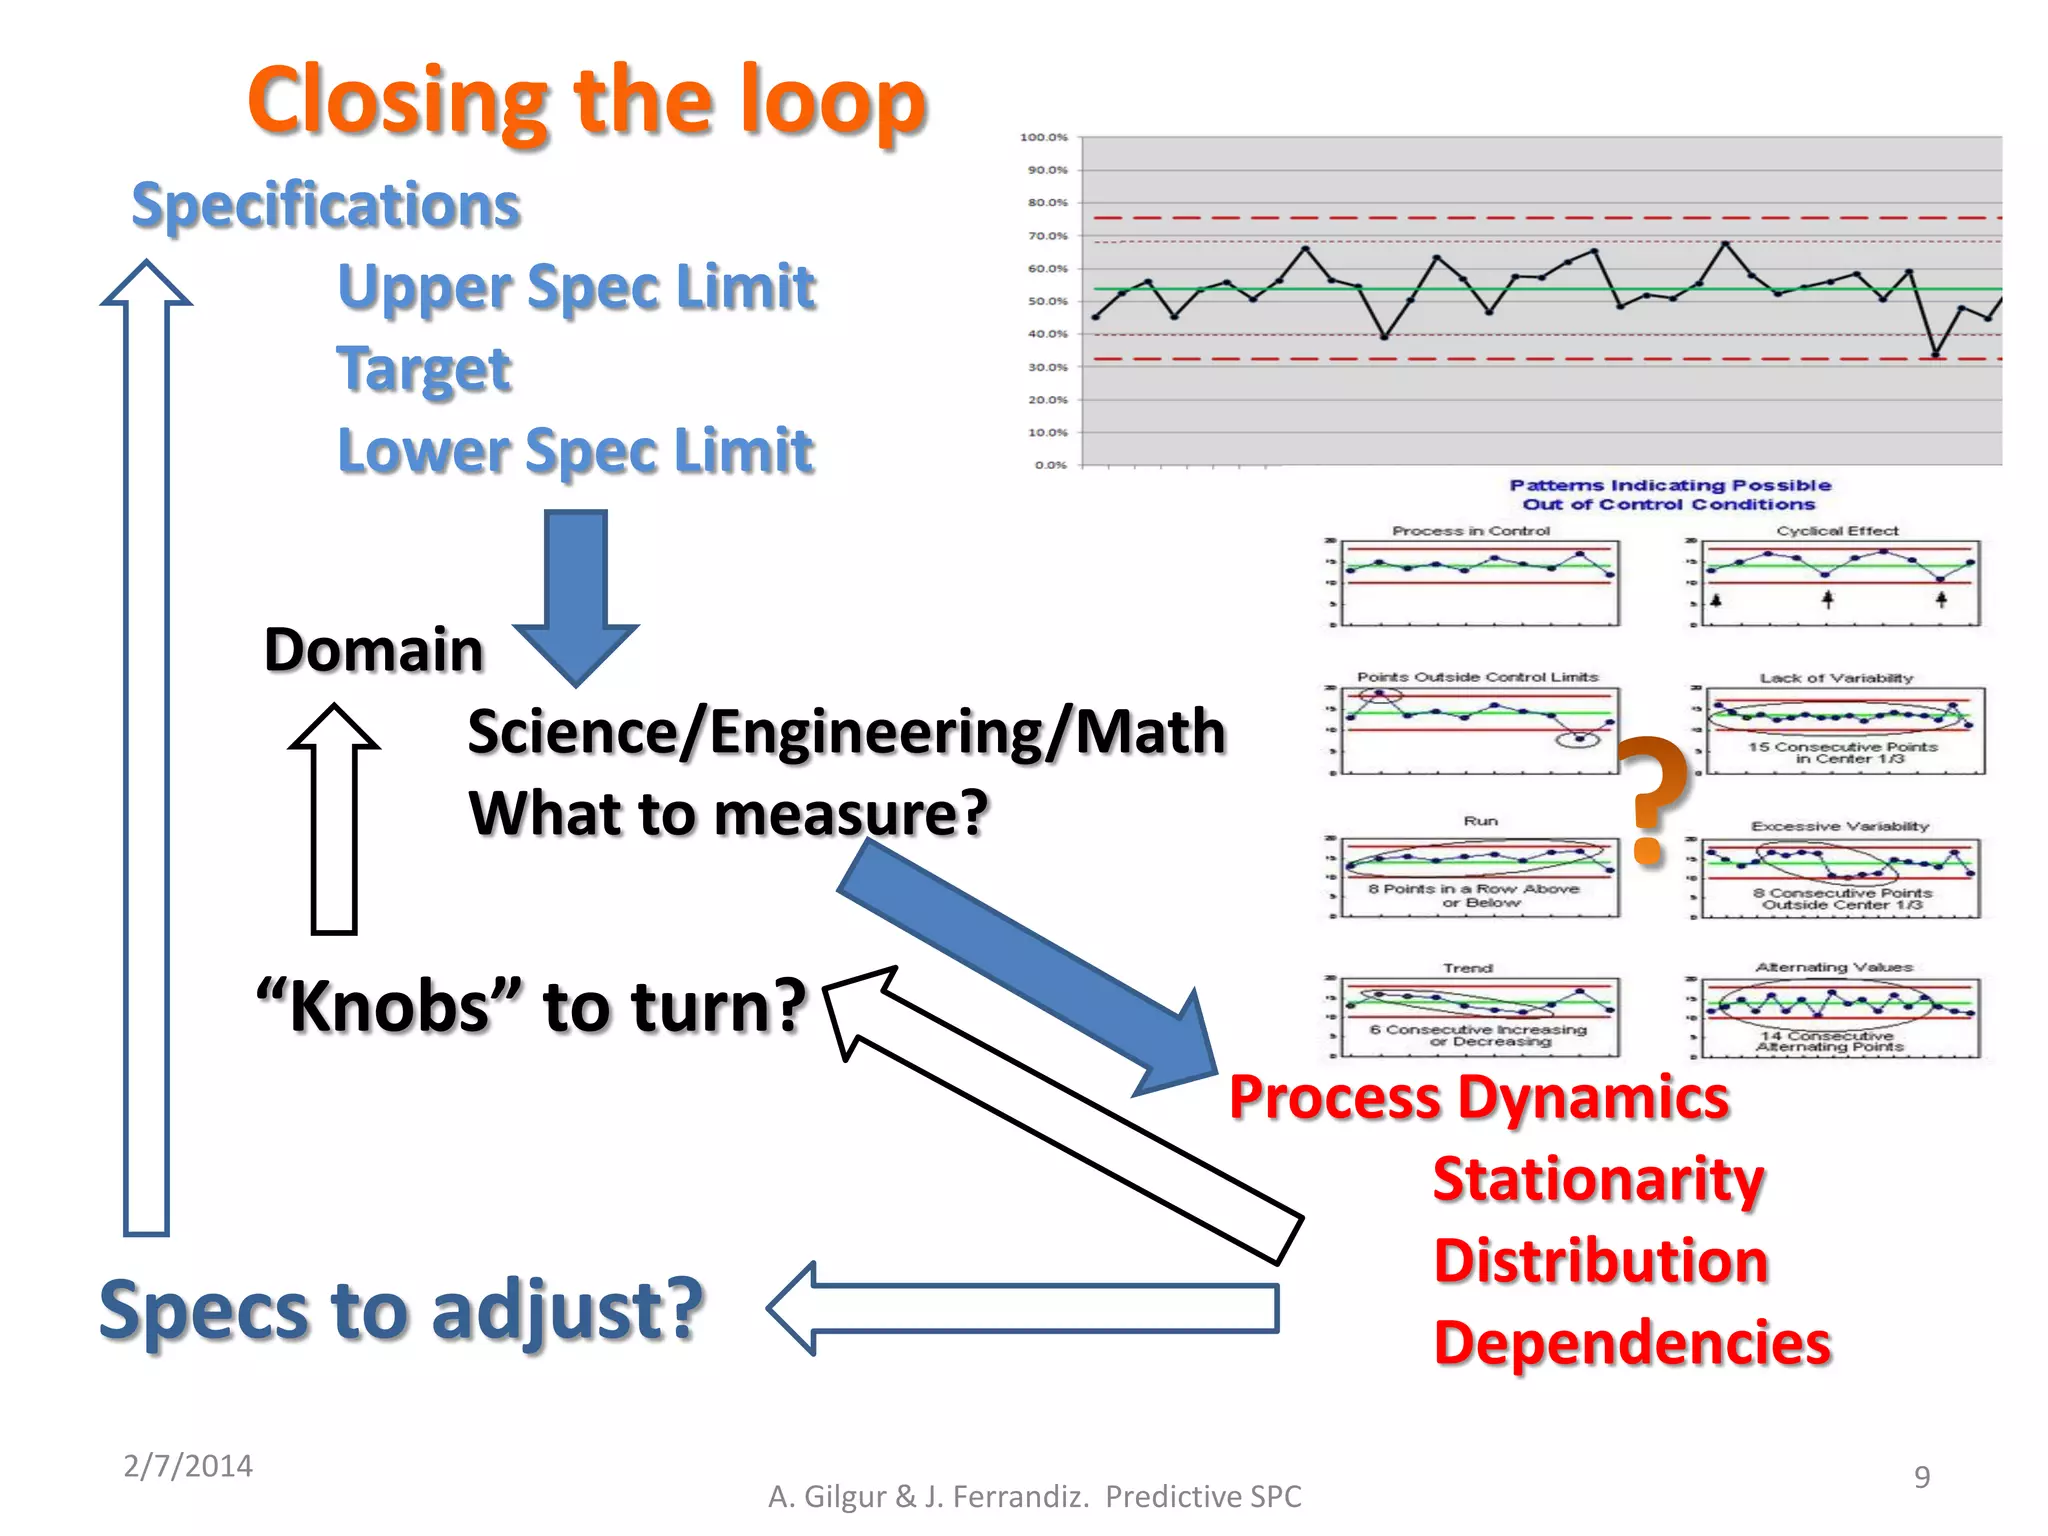
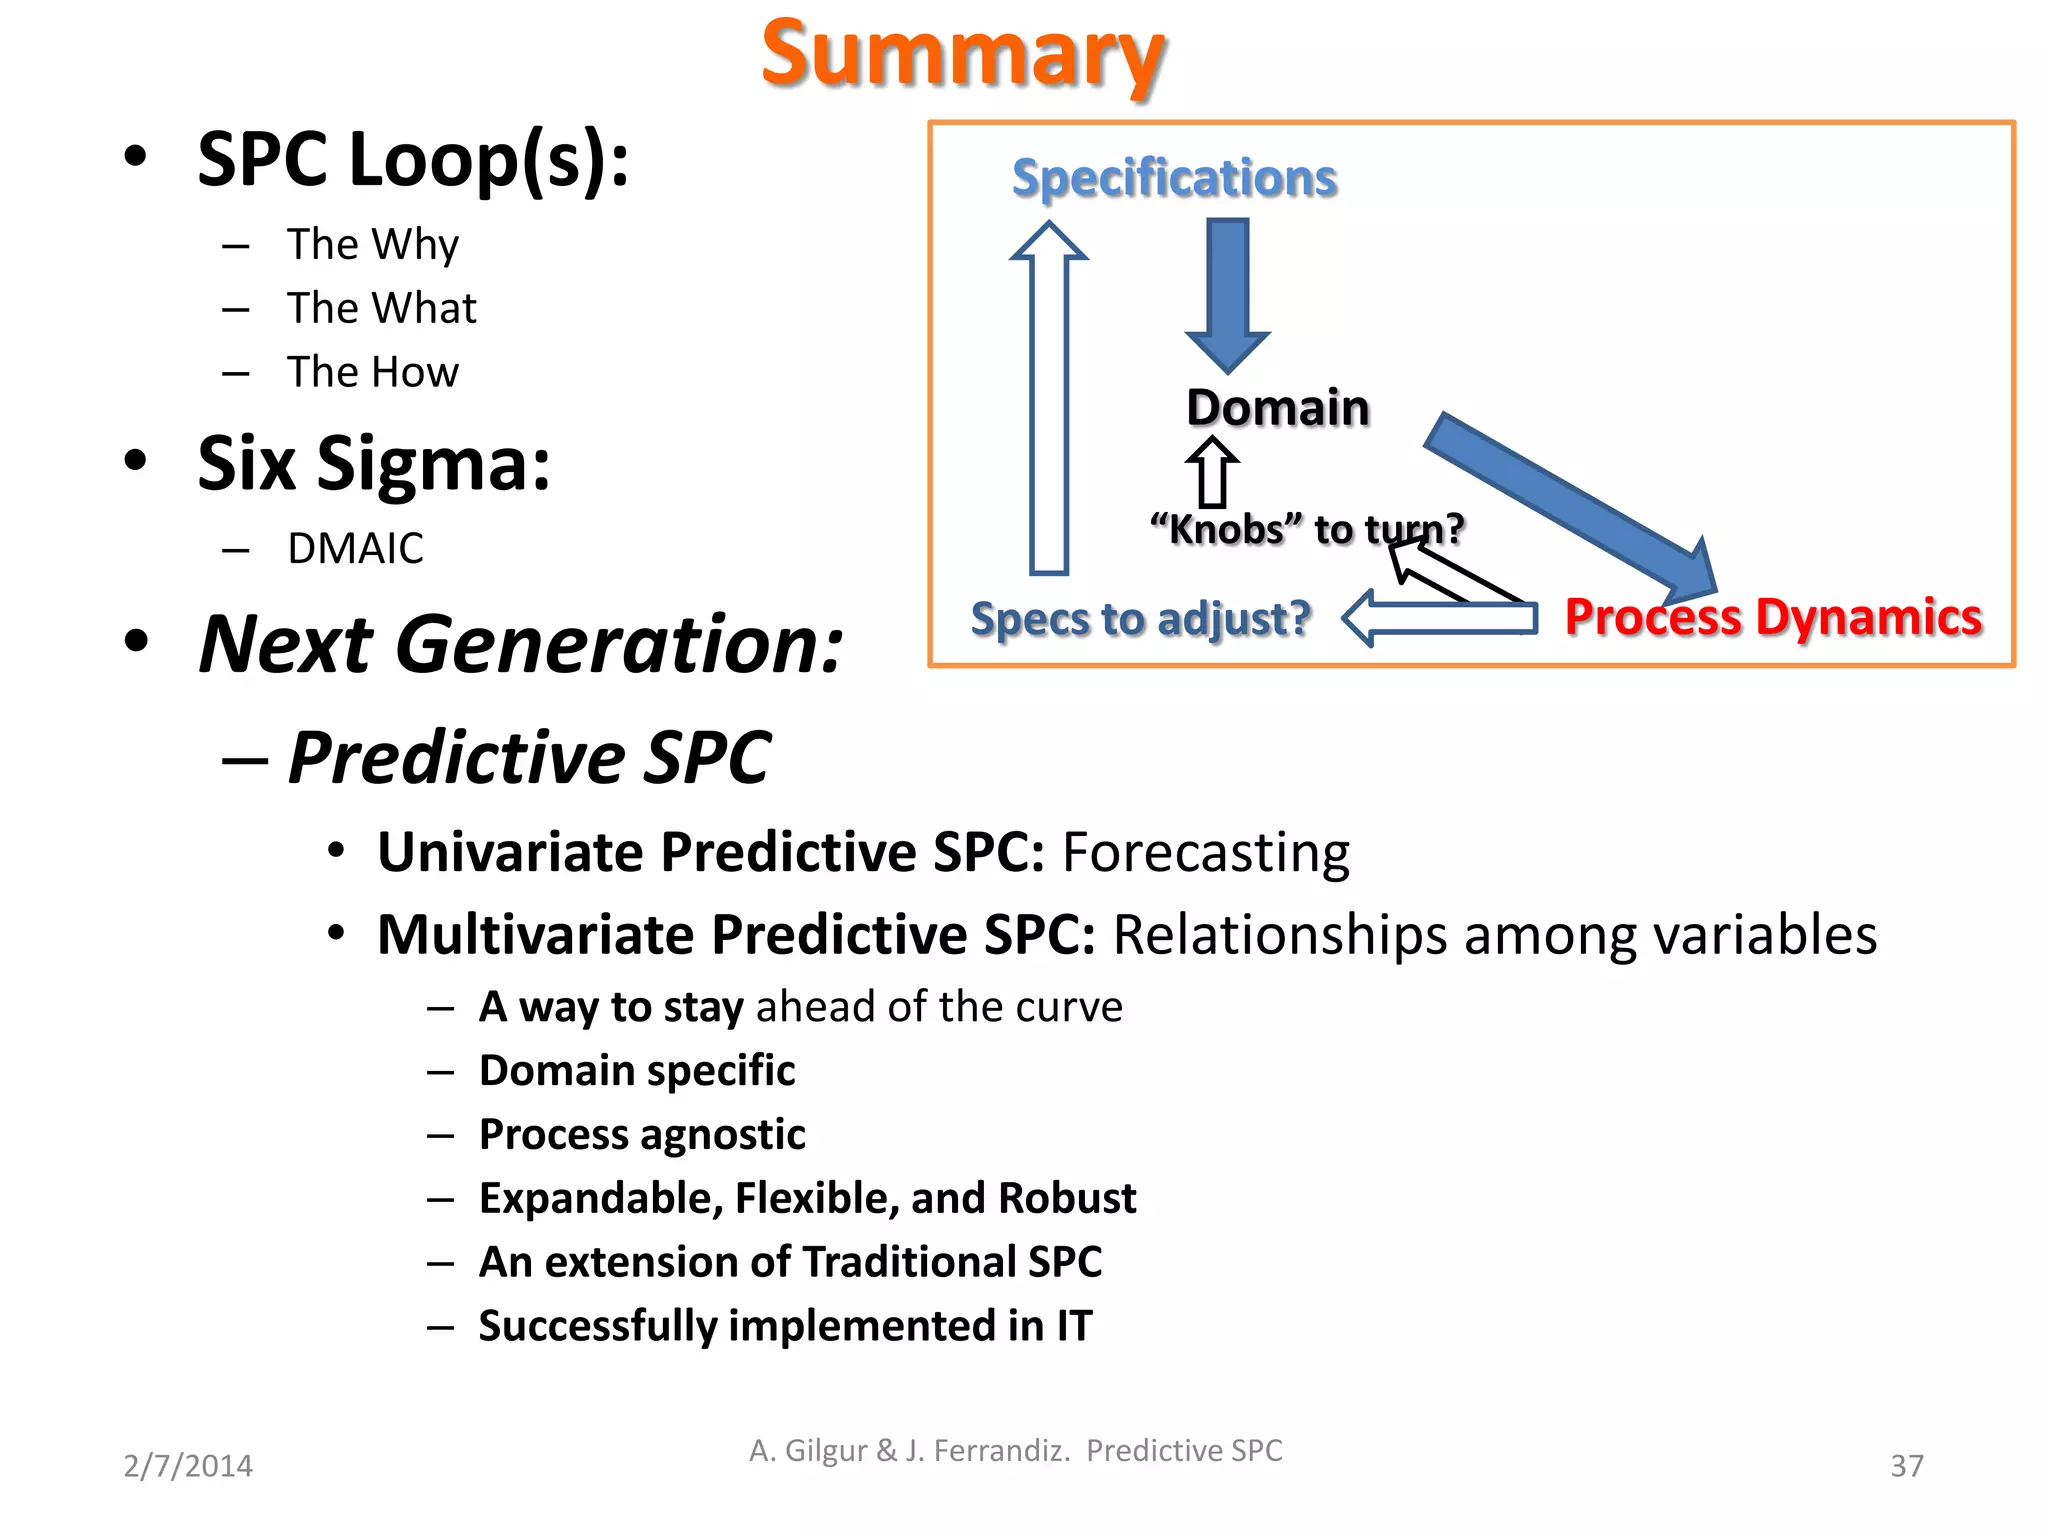
The document discusses predictive statistical process control (SPC) presented by Alex Gilgur and Josep Ferrandiz at the ASA conference. It covers the evolution of SPC from traditional methods to predictive SPC using univariate and multivariate analysis, emphasizing the roles of artificial intelligence, data mining, and machine learning in enhancing predictive capabilities. Key concepts such as specifications, process dynamics, and measures of process capability (like cp and cpk) are critically analyzed to illustrate the need for advanced SPC methods in various domains.


![[Mémoire] Le basket 3x3 en France](https://cdn.slidesharecdn.com/ss_thumbnails/ledveloppementdubasket3x3enfrance-150327121418-conversion-gate01-thumbnail.jpg?width=640&height=640&fit=bounds)


![[DSC Europe 25] Bassam Maharmeh - Artificial Intelligence: Opportunities and ...](https://cdn.slidesharecdn.com/ss_thumbnails/thhfmr2fqpawzj7hsjpg-5-251211083048-2c23204f-thumbnail.jpg?width=640&height=640&fit=bounds)


![[DSC Europe 25] Danica Soc - The Science Behind Marketing: Experimentation me...](https://cdn.slidesharecdn.com/ss_thumbnails/c0nofsggs9gw5ucmallr-3-251216103155-56bd64d1-thumbnail.jpg?width=640&height=640&fit=bounds)


![[DSC Europe 25] Ivan Peric - Intelligence Swarm Logic and Techno-Functional M...](https://cdn.slidesharecdn.com/ss_thumbnails/7my7c97fsduiccadgavw-2-251212103249-5a03f7c6-thumbnail.jpg?width=640&height=640&fit=bounds)

![[DSC Europe 25] Uros Pesic - The Reality of AI in Marketing.pdf](https://cdn.slidesharecdn.com/ss_thumbnails/rtkodnmtycovsllvzsyn-9-251215095918-b0c6bfe3-thumbnail.jpg?width=640&height=640&fit=bounds)


![[DSC Europe 25] Jon Dajci - Bridging TradFi and DeFi: Building the Future of ...](https://cdn.slidesharecdn.com/ss_thumbnails/fqmhfvlbqhkihjvqvhmu-7-251211083849-6af7e325-thumbnail.jpg?width=640&height=640&fit=bounds)


