Abstract Machine learning applications and pattern recognition have gained great attention recently because of the variety of applications
depend on machine learning techniques, these techniques could make many processes easier and also reduce the amount of
human interference (more automation). This paper research four of the most popular kernels used with Support Vector Machines
(SVM) for Classification purposes. This survey uses Linear, Polynomial, Gaussian and Sigmoid kernels, each in a single form and
all together as un-weighted sum of kernels as form of Multi-Kernel Learning (MKL), with eleven datasets, these data sets are
benchmark datasets with different types of features and different number of classes, so some will be used with Two-Classes
Classification (Binary Classification) and some with Multi-Class Classification. Shogun machine learning Toolbox is used with
Python programming language to perform the classification and also to handle the pre-classification operations like Feature
Scaling (Normalization).The Cross Validation technique is used to find the best performance Out of the suggested different
kernels' methods .To compare the final results two performance measuring techniques are used; classification accuracy and Area
Under Receiver Operating Characteristic (ROC). General basics of SVM and used Kernels with classification parameters are
given through the first part of the paper, then experimental details are explained in steps and after those steps, experimental
results from the steps are given with final histograms represent the differences of the outputs' accuracies and the areas under
ROC curves (AUC). Finally best methods obtained are applied on remote sensing data sets and the results are compared to a
state of art work published in the field using the same set of data.
Keywords: Machine Learning, Classification, SVM, MKL, Cross Validation and ROC
In stereo vision, the epipolar geometry is the intrinsic projective geometry between the two views. The
essential and fundamental matrices relate corresponding points in stereo images. The essential matrix
describes the geometry when the used cameras are calibrated, and the fundamental matrix expresses the
geometry when the cameras are uncalibrated. Since the nineties, researchers devoted a lot of effort to
estimate the fundamental matrix. Although it is a landmark of computer vision, in the current work, three
derivations of the essential and fundamental matrices have been revised. The Longuet-Higgins' derivation
of the essential matrix where he draws a mapping between the position vectors of a 3D point; however, the
one-to-one feature of that mapping is lost when he changed it to a relation between the image points. In the
two other derivations, we demonstrate that the authors established a mapping between the image points
through the misuse of mathematics.
Undetermined Mixing Matrix Estimation Base on Classification and CountingIJRESJOURNAL
ABSTRACT: This paper introduces the mixing matrix estimation algorithms about undetermined blind source separation. Contrapose the difficulty to determine the parameters, the complex calculations in potential function method and the difficulty to confirm the cluster centers in method of clustering, we propose a new method to estimate the mixing matrix base on classification and counting the observed data. The experiment result shows that the new algorithm can not only simplify the calculation but also is easier to be understood. Besides, the new algorithm can provide a more accurate result according to the precision people wanted.
The Positive Effects of Fuzzy C-Means Clustering on Supervised Learning Class...Waqas Tariq
Selection of inputs is one of the most substantial components of classification algorithms for data mining and pattern recognition problems since even the best classifier will perform badly if the inputs are not selected very well. Big data and computational complexity are main cause of bad performance and low accuracy for classical classifiers. In other words, the complexity of classifier method is inversely proportional with its classification efficiency. For this purpose, two hybrid classifiers have been developed by using both type-1 and type-2 fuzzy c-means clustering with cascaded a classifier. In this proposed classifier, a large number of data points are reduced by using fuzzy c-means clustering before applied to a classifier algorithm as inputs. The aim of this study is to investigate the effect of fuzzy clustering on well-known and useful classifiers such as artificial neural networks (ANN) and support vector machines (SVM). Then the role of positive effects of these proposed algorithms were investigated on applied different data sets.
This document summarizes dimensionality reduction techniques principal component analysis (PCA) and linear discriminant analysis (LDA). PCA seeks to reduce dimensionality while retaining as much variation in the data as possible. It finds the directions with the most variance by using the eigenvectors of the covariance matrix. LDA performs dimensionality reduction to best separate classes by maximizing between-class scatter while minimizing within-class scatter. It finds discriminatory directions by solving a generalized eigenvalue problem involving the between-class and within-class scatter matrices. Both techniques are useful for applications like face recognition by projecting high-dimensional images onto a lower-dimensional discriminative space.
Real-Time Stock Market Analysis using Spark StreamingSigmoid
This document proposes using support vector machines (SVMs) to model high-frequency limit order book dynamics and predict metrics like mid-price movement and price spread crossing. It describes representing each limit order book entry as a vector of attributes, then using multi-class SVMs to build models for each metric. Experiments on real data show the selected features are effective for short-term price forecasts. The document provides background on SVMs, describing how they find an optimal separating hyperplane to classify data points into labels.
Evaluation of 6 noded quareter point element for crack analysis by analytical...eSAT Publishing House
IJRET : International Journal of Research in Engineering and Technology is an international peer reviewed, online journal published by eSAT Publishing House for the enhancement of research in various disciplines of Engineering and Technology. The aim and scope of the journal is to provide an academic medium and an important reference for the advancement and dissemination of research results that support high-level learning, teaching and research in the fields of Engineering and Technology. We bring together Scientists, Academician, Field Engineers, Scholars and Students of related fields of Engineering and Technology
In this paper person identification is done based on sets of facial images. Each facial image is considered as the scattered point of logistic regression. The vertical distance of scattered point of facial image and the regression line is considered as the parameter to determine whether the image is of same person or not. The ratio of Euclidian distance (in terms of number of pixel of gray scale image based on ‘imtool’ of Matlab 13.0) between nasal and eye points are determined. The variance of the ration is considered another parameter to identify a facial image. The concept is combined with ghost image of Principal Component Analysis; where the mean square error and signal to noise ratio (SNR) in dB is considered as the parameters of detection. The combination of three methods, enhance the degree of accuracy compared to individual one.
Statistical Data Analysis on a Data Set (Diabetes 130-US hospitals for years ...Seval Çapraz
This document analyzes a dataset of diabetes records from 130 US hospitals from 1999-2008 using various statistical data analysis and machine learning techniques. It first performs dimensionality reduction using principal component analysis (PCA) and multidimensional scaling (MDS). It then clusters the data using hierarchical clustering and k-means clustering. Cluster validity is assessed using precision. Spectral clustering is also applied and validated using Dunn and Davies-Bouldin indexes, with complete linkage diameter performing best.
Histogram expansion a technique of histogram equlizationeSAT Journals
Abstract
In this paper I have described histogram expansion. Histogram expansion is a technique of histogram equalization. In this I have
described three different techniques of expansion namely dynamic range expansion, linear contrast expansion and symmetric range
expansion. Each of these has their specific uses and advantages. For colored images linear contrast expansion is used. These all
methods help in easy study of histograms and helps in image enhancement.
Index Terms: Histogram expansion, Dynamic range expansion, Linear contrast expansion, Symmetric range expansion
2-Dimensional and 3-Dimesional Electromagnetic Fields Using Finite element me...IOSR Journals
This document describes using the finite element method to model 2D and 3D electromagnetic fields. It discusses modeling a quarter section of a rectangular coaxial line with triangular elements. It describes constructing the matrices for each element and combining them to solve the overall matrix equation. The document outlines implementing FEM in MATLAB, including generating meshes, adding sources, and solving the resulting matrices. Several examples are presented of using a graphical user interface created in MATLAB to calculate fields from configurations like straight wires, bent wires, solenoids, and square loops using FEM techniques.
A Computationally Efficient Algorithm to Solve Generalized Method of Moments ...Waqas Tariq
Generalized method of moment estimating function enables one to estimate regression parameters consistently and efficiently. However, it involves one major computational problem: in complex data settings, solving generalized method of moments estimating function via Newton-Raphson technique gives rise often to non-invertible Jacobian matrices. Thus, parameter estimation becomes unreliable and computationally inefficient. To overcome this problem, we propose to use secant method based on vector divisions instead of the usual Newton-Raphson technique to estimate the regression parameters. This new method of estimation demonstrates a decrease in the number of non-convergence iterations as compared to the Newton-Raphson technique and provides reliable estimates.
IJRET : International Journal of Research in Engineering and Technology is an international peer reviewed, online journal published by eSAT Publishing House for the enhancement of research in various disciplines of Engineering and Technology. The aim and scope of the journal is to provide an academic medium and an important reference for the advancement and dissemination of research results that support high-level learning, teaching and research in the fields of Engineering and Technology. We bring together Scientists, Academician, Field Engineers, Scholars and Students of related fields of Engineering and Technology
MIXTURES OF TRAINED REGRESSION CURVESMODELS FOR HANDRITTEN ARABIC CHARACTER R...ijaia
In this paper, we demonstrate how regression curves can be used to recognize 2D non-rigid handwritten shapes. Each shape is represented by a set of non-overlapping uniformly distributed landmarks. The underlying models utilize 2nd order of polynomials to model shapes within a training set. To estimate the regression models, we need to extract the required coefficients which describe the variations for a set of shape class. Hence, a least square method is used to estimate such modes. We proceed then, by training these coefficients using the apparatus Expectation Maximization algorithm. Recognition is carried out by finding the least error landmarks displacement with respect to the model curves. Handwritten isolated Arabic characters are used to evaluate our approach.
FUZZY IMAGE SEGMENTATION USING VALIDITY INDEXES CORRELATIONijcsit
This paper introduces an algorithm for image segmentation using a clustering technique; the technique is
based on the fuzzy c means algorithm (FCM) that is executed iteratively with different number of clusters.
Furthermore, simultaneously five validity indexes are calculated and their information is correlated to
determine the optimal number of clusters in order to segment an image, results and simulations are shown
in the paper.
Assessing Error Bound For Dominant Point DetectionCSCJournals
This document compares the error bounds of two classes of dominant point detection methods: 1) methods based on reducing a distance metric like maximum deviation or integral square error, and 2) methods based on digital straight segments. For distance-based methods, the error bound is determined by the maximum deviation of pixels from the line segments between dominant points. For digital straight segment methods, the error bound depends on control parameters that define blurred or approximate digital straight segments. The document analyzes specific methods in each class and plots the theoretical error bounds to facilitate understanding and parameter selection for dominant point detection methods.
A Correlative Information-Theoretic Measure for Image SimilarityFarah M. Altufaili
A hybrid measure is proposed for assessing the similarity among gray-scale images. The well-known Structural Similarity Index Measure (SSIM) has been designed using a statistical approach that fails under significant noise (low PSNR). The proposed measure, denoted by SjhCorr2, uses a combination of two parts: the first part is information - theoretic, while the second part is based on 2D correlation. The concept
of symmetric joint histogram is used in the information - heoretic part. The new measure shows the advantages of statistical approaches and information - theoretic approaches. The proposed similarity approach is robust under noise. The new measure outperforms the classical SSIM in detecting image similarity at low PSN.
ALGORITHMIC AND ARCHITECTURAL OPTIMIZATION OF A 3D RECONSTRUCTION MEDICAL IMA...IJCSEIT Journal
This document summarizes an optimization of a 3D reconstruction algorithm called Marching Cubes for hardware implementation on an FPGA. It describes:
1) The Marching Cubes algorithm which generates a triangular mesh from segmented medical images and its repetitive nature.
2) The AAA methodology and SynDEx-IC tool used to specify the algorithm graph and optimize for the FPGA architecture through factorization and defactorization.
3) The optimized implementation generated by SynDEx-IC including a data path with calculation operators and memory, and a control path to coordinate factorization frontiers.
Predicting Moscow Real Estate Prices with Azure Machine LearningLeo Salemann
With only three months' instruction, a five-person team uses Azure Machine Learning Studio to predict Moscow real estate prices based on property descriptors, macroeconomic indicators, and geospatial data.
This document proposes a new model for segmenting overlapping, near-circular objects in images. It combines a multi-layer nonlocal phase field prior model that favors configurations of possibly overlapping near-circular shapes, with a new additive image likelihood model that accounts for intensities summing in overlapping regions. The full posterior energy is minimized using gradient descent to obtain a maximum a posteriori estimate of the object instances. The model is tested on synthetic and fluorescence microscopy cell nucleus image data.
A New Method Based on MDA to Enhance the Face Recognition PerformanceCSCJournals
A novel tensor based method is prepared to solve the supervised dimensionality reduction problem. In this paper a multilinear principal component analysis(MPCA) is utilized to reduce the tensor object dimension then a multilinear discriminant analysis(MDA), is applied to find the best subspaces. Because the number of possible subspace dimensions for any kind of tensor objects is extremely high, so testing all of them for finding the best one is not feasible. So this paper also presented a method to solve that problem, The main criterion of algorithm is not similar to Sequential mode truncation(SMT) and full projection is used to initialize the iterative solution and find the best dimension for MDA. This paper is saving the extra times that we should spend to find the best dimension. So the execution time will be decreasing so much. It should be noted that both of the algorithms work with tensor objects with the same order so the structure of the objects has been never broken. Therefore the performance of this method is getting better. The advantage of these algorithms is avoiding the curse of dimensionality and having a better performance in the cases with small sample sizes. Finally, some experiments on ORL and CMPU-PIE databases is provided.
A Density Control Based Adaptive Hexahedral Mesh Generation Algorithmijeei-iaes
This document summarizes an adaptive hexahedral mesh generation algorithm that uses density control. The algorithm involves 5 main steps: 1) Identifying the boundaries of the solid model, 2) Constructing refinement fields based on density metrics and generating an initial grid structure, 3) Generating a jagged core mesh by removing exterior elements, 4) Matching the core mesh surfaces to the solid model surfaces, 5) Improving mesh quality using optimization techniques. The algorithm aims to generate high quality hexahedral meshes with reasonably distributed density. It uses curvature and thickness criteria to refine the initial grid structure adaptively before generating the core mesh and performing surface matching and quality optimization.
IJRET : International Journal of Research in Engineering and Technology is an international peer reviewed, online journal published by eSAT Publishing House for the enhancement of research in various disciplines of Engineering and Technology. The aim and scope of the journal is to provide an academic medium and an important reference for the advancement and dissemination of research results that support high-level learning, teaching and research in the fields of Engineering and Technology. We bring together Scientists, Academician, Field Engineers, Scholars and Students of related fields of Engineering and Technology
Multi fractal analysis of human brain mr imageeSAT Journals
Abstract In computer programming, code smell may origin of latent problems in source code. Detecting and resolving bad smells remain time intense for software engineers despite proposals on bad smell detecting and refactoring tools. Numerous code smells have been recognized yet the sequence in which the detection and resolution of different kinds of code smells are performed because software engineers do not know how to optimize sequence. In this paper, the novel refactoring approach is proposed to improve the performance of programs. In this recommended approach the code smells are automatically detected and refactored. The simulation results propose the reduction of time over the semi-automated refactoring are achieved when code smells are refactored by using multi-step automated refactoring. Keywords: Code smell, multi step refactoring, detection, code resolution, restructuring etc
ZERNIKE MOMENT-BASED FEATURE EXTRACTION FOR FACIAL RECOGNITION OF IDENTICAL T...ijcseit
Face recognition is one of the most challenging problems in the domain of image processing and machine
vision. The face recognition system is critical when individuals have very similar biometric signature such
as identical twins. In this paper, new efficient facial-based identical twins recognition is proposed
according to geometric moment. The utilized geometric moment is Zernike Moment (ZM) as a feature
extractor inside the facial area of identical twins images. Also, the facial area in an image is detected using
AdaBoost approach. The proposed method is evaluated on two datasets, Twins Days Festival and Iranian
Twin Society which contain scaled and rotated facial images of identical twins in different illuminations.
The results prove the ability of proposed method to recognize a pair of identical twins. Also, results show
that the proposed method is robust to rotation, scaling and changing illumination.
Relevance Vector Machines for Earthquake Response Spectra drboon
This study uses Relevance Vector Machine (RVM) regression to develop a probabilistic model for the average horizontal component of 5%-damped earthquake response spectra. Unlike conventional models, the proposed approach does not require a functional form, and constructs the model based on a set predictive variables and a set of representative ground motion records. The RVM uses Bayesian inference to determine the confidence intervals, instead of estimating them from the mean squared errors on the training set. An example application using three predictive variables (magnitude, distance and fault mechanism) is presented for sites with shear wave velocities ranging from 450 m/s to 900 m/s. The predictions from the proposed model are compared to an existing parametric model. The results demonstrate the validity of the proposed model, and suggest that it can be used as an alternative to the conventional ground motion models. Future studies will investigate the effect of additional predictive variables on the predictive performance of the model.
The International Journal of Engineering and Science (The IJES)theijes
The International Journal of Engineering & Science is aimed at providing a platform for researchers, engineers, scientists, or educators to publish their original research results, to exchange new ideas, to disseminate information in innovative designs, engineering experiences and technological skills. It is also the Journal's objective to promote engineering and technology education. All papers submitted to the Journal will be blind peer-reviewed. Only original articles will be published.
A Fuzzy Interactive BI-objective Model for SVM to Identify the Best Compromis...ijfls
This document summarizes a research paper that proposes a fuzzy bi-objective support vector machine (SVM) model to identify infected COVID-19 patients. The model uses SVM classification with two objectives - maximizing margin between classes and minimizing misclassification errors. An α-cut transforms the fuzzy model into a classical bi-objective problem solved using weighting methods. This generates multiple efficient solutions. An interactive process then identifies the best compromise based on minimizing the number of support vectors in each class. The model constructs a utility function to measure COVID-19 infection levels based on the SVM classification.
A FUZZY INTERACTIVE BI-OBJECTIVE MODEL FOR SVM TO IDENTIFY THE BEST COMPROMIS...ijfls
A support vector machine (SVM) learns the decision surface from two different classes of the input points. In several applications, some of the input points are misclassified and each is not fully allocated to either of these two groups. In this paper a bi-objective quadratic programming model with fuzzy parameters is utilized and different feature quality measures are optimized simultaneously. An α-cut is defined to transform the fuzzy model to a family of classical bi-objective quadratic programming problems. The weighting method is used to optimize each of these problems. For the proposed fuzzy bi-objective quadratic programming model, a major contribution will be added by obtaining different effective support vectors due to changes in weighting values. The experimental results, show the effectiveness of the α-cut with the weighting parameters on reducing the misclassification between two classes of the input points. An interactive procedure will be added to identify the best compromise solution from the generated efficient solutions. The main contribution of this paper includes constructing a utility function for measuring the degree of infection with coronavirus disease (COVID-19).
Support Vector Machine Optimal Kernel SelectionIRJET Journal
This document discusses selecting the optimal kernel for support vector machines (SVMs) based on different datasets. It provides background on SVMs and how their performance depends on the kernel function used. The document evaluates 4 kernel types (linear, polynomial, radial basis function (RBF), sigmoid) on 3 datasets: heart disease data, digit recognition data, and social network ads data. For each dataset and kernel combination, it reports accuracy, sensitivity, specificity, and kappa statistic metrics from implementing SVMs in R. The linear and RBF kernels generally performed best, with RBF working best for datasets with larger numbers of features like digit recognition data.
A BI-OBJECTIVE MODEL FOR SVM WITH AN INTERACTIVE PROCEDURE TO IDENTIFY THE BE...gerogepatton
A support vector machine (SVM) learns the decision surface from two different classes of the input points, there are misclassifications in some of the input points in several applications. In this paper a bi-objective quadratic programming model is utilized and different feature quality measures are optimized simultaneously using the weighting method for solving our bi-objective quadratic programming problem. An important contribution will be added for the proposed bi-objective quadratic programming model by getting different efficient support vectors due to changing the weighting values. The numerical examples, give evidence of the effectiveness of the weighting parameters on reducing the misclassification between two classes of the input points. An interactive procedure will be added to identify the best compromise solution from the generated efficient solutions.
A BI-OBJECTIVE MODEL FOR SVM WITH AN INTERACTIVE PROCEDURE TO IDENTIFY THE BE...ijaia
A support vector machine (SVM) learns the decision surface from two different classes of the input points, there are misclassifications in some of the input points in several applications. In this paper a bi-objective quadratic programming model is utilized and different feature quality measures are optimized simultaneously using the weighting method for solving our bi-objective quadratic programming problem. An important contribution will be added for the proposed bi-objective quadratic programming model by getting different efficient support vectors due to changing the weighting values. The numerical examples, give evidence of the effectiveness of the weighting parameters on reducing the misclassification between two classes of the input points. An interactive procedure will be added to identify the best compromise solution from the generated efficient solutions.
AMAZON STOCK PRICE PREDICTION BY USING SMLTIRJET Journal
This document discusses predicting stock prices of Amazon (AMZN) stock using machine learning algorithms. It evaluates KNN, SVR, elastic net, and linear regression algorithms and finds that linear regression has the highest accuracy based on precision, recall, and F1 score metrics. The document provides details on each algorithm and compares their performance on this stock price prediction task. Linear regression builds a linear model to predict the dependent variable (stock price) based on independent variables and is shown to outperform the other supervised learning algorithms for this specific prediction problem.
IJRET : International Journal of Research in Engineering and Technology is an international peer reviewed, online journal published by eSAT Publishing House for the enhancement of research in various disciplines of Engineering and Technology. The aim and scope of the journal is to provide an academic medium and an important reference for the advancement and dissemination of research results that support high-level learning, teaching and research in the fields of Engineering and Technology. We bring together Scientists, Academician, Field Engineers, Scholars and Students of related fields of Engineering and Technology
A comparative study of three validities computation methods for multimodel ap...IJECEIAES
The multimodel approach offers a very satisfactory results in modelling, diagnose and control of complex systems. In the modelling case, this approach passes by three steps: the determination of the model’s library, the validities computation and the establishment of the final model. In this context, this paper focuses on the elaboration of a comparative study between three recent methods of validities computation. Thus, it highlight the method that offers the best performances in term of precision. To achieve this goal, we apply, these three methods on two simulation examples in order to compare their performances.
Machine Learning Algorithms for Image Classification of Hand Digits and Face ...IRJET Journal
This document discusses machine learning algorithms for image classification using five different classification schemes. It summarizes the mathematical models behind each classification algorithm, including Nearest Class Centroid classifier, Nearest Sub-Class Centroid classifier, k-Nearest Neighbor classifier, Perceptron trained using Backpropagation, and Perceptron trained using Mean Squared Error. It also describes two datasets used in the experiments - the MNIST dataset of handwritten digits and the ORL face recognition dataset. The performance of the five classification schemes are compared on these datasets.
Generalization of linear and non-linear support vector machine in multiple fi...CSITiaesprime
Support vector machines (SVMs) are a set of related supervised learning methods used for classification and regression. They belong to a family of generalized linear classifiers. In other terms, SVM is a classification and regression prediction tool that uses machine learning theory to maximize predictive accuracy. In this article, the discussion about linear and non-linear SVM classifiers with their functions and parameters is investigated. Due to the equality type of constraints in the formulation, the solution follows from solving a set of linear equations. Besides this, if the under-consideration problem is in the form of a non-linear case, then the problem must convert into linear separable form with the help of kernel trick and solve it according to the methods. Some important algorithms related to sentimental work are also presented in this paper. Generalization of the formulation of linear and non-linear SVMs is also open in this article. In the final section of this paper, the different modified sections of SVM are discussed which are modified by different research for different purposes.
Recognition of Handwritten Mathematical EquationsIRJET Journal
This document discusses a system to recognize handwritten mathematical equations. It aims to analyze handwritten equation images and output the corresponding characters in LaTeX format. This would allow users to easily convert handwritten equations into an editable digital format. The system uses machine learning algorithms including K-nearest neighbors and support vector machines applied to character geometry features extracted from the images. It outlines the process of preprocessing images, extracting line segment features from the character skeleton, and classifying characters using the two algorithms to recognize handwritten mathematical equations.
MARGINAL PERCEPTRON FOR NON-LINEAR AND MULTI CLASS CLASSIFICATION ijscai
Generalization error of classifier can be reduced by larger margin of separating hyperplane. The proposed classification algorithm implements margin in classical perceptron algorithm, to reduce generalized errors by maximizing margin of separating hyperplane. Algorithm uses the same updation rule with the perceptron, to converge in a finite number of updates to solutions, possessing any desirable fraction of the margin. This solution is again optimized to get maximum possible margin. The algorithm can process linear, non-linear and multi class problems. Experimental results place the proposed classifier equivalent to the support vector machine and even better in some cases. Some preliminary experimental results are briefly discussed.
IJRET : International Journal of Research in Engineering and Technology is an international peer reviewed, online journal published by eSAT Publishing House for the enhancement of research in various disciplines of Engineering and Technology. The aim and scope of the journal is to provide an academic medium and an important reference for the advancement and dissemination of research results that support high-level learning, teaching and research in the fields of Engineering and Technology. We bring together Scientists, Academician, Field Engineers, Scholars and Students of related fields of Engineering and Technology
FIDUCIAL POINTS DETECTION USING SVM LINEAR CLASSIFIERScsandit
Currently, there is a growing interest from the scientific and/or industrial community in respect
to methods that offer solutions to the problem of fiducial points detection in human faces. Some
methods use the SVM for classification, but we observed that some formulations of optimization
problems were not discussed. In this article, we propose to investigate the performance of
mathematical formulation C-SVC when applied in fiducial point detection system. Futhermore,
we explore new parameters for training the proposed system. The performance of the proposed
system is evaluated in a fiducial points detection problem. The results demonstrate that the
method is competitive.
Fault diagnosis using genetic algorithms and principal curveseSAT Journals
Abstract Several applications of nonlinear principal component analysis (NPCA) have appeared recently in process monitoring and fault diagnosis. In this paper a new approach is proposed for fault detection based on principal curves and genetic algorithms. The principal curve is a generation of linear principal component (PCA) introduced by Hastie as a parametric curve passes satisfactorily through the middle of data. The existing principal curves algorithms employ the first component of the data as an initial estimation of principal curve. However the dependence on initial line leads to a lack of flexibility and the final curve is only satisfactory for specific problems. In this paper we extend this work in two ways. First, we propose a new method based on genetic algorithms to find the principal curve. Here, lines are fitted and connected to form polygonal lines (PL). Second, potential application of principal curves is discussed. An example is used to illustrate fault diagnosis of nonlinear process using the proposed approach. Index Terms: Principal curve, Genetic Algorithm, Nonlinear principal component analysis, Fault detection.
Support vector machines (SVMs) are a supervised machine learning algorithm used for classification and regression analysis. SVMs find the optimal boundary, known as a hyperplane, that separates classes of data. This hyperplane maximizes the margin between the two classes. Extensions to the basic SVM model include soft margin classification to allow some misclassified points, methods for multi-class classification like one-vs-one and one-vs-all, and the use of kernel functions to handle non-linear decision boundaries. Real-world applications of SVMs include face detection, text categorization, image classification, and bioinformatics.
The document discusses linear and non-linear support vector machine (SVM) algorithms. SVM finds the optimal hyperplane that separates classes with the maximum margin. For linear data, the hyperplane is a straight line, while for non-linear data it is a higher dimensional surface. The data points closest to the hyperplane that determine its position are called support vectors. Non-linear SVM handles non-linear separable data by projecting it into a higher dimension where it may become linearly separable.
- Support Vector Machine (SVM) is a supervised machine learning algorithm used for both classification and regression problems, but primarily for classification.
- The goal of SVM is to find the optimal separating hyperplane that maximizes the margin between two classes of data points.
- Support vectors are the data points that are closest to the hyperplane and influence its position. SVM aims to position the hyperplane to best separate the support vectors of different classes.
Evaluation the affects of mimo based rayleigh network cascaded with unstable ...eSAT Publishing House
IJRET : International Journal of Research in Engineering and Technology is an international peer reviewed, online journal published by eSAT Publishing House for the enhancement of research in various disciplines of Engineering and Technology. The aim and scope of the journal is to provide an academic medium and an important reference for the advancement and dissemination of research results that support high-level learning, teaching and research in the fields of Engineering and Technology. We bring together Scientists, Academician, Field Engineers, Scholars and Students of related fields of Engineering and Technology
Similar to Single to multiple kernel learning with four popular svm kernels (survey) (20)
Mechanical properties of hybrid fiber reinforced concrete for pavementseSAT Journals
Abstract
The effect of addition of mono fibers and hybrid fibers on the mechanical properties of concrete mixture is studied in the present
investigation. Steel fibers of 1% and polypropylene fibers 0.036% were added individually to the concrete mixture as mono fibers and
then they were added together to form a hybrid fiber reinforced concrete. Mechanical properties such as compressive, split tensile and
flexural strength were determined. The results show that hybrid fibers improve the compressive strength marginally as compared to
mono fibers. Whereas, hybridization improves split tensile strength and flexural strength noticeably.
Keywords:-Hybridization, mono fibers, steel fiber, polypropylene fiber, Improvement in mechanical properties.
Material management in construction – a case studyeSAT Journals
Abstract
The objective of the present study is to understand about all the problems occurring in the company because of improper application
of material management. In construction project operation, often there is a project cost variance in terms of the material, equipments,
manpower, subcontractor, overhead cost, and general condition. Material is the main component in construction projects. Therefore,
if the material management is not properly managed it will create a project cost variance. Project cost can be controlled by taking
corrective actions towards the cost variance. Therefore a methodology is used to diagnose and evaluate the procurement process
involved in material management and launch a continuous improvement was developed and applied. A thorough study was carried
out along with study of cases, surveys and interviews to professionals involved in this area. As a result, a methodology for diagnosis
and improvement was proposed and tested in selected projects. The results obtained show that the main problem of procurement is
related to schedule delays and lack of specified quality for the project. To prevent this situation it is often necessary to dedicate
important resources like money, personnel, time, etc. To monitor and control the process. A great potential for improvement was
detected if state of the art technologies such as, electronic mail, electronic data interchange (EDI), and analysis were applied to the
procurement process. These helped to eliminate the root causes for many types of problems that were detected.
Managing drought short term strategies in semi arid regions a case studyeSAT Journals
Abstract
Drought management needs multidisciplinary action. Interdisciplinary efforts among the experts in various fields of the droughts
prone areas are helpful to achieve tangible and permanent solution for this recurring problem. The Gulbarga district having the total
area around 16, 240 sq.km, and accounts 8.45 per cent of the Karnataka state area. The district has been situated with latitude 17º 19'
60" North and longitude of 76 º 49' 60" east. The district is situated entirely on the Deccan plateau positioned at a height of 300 to
750 m above MSL. Sub-tropical, semi-arid type is one among the drought prone districts of Karnataka State. The drought
management is very important for a district like Gulbarga. In this paper various short term strategies are discussed to mitigate the
drought condition in the district.
Keywords: Drought, South-West monsoon, Semi-Arid, Rainfall, Strategies etc.
Life cycle cost analysis of overlay for an urban road in bangaloreeSAT Journals
Abstract
Pavements are subjected to severe condition of stresses and weathering effects from the day they are constructed and opened to traffic
mainly due to its fatigue behavior and environmental effects. Therefore, pavement rehabilitation is one of the most important
components of entire road systems. This paper highlights the design of concrete pavement with added mono fibers like polypropylene,
steel and hybrid fibres for a widened portion of existing concrete pavement and various overlay alternatives for an existing
bituminous pavement in an urban road in Bangalore. Along with this, Life cycle cost analyses at these sections are done by Net
Present Value (NPV) method to identify the most feasible option. The results show that though the initial cost of construction of
concrete overlay is high, over a period of time it prove to be better than the bituminous overlay considering the whole life cycle cost.
The economic analysis also indicates that, out of the three fibre options, hybrid reinforced concrete would be economical without
compromising the performance of the pavement.
Keywords: - Fatigue, Life cycle cost analysis, Net Present Value method, Overlay, Rehabilitation
Laboratory studies of dense bituminous mixes ii with reclaimed asphalt materialseSAT Journals
Abstract
The issue of growing demand on our nation’s roadways over that past couple of decades, decreasing budgetary funds, and the need to
provide a safe, efficient, and cost effective roadway system has led to a dramatic increase in the need to rehabilitate our existing
pavements and the issue of building sustainable road infrastructure in India. With these emergency of the mentioned needs and this
are today’s burning issue and has become the purpose of the study.
In the present study, the samples of existing bituminous layer materials were collected from NH-48(Devahalli to Hassan) site.The
mixtures were designed by Marshall Method as per Asphalt institute (MS-II) at 20% and 30% Reclaimed Asphalt Pavement (RAP).
RAP material was blended with virgin aggregate such that all specimens tested for the, Dense Bituminous Macadam-II (DBM-II)
gradation as per Ministry of Roads, Transport, and Highways (MoRT&H) and cost analysis were carried out to know the economics.
Laboratory results and analysis showed the use of recycled materials showed significant variability in Marshall Stability, and the
variability increased with the increase in RAP content. The saving can be realized from utilization of recycled materials as per the
methodology, the reduction in the total cost is 19%, 30%, comparing with the virgin mixes.
Keywords: Reclaimed Asphalt Pavement, Marshall Stability, MS-II, Dense Bituminous Macadam-II
Laboratory investigation of expansive soil stabilized with natural inorganic ...eSAT Journals
This document summarizes a study on stabilizing expansive black cotton soil with the natural inorganic stabilizer RBI-81. Laboratory tests were conducted to evaluate the effect of RBI-81 on the soil's engineering properties. The tests showed that with 2% RBI-81 and 28 days of curing, the unconfined compressive strength increased by around 250% and the CBR value improved by approximately 400% compared to the untreated soil. Overall, the study found that RBI-81 effectively improved the strength properties of the black cotton soil and its suitability as a soil stabilizer was supported.
Influence of reinforcement on the behavior of hollow concrete block masonry p...eSAT Journals
Abstract
Reinforced masonry was developed to exploit the strength potential of masonry and to solve its lack of tensile strength. Experimental
and analytical studies have been carried out to investigate the effect of reinforcement on the behavior of hollow concrete block
masonry prisms under compression and to predict ultimate failure compressive strength. In the numerical program, three dimensional
non-linear finite elements (FE) model based on the micro-modeling approach is developed for both unreinforced and reinforced
masonry prisms using ANSYS (14.5). The proposed FE model uses multi-linear stress-strain relationships to model the non-linear
behavior of hollow concrete block, mortar, and grout. Willam-Warnke’s five parameter failure theory has been adopted to model the
failure of masonry materials. The comparison of the numerical and experimental results indicates that the FE models can successfully
capture the highly nonlinear behavior of the physical specimens and accurately predict their strength and failure mechanisms.
Keywords: Structural masonry, Hollow concrete block prism, grout, Compression failure, Finite element method,
Numerical modeling.
Influence of compaction energy on soil stabilized with chemical stabilizereSAT Journals
This document summarizes a study on the influence of compaction energy on soil stabilized with a chemical stabilizer. Laboratory tests were conducted on locally available loamy soil treated with a patented polymer liquid stabilizer and compacted at four different energy levels. The study found that increasing the compaction effort increased the density of both untreated and treated soil, but the rate of increase was lower for stabilized soil. Treating the soil with the stabilizer improved its unconfined compressive strength and resilient modulus, and reduced accumulated plastic strain, with these properties further improved by higher compaction efforts. The stabilized soil exhibited strength and performance benefits compared to the untreated soil.
Geographical information system (gis) for water resources managementeSAT Journals
This document describes a hydrological framework developed in the form of a Hydrologic Information System (HIS) to meet the information needs of various government departments related to water management in a state. The HIS consists of a hydrological database coupled with tools for collecting and analyzing spatial and non-spatial water resources data. It also incorporates a hydrological model to indirectly assess water balance components over space and time. A web-based GIS portal was created to allow users to access and visualize the hydrological data, as well as outputs from the SWAT hydrological model. The framework is intended to facilitate integrated water resources planning and management across different administrative levels.
Forest type mapping of bidar forest division, karnataka using geoinformatics ...eSAT Journals
Abstract
The study demonstrate the potentiality of satellite remote sensing technique for the generation of baseline information on forest types
including tree plantation details in Bidar forest division, Karnataka covering an area of 5814.60Sq.Kms. The Total Area of Bidar
forest division is 5814Sq.Kms analysis of the satellite data in the study area reveals that about 84% of the total area is Covered by
crop land, 1.778% of the area is covered by dry deciduous forest, 1.38 % of mixed plantation, which is very threatening to the
environmental stability of the forest, future plantation site has been mapped. With the use of latest Geo-informatics technology proper
and exact condition of the trees can be observed and necessary precautions can be taken for future plantation works in an appropriate
manner
Keywords:-RS, GIS, GPS, Forest Type, Tree Plantation
Factors influencing compressive strength of geopolymer concreteeSAT Journals
Abstract
To study effects of several factors on the properties of fly ash based geopolymer concrete on the compressive strength and also the
cost comparison with the normal concrete. The test variables were molarities of sodium hydroxide(NaOH) 8M,14M and 16M, ratio of
NaOH to sodium silicate (Na2SiO3) 1, 1.5, 2 and 2.5, alkaline liquid to fly ash ratio 0.35 and 0.40 and replacement of water in
Na2SiO3 solution by 10%, 20% and 30% were used in the present study. The test results indicated that the highest compressive
strength 54 MPa was observed for 16M of NaOH, ratio of NaOH to Na2SiO3 2.5 and alkaline liquid to fly ash ratio of 0.35. Lowest
compressive strength of 27 MPa was observed for 8M of NaOH, ratio of NaOH to Na2SiO3 is 1 and alkaline liquid to fly ash ratio of
0.40. Alkaline liquid to fly ash ratio of 0.35, water replacement of 10% and 30% for 8 and 16 molarity of NaOH and has resulted in
compressive strength of 36 MPa and 20 MPa respectively. Superplasticiser dosage of 2 % by weight of fly ash has given higher
strength in all cases.
Keywords: compressive strength, alkaline liquid, fly ash
Experimental investigation on circular hollow steel columns in filled with li...eSAT Journals
Abstract
Composite Circular hollow Steel tubes with and without GFRP infill for three different grades of Light weight concrete are tested for
ultimate load capacity and axial shortening , under Cyclic loading. Steel tubes are compared for different lengths, cross sections and
thickness. Specimens were tested separately after adopting Taguchi’s L9 (Latin Squares) Orthogonal array in order to save the initial
experimental cost on number of specimens and experimental duration. Analysis was carried out using ANN (Artificial Neural
Network) technique with the assistance of Mini Tab- a statistical soft tool. Comparison for predicted, experimental & ANN output is
obtained from linear regression plots. From this research study, it can be concluded that *Cross sectional area of steel tube has most
significant effect on ultimate load carrying capacity, *as length of steel tube increased- load carrying capacity decreased & *ANN
modeling predicted acceptable results. Thus ANN tool can be utilized for predicting ultimate load carrying capacity for composite
columns.
Keywords: Light weight concrete, GFRP, Artificial Neural Network, Linear Regression, Back propagation, orthogonal
Array, Latin Squares
Experimental behavior of circular hsscfrc filled steel tubular columns under ...eSAT Journals
This document summarizes an experimental study that tested circular concrete-filled steel tube columns with varying parameters. 45 specimens were tested with different fiber percentages (0-2%), tube diameter-to-wall-thickness ratios (D/t from 15-25), and length-to-diameter (L/d) ratios (from 2.97-7.04). The results found that columns filled with fiber-reinforced concrete exhibited higher stiffness, equal ductility, and enhanced energy absorption compared to those filled with plain concrete. The load carrying capacity increased with fiber content up to 1.5% but not at 2.0%. The analytical predictions of failure load closely matched the experimental values.
Evaluation of punching shear in flat slabseSAT Journals
Abstract
Flat-slab construction has been widely used in construction today because of many advantages that it offers. The basic philosophy in
the design of flat slab is to consider only gravity forces; this method ignores the effect of punching shear due to unbalanced moments
at the slab column junction which is critical. An attempt has been made to generate generalized design sheets which accounts both
punching shear due to gravity loads and unbalanced moments for cases (a) interior column; (b) edge column (bending perpendicular
to shorter edge); (c) edge column (bending parallel to shorter edge); (d) corner column. These design sheets are prepared as per
codal provisions of IS 456-2000. These design sheets will be helpful in calculating the shear reinforcement to be provided at the
critical section which is ignored in many design offices. Apart from its usefulness in evaluating punching shear and the necessary
shear reinforcement, the design sheets developed will enable the designer to fix the depth of flat slab during the initial phase of the
design.
Keywords: Flat slabs, punching shear, unbalanced moment.
Evaluation of performance of intake tower dam for recent earthquake in indiaeSAT Journals
Abstract
Intake towers are typically tall, hollow, reinforced concrete structures and form entrance to reservoir outlet works. A parametric
study on dynamic behavior of circular cylindrical towers can be carried out to study the effect of depth of submergence, wall thickness
and slenderness ratio, and also effect on tower considering dynamic analysis for time history function of different soil condition and
by Goyal and Chopra accounting interaction effects of added hydrodynamic mass of surrounding and inside water in intake tower of
dam
Key words: Hydrodynamic mass, Depth of submergence, Reservoir, Time history analysis,
Evaluation of operational efficiency of urban road network using travel time ...eSAT Journals
This document evaluates the operational efficiency of an urban road network in Tiruchirappalli, India using travel time reliability measures. Traffic volume and travel times were collected using video data from 8-10 AM on various roads. Average travel times, 95th percentile travel times, and buffer time indexes were calculated to assess reliability. Non-motorized vehicles were found to most impact reliability on one road. A relationship between buffer time index and traffic volume was developed. Finally, a travel time model was created and validated based on length, speed, and volume.
Estimation of surface runoff in nallur amanikere watershed using scs cn methodeSAT Journals
Abstract
The development of watershed aims at productive utilization of all the available natural resources in the entire area extending from
ridge line to stream outlet. The per capita availability of land for cultivation has been decreasing over the years. Therefore, water and
the related land resources must be developed, utilized and managed in an integrated and comprehensive manner. Remote sensing and
GIS techniques are being increasingly used for planning, management and development of natural resources. The study area, Nallur
Amanikere watershed geographically lies between 110 38’ and 110 52’ N latitude and 760 30’ and 760 50’ E longitude with an area of
415.68 Sq. km. The thematic layers such as land use/land cover and soil maps were derived from remotely sensed data and overlayed
through ArcGIS software to assign the curve number on polygon wise. The daily rainfall data of six rain gauge stations in and around
the watershed (2001-2011) was used to estimate the daily runoff from the watershed using Soil Conservation Service - Curve Number
(SCS-CN) method. The runoff estimated from the SCS-CN model was then used to know the variation of runoff potential with different
land use/land cover and with different soil conditions.
Keywords: Watershed, Nallur watershed, Surface runoff, Rainfall-Runoff, SCS-CN, Remote Sensing, GIS.
Estimation of morphometric parameters and runoff using rs & gis techniqueseSAT Journals
This document summarizes a study that used remote sensing and GIS techniques to estimate morphometric parameters and runoff for the Yagachi catchment area in India over a 10-year period. Morphometric analysis was conducted to understand the hydrological response at the micro-watershed level. Daily runoff was estimated using the SCS curve number model. The results showed a positive correlation between rainfall and runoff. Land use/land cover changes between 2001-2010 were found to impact estimated runoff amounts. Remote sensing approaches provided an effective means to model runoff for this large, ungauged area.
Effect of variation of plastic hinge length on the results of non linear anal...eSAT Journals
Abstract The nonlinear Static procedure also well known as pushover analysis is method where in monotonically increasing loads are applied to the structure till the structure is unable to resist any further load. It is a popular tool for seismic performance evaluation of existing and new structures. In literature lot of research has been carried out on conventional pushover analysis and after knowing deficiency efforts have been made to improve it. But actual test results to verify the analytically obtained pushover results are rarely available. It has been found that some amount of variation is always expected to exist in seismic demand prediction of pushover analysis. Initial study is carried out by considering user defined hinge properties and default hinge length. Attempt is being made to assess the variation of pushover analysis results by considering user defined hinge properties and various hinge length formulations available in literature and results compared with experimentally obtained results based on test carried out on a G+2 storied RCC framed structure. For the present study two geometric models viz bare frame and rigid frame model is considered and it is found that the results of pushover analysis are very sensitive to geometric model and hinge length adopted. Keywords: Pushover analysis, Base shear, Displacement, hinge length, moment curvature analysis
Effect of use of recycled materials on indirect tensile strength of asphalt c...eSAT Journals
Abstract
Depletion of natural resources and aggregate quarries for the road construction is a serious problem to procure materials. Hence
recycling or reuse of material is beneficial. On emphasizing development in sustainable construction in the present era, recycling of
asphalt pavements is one of the effective and proven rehabilitation processes. For the laboratory investigations reclaimed asphalt
pavement (RAP) from NH-4 and crumb rubber modified binder (CRMB-55) was used. Foundry waste was used as a replacement to
conventional filler. Laboratory tests were conducted on asphalt concrete mixes with 30, 40, 50, and 60 percent replacement with RAP.
These test results were compared with conventional mixes and asphalt concrete mixes with complete binder extracted RAP
aggregates. Mix design was carried out by Marshall Method. The Marshall Tests indicated highest stability values for asphalt
concrete (AC) mixes with 60% RAP. The optimum binder content (OBC) decreased with increased in RAP in AC mixes. The Indirect
Tensile Strength (ITS) for AC mixes with RAP also was found to be higher when compared to conventional AC mixes at 300C.
Keywords: Reclaimed asphalt pavement, Foundry waste, Recycling, Marshall Stability, Indirect tensile strength.
Using recycled concrete aggregates (RCA) for pavements is crucial to achieving sustainability. Implementing RCA for new pavement can minimize carbon footprint, conserve natural resources, reduce harmful emissions, and lower life cycle costs. Compared to natural aggregate (NA), RCA pavement has fewer comprehensive studies and sustainability assessments.
Literature Review Basics and Understanding Reference Management.pptxDr Ramhari Poudyal
Three-day training on academic research focuses on analytical tools at United Technical College, supported by the University Grant Commission, Nepal. 24-26 May 2024
Harnessing WebAssembly for Real-time Stateless Streaming PipelinesChristina Lin
Traditionally, dealing with real-time data pipelines has involved significant overhead, even for straightforward tasks like data transformation or masking. However, in this talk, we’ll venture into the dynamic realm of WebAssembly (WASM) and discover how it can revolutionize the creation of stateless streaming pipelines within a Kafka (Redpanda) broker. These pipelines are adept at managing low-latency, high-data-volume scenarios.
Electric vehicle and photovoltaic advanced roles in enhancing the financial p...IJECEIAES
Climate change's impact on the planet forced the United Nations and governments to promote green energies and electric transportation. The deployments of photovoltaic (PV) and electric vehicle (EV) systems gained stronger momentum due to their numerous advantages over fossil fuel types. The advantages go beyond sustainability to reach financial support and stability. The work in this paper introduces the hybrid system between PV and EV to support industrial and commercial plants. This paper covers the theoretical framework of the proposed hybrid system including the required equation to complete the cost analysis when PV and EV are present. In addition, the proposed design diagram which sets the priorities and requirements of the system is presented. The proposed approach allows setup to advance their power stability, especially during power outages. The presented information supports researchers and plant owners to complete the necessary analysis while promoting the deployment of clean energy. The result of a case study that represents a dairy milk farmer supports the theoretical works and highlights its advanced benefits to existing plants. The short return on investment of the proposed approach supports the paper's novelty approach for the sustainable electrical system. In addition, the proposed system allows for an isolated power setup without the need for a transmission line which enhances the safety of the electrical network
International Conference on NLP, Artificial Intelligence, Machine Learning an...gerogepatton
International Conference on NLP, Artificial Intelligence, Machine Learning and Applications (NLAIM 2024) offers a premier global platform for exchanging insights and findings in the theory, methodology, and applications of NLP, Artificial Intelligence, Machine Learning, and their applications. The conference seeks substantial contributions across all key domains of NLP, Artificial Intelligence, Machine Learning, and their practical applications, aiming to foster both theoretical advancements and real-world implementations. With a focus on facilitating collaboration between researchers and practitioners from academia and industry, the conference serves as a nexus for sharing the latest developments in the field.
Batteries -Introduction – Types of Batteries – discharging and charging of battery - characteristics of battery –battery rating- various tests on battery- – Primary battery: silver button cell- Secondary battery :Ni-Cd battery-modern battery: lithium ion battery-maintenance of batteries-choices of batteries for electric vehicle applications.
Fuel Cells: Introduction- importance and classification of fuel cells - description, principle, components, applications of fuel cells: H2-O2 fuel cell, alkaline fuel cell, molten carbonate fuel cell and direct methanol fuel cells.
ACEP Magazine edition 4th launched on 05.06.2024Rahul
This document provides information about the third edition of the magazine "Sthapatya" published by the Association of Civil Engineers (Practicing) Aurangabad. It includes messages from current and past presidents of ACEP, memories and photos from past ACEP events, information on life time achievement awards given by ACEP, and a technical article on concrete maintenance, repairs and strengthening. The document highlights activities of ACEP and provides a technical educational article for members.
A review on techniques and modelling methodologies used for checking electrom...nooriasukmaningtyas
The proper function of the integrated circuit (IC) in an inhibiting electromagnetic environment has always been a serious concern throughout the decades of revolution in the world of electronics, from disjunct devices to today’s integrated circuit technology, where billions of transistors are combined on a single chip. The automotive industry and smart vehicles in particular, are confronting design issues such as being prone to electromagnetic interference (EMI). Electronic control devices calculate incorrect outputs because of EMI and sensors give misleading values which can prove fatal in case of automotives. In this paper, the authors have non exhaustively tried to review research work concerned with the investigation of EMI in ICs and prediction of this EMI using various modelling methodologies and measurement setups.
Presentation of IEEE Slovenia CIS (Computational Intelligence Society) Chapte...University of Maribor
Slides from talk presenting:
Aleš Zamuda: Presentation of IEEE Slovenia CIS (Computational Intelligence Society) Chapter and Networking.
Presentation at IcETRAN 2024 session:
"Inter-Society Networking Panel GRSS/MTT-S/CIS
Panel Session: Promoting Connection and Cooperation"
IEEE Slovenia GRSS
IEEE Serbia and Montenegro MTT-S
IEEE Slovenia CIS
11TH INTERNATIONAL CONFERENCE ON ELECTRICAL, ELECTRONIC AND COMPUTING ENGINEERING
3-6 June 2024, Niš, Serbia
Embedded machine learning-based road conditions and driving behavior monitoringIJECEIAES
Car accident rates have increased in recent years, resulting in losses in human lives, properties, and other financial costs. An embedded machine learning-based system is developed to address this critical issue. The system can monitor road conditions, detect driving patterns, and identify aggressive driving behaviors. The system is based on neural networks trained on a comprehensive dataset of driving events, driving styles, and road conditions. The system effectively detects potential risks and helps mitigate the frequency and impact of accidents. The primary goal is to ensure the safety of drivers and vehicles. Collecting data involved gathering information on three key road events: normal street and normal drive, speed bumps, circular yellow speed bumps, and three aggressive driving actions: sudden start, sudden stop, and sudden entry. The gathered data is processed and analyzed using a machine learning system designed for limited power and memory devices. The developed system resulted in 91.9% accuracy, 93.6% precision, and 92% recall. The achieved inference time on an Arduino Nano 33 BLE Sense with a 32-bit CPU running at 64 MHz is 34 ms and requires 2.6 kB peak RAM and 139.9 kB program flash memory, making it suitable for resource-constrained embedded systems.
Embedded machine learning-based road conditions and driving behavior monitoring
Single to multiple kernel learning with four popular svm kernels (survey)
1. IJRET: International Journal of Research in Engineering and Technology eISSN: 2319-1163 | pISSN: 2321-7308
_______________________________________________________________________________________
Volume: 05 Issue: 03 | Mar-2016, Available @ http://www.ijret.org 351
SINGLE TO MULTIPLE KERNEL LEARNING WITH FOUR POPULAR
SVM KERNELS (SURVEY)
Yassein Eltayeb Mohamed Idris1
, Li Jun2
1
MS. Student , School of Automation & Electric Engineering, Lanzhou Jiaotong University, Lanzhou, Gansu, China
2
Professor, School of Automation & Electric Engineering, Lanzhou Jiaotong University, Lanzhou, Gansu, China
Email Correspondence: yasinaltyb@yahoo.com
Abstract
Machine learning applications and pattern recognition have gained great attention recently because of the variety of applications
depend on machine learning techniques, these techniques could make many processes easier and also reduce the amount of
human interference (more automation). This paper research four of the most popular kernels used with Support Vector Machines
(SVM) for Classification purposes. This survey uses Linear, Polynomial, Gaussian and Sigmoid kernels, each in a single form and
all together as un-weighted sum of kernels as form of Multi-Kernel Learning (MKL), with eleven datasets, these data sets are
benchmark datasets with different types of features and different number of classes, so some will be used with Two-Classes
Classification (Binary Classification) and some with Multi-Class Classification. Shogun machine learning Toolbox is used with
Python programming language to perform the classification and also to handle the pre-classification operations like Feature
Scaling (Normalization).The Cross Validation technique is used to find the best performance Out of the suggested different
kernels' methods .To compare the final results two performance measuring techniques are used; classification accuracy and Area
Under Receiver Operating Characteristic (ROC). General basics of SVM and used Kernels with classification parameters are
given through the first part of the paper, then experimental details are explained in steps and after those steps, experimental
results from the steps are given with final histograms represent the differences of the outputs' accuracies and the areas under
ROC curves (AUC). Finally best methods obtained are applied on remote sensing data sets and the results are compared to a
state of art work published in the field using the same set of data.
Keywords: Machine Learning, Classification, SVM, MKL, Cross Validation and ROC.
--------------------------------------------------------------------***----------------------------------------------------------------------
1. INTRODUCTION
This paper studies a classification technique, which is sorted
under supervised learning. Supervised learning involves
using examples with known labels for the training process to
find a general relationship (rule), that rule maps the inputs
(features of the training examples) to the outputs (labels of
the training examples) [1]. the classification methods and
techniques used in this paper could be presented as follows:
1.1 Support Vector Machines (SVM)
SVM is a supervised learning method which is used for
classification, regression and other operations. In this
research it can be defined as the state-of-art approach for
classification problems [2, 3]. The basic principal behind the
SVM is to classify a given set of training data points into
two categories (two classes), this mission achieved by
forming a separating hyper plane maximizes the distance
(the margin) to the closest training data points of each class,
this operation would form a geometric or functional margin.
This would ensure a better generalization i.e. enhances the
ability of the classifier to classify new (unseen) points. As it
is shown in Figure 1, where three possible hyper planes to
separate the two groups of points are drawn. The hyper
plane H3 does not classify well all the training data points.
H1 classifies all the training data points, but it’s not at the
maximum margin from their nearest training data points, so
any new instance that would be to the right of the black
circles could be misclassified. The hyper plane H2 classifies
all the training data points well and it is the separating hyper
plane with the maximum margin [4,5,6].
The functional keys of SVM are that it maximizes the
functional margin and minimizes the structural risk error
which gives it better generalization ability.
Fig -1: SVM Separating Hyper Planes
2. IJRET: International Journal of Research in Engineering and Technology eISSN: 2319-1163 | pISSN: 2321-7308
_______________________________________________________________________________________
Volume: 05 Issue: 03 | Mar-2016, Available @ http://www.ijret.org 352
- For binary classification it could be represented as follows:
Given a set of points as training data T as follows [7, 8]:
= {( , )| ∈ , ∈ (−1,1)} (1)
Where represents D-dimensional features for one instance
(point) of data set, represents the label or the class of the
given instance as positive (1) or negative (-1), D represents
the number of features and N represents the number of
training instances (points).
SVM Finds the separating hyper plane to maximize the
margin between two parallel hyper planes, as shown in
figure 2 and divides the points into their classes in which
they belongs.
Fig -2: Support Vectors separating hyper plane
The equation of the separating hyper plane is given as:
∙ − = 0 (2)
Where w is a normal vector perpendicular to the separating
hyper plane and b is the hyper plane offset, where the offset
of the hyper plane from the origin of the direction of the
normal vector w is calculated from the parameter ‖ ‖
.
To maximize the margins, SVM chooses suitable values of
normal vector w and plane offset b.
Figure 2 shows two parallel hyper planes, those represented
as follows:
∙ − = 1 & ∙ − = 0 (3)
If a linearly separable set of data is given, then the classifier
selects two parallel hyper planes (support vectors) with no
data instance lies between them. The distance between the
two support vectors is calculated geometrically through ‖ ‖
, SVM then suppose to minimize ‖ ‖ to maximize the
distance between the support vectors.
Due to mathematical difficulty in optimization that results
because of the dependency on the absolute value of w,
which is a non-convex optimization problem that is very
difficult to solve, the equation should be possible to solve by
replacing ‖ ‖ with ‖ ‖ . This would generate the
following quadratic programming (QP) optimization:
min ‖ ‖ + ∑ (4)
. . ( + ) ≥ 1 − ∀
Where C is predefined positive trade-off parameter between
classification error and model simplicity and is a vector of
slack variables. Due to SVM objective which is maximizing
the margins between the two classes, then the optimization
problem could be solved indirect through Lagrangian dual
function [9] as follows:
max −
1
2
,
. . ∈ (5)
. = 0 & ≥ ≥ 0 ∀
Where is a vector of dual variables that corresponds to
separation constraints. Solving this yields = ∑
and the discriminate function can be represented in the
following new form:
( ) = ∑ ∈ + (6)
Where s is the support vectors indices.
- For multi-class classification many approaches could be
used, but the proposed toolbox (Shogun Machine Learning
Toolbox) uses One against All method.
For conventional One Against All method one SVM is
constructed per class to distinguish the samples of one class
from the samples of all other classes.
Let consider an -class problem, using One Against All
method, then direct decision functions are determined to
separate each class from the rest.
Let the decision function that has a maximum margin to
separate class from the remaining classes, be
( ) = ( ) + (7)
Where ( ) is the mapping function that maps into -
dimensional feature space. After optimization the training
data from class should satisfy ( ) ≥ 1 , and other classes
training points should satisfy ( ) ≤ −1 . this would give
the general decision function to classify a given point or
instance of data as it belongs to class if:
( ) > 0 (8)
But a problem appears when a given point or instance of
data is classified into more than one classes like the black
square data sample 1 in figure 3, or not classified by any
class like black circle data sample 2 in figure 3.
3. IJRET: International Journal of Research in Engineering and Technology eISSN: 2319-1163 | pISSN: 2321-7308
_______________________________________________________________________________________
Volume: 05 Issue: 03 | Mar-2016, Available @ http://www.ijret.org 353
Fig -3: Three-class problem with two-dimensional input to
show unclassifiable regions by one-against-all formulation
To solve this, continuous decision functions are proposed
for classification instead of the direct decision function. That
means, data instance or point ( ) is classified due to the
following rule:
arg max ,…, ( ) (9)
Following this rule, data sample 1 in the figure could be
classified into the second class (class 2), and data sample 2
could be classified into the first class (class 1).
1.2 Kernel Concept
In the case of training a non-linearly separable data, a hyper
plane may not provide high generalization ability.
There for to enhance the classification, the original input
space is mapped into a new high dimensional space (Feature
Space) [7, 6, 10]. That would create a nonlinear vector
function ( ) = 〈 ( ), … , ( )〉 which maps the feature
space input vector from N-dimensional to l-dimensional.
Due to the previous function the linear decision function for
a given features could be rewritten as:
( ) = ( ) + (10)
Now introducing the general representation for the kernel
function , the optimization problem can be
represented as follows:
max −
1
2
,
. . ∈ (11)
. = 0 & ≥ ≥ 0 ∀
The discriminate function can be written as:
( ) = ∑ ( , ) + (12)
SVM has many kernel functions , , this research uses
four of them as single kernel and to make a linear
combination of them. These Kernels are:
1.2.1 Linear Kernel
Linear kernel is the basic form of the SVM that is usually
used for linear separable data sets [11]. The kernel uses
separation hyper-plane with maximum margins to enhance
the generalization process [4, 6]. The mathematical formula
of the kernel could be presented as follows:
( , ) = ( ) ( ) (13)
For ( , ) is a positive semidefinite kernel, the
optimization problem comes as a quadratic programming
problem. And because equation (1.6) = 0 is a feasible
solution, so the problem has a global optimum solution.
The Karush-Kuhn –Tucker [6, 12] (KKT) complementary
conditions given by:
〈 , + 〉 − 1 + = 0
for = 1, … , (14)
( − ) = 0 for = 1, … ,
≥ 0, ≥ 0 for = 1, … ,
The decision function is given as:
( ) = ∑ ( , )∈ + (15)
Where b is set as:
= − ∑ ( , )∈ (16)
Where is an unbounded support vector. The average is
taken to ensure the stability of the calculation as follows:
= | |
∑ { − ∑ ∈ ( , )}∈ (17)
is the set of the unbounded support vector indices. And
when given a new set of data for classification, the
following decision function would be used:
∈
Class 1 if ( ) > 0
Class 2 if ( ) < 0
(18)
If ( ) = 0, then X is unclassifiable. The pervious
explanation is for two classes’ classification, and for multi-
classes classification refer to equation (9) .
4. IJRET: International Journal of Research in Engineering and Technology eISSN: 2319-1163 | pISSN: 2321-7308
_______________________________________________________________________________________
Volume: 05 Issue: 03 | Mar-2016, Available @ http://www.ijret.org 354
1.2.2 Polynomial Kernel
Polynomial kernel is one of the famous kernels used with
SVM in the case of linearly inseparable datasets. The kernel
is represented by:
( , ) = ( + 1) (19)
Where is a natural number that represents the polynomial
kernel degree. The inseparable one-dimensional example of
three instances shown in figure 4, could be solved using the
polynomial kernel with = 2 , the dual problem is as
follows:
max ( ) = + + − (2 + + 2 −
( + )) (20)
s. t − + = 0, ≥ ≥ 0 (21)
for = 1,2,3. (21)
Fig -4: Three data instances from inseparable one-
dimensional case
From equation (21), = + . Applying the value of
into (20) gives:
( ) = 2 + 2 − (2 − ( + ) + 2 ), (22)
≥ ≥ 0 for = 1,2,3.
From:
( )
= 2 − 3 + = 0, (23)
( )
= 2 + − 3 = 0
Solving (23) gives = = 1 , therefore the optimum
solution for ≥ 2 is:
= 1, = 2, = 1.
When ≥ 2, then = −1, 0, and 1, are support vectors.
Applying in equation (16), gives = −1, and the decision
function would be:
( ) = ( − 1) + ( + 1) − 3 = 2 − 1
The boundaries of the decision are given as = ±√2/2. It
is clear through following the value of ( ) in figure 5 that
the margin for class 2 is larger than that for class one in the
input space.
Fig -5: Polynomial kernel’s decision function for
inseparable one-dimensional case
1.2.3 Gaussian Kernel
The Gaussian Radial Basis Function kernel or RBF is one of
the popular kernel functions used in various classification
techniques [6, 13]. This kernel and other kernels provide the
SVM with nonlinearity ability of classification. The kernel
function could be shown as follows:
( , ) = exp (− ‖ − ‖ ) (24)
Where is a positive parameter to control Gaussian function
radius. Applying the kernel function to equation (15), this
yields the following decision function:
( ) = ∑ exp(− ‖ − ‖ ) +∈ (25)
Figure 6 shows the classification mapping effect of the
RBF’s decision function.
Fig -6: RBF decision function’s mapping for two-
dimensional case
1.2.4 Sigmoid Kernel
The sigmoid kernel is mostly known with the neural
networks, but it is still a useful kernel that could be used
with SVM to work out many applications [14, 15]. The
kernel function could be represented as follows:
( , ) = tanh( + ) (26)
Where and are parameters to control the polynomial
function, Applying the kernel function to equation (15)
yields the following decision function:
( ) = ∑ tanh( + ) +∈ (27)
5. IJRET: International Journal of Research in Engineering and Technology eISSN: 2319-1163 | pISSN: 2321-7308
_______________________________________________________________________________________
Volume: 05 Issue: 03 | Mar-2016, Available @ http://www.ijret.org 355
1.3 MKL
Multiple Kernel Learning (MKL), is an approach used with
SVM that involves combining a number of kernels to
overcome the process of kernel selection [16,17] . This
study applies an un-weighted linear combination of the
pervious mentioned kernels and compare it to a single kernel
performance. A general function for combination of kernels
( , ) could be represented as follows:
, = ( , ) } (28)
Where is feature representations of given data instances
for = { } , where ∈ , and is feature
representation dimensionality. (Eta) parameterizes the
combination function of kernels (weights of the kernels).
The linear combination function could be presented as
follows:
, = ∑ ( , ) (29)
The primal form of MKL optimization problem could be
obtained from the set of equations (4) which could be
presented as follows [18]:
min
1
2
( ‖ ‖) +
w. r. t. ∈ , ∈ , ∈ (30)
s. t. ≥ 0 and 〈 , Φ ( )〉 + ≥ 1 − ,
∀ = 1, … ,
Where the problem's solution could be written as =
with ≥ 0, ∀ = 1, … , and ∑ = 1 . It
should be noticed that the ℓ -norm of is constrained to
one, while the ℓ -norm of is penalized in each block
separitily. The constrained or penalized variables of ℓ -
norm tend to have sparse optimal solutions, while penalized
variables of ℓ -norm don not.
The dual for the previous problem was driven by taking
problem ( ), squaring the constraint on beta, multiplying
the constraint by 1/2 and finally substituting ⟼
which would lead to the following MKL dual [19]:
min −
w. r. t. ∈ , ∈ (31)
s. t. 0 ≤ ≤ 1 , = 0,
1
2
( , ) ≤ ,
∀ = 1, … ,
Where , = 〈Φ ( ), Φ ( )〉 . The previous set
represents the formula used in shogun toolbox.
1.4 Remote Sensing
Remote sensing could be defined in general as the methods
or techniques used to acquire information about an object or
phenomena without making physical contact with it [19,
20,21]. but it is most known for acquiring information
about the surface of the earth without being in direct
physical contact with that surface.
As part of this paper to use the best kernel method in an
advanced application, study results are used on earth surface
remote sensing data set used in a paper titled "Classifying a
high resolution image of an urban area using super-object 4
information." [22], then accuracy results obtained from this
research are compared to results in the mentioned paper.
2. EXPERIMENTAL SETUP
This part presents the data sets, tools and techniques those
used to perform the classification and find the performance
differences between the different suggested methods.
2.1 Data Sets
The data sets used in this research are bench mark data from
real world sources [23], they have different ranges in classes
from 2 to 11, and also there features are different in the
range and data types. For some of the sets like the DNA set,
they had to be treated before they could be fed into the
kernels, the processes of transforming features, selecting
features or extracting features from given information, are
known as Feature Engineering.
The variety in data sets used with the thesis, allows a better
chance for judging the performance of the different
suggested methods. Main attributes of those data sets are
given in table 1.
Table -1: Data sets' general attributes
Data Set Number of
Instances
Number of
Features
Number of
Classes
Breast
Cancer
569 30 2
DNA 106 57 2
ECG 65536 9 2
EEG Eye
State
14980 14 2
SPECT
Heart
267 22 2
Abalone 4177 8 3
Balance
Scale
625 4 3
Iris 150 4 3
Wine 13 178 3
Car
Evaluation
1728 6 4
Vowel
Recognition
10 990 11
6. IJRET: International Journal of Research in Engineering and Technology eISSN: 2319-1163 | pISSN: 2321-7308
_______________________________________________________________________________________
Volume: 05 Issue: 03 | Mar-2016, Available @ http://www.ijret.org 356
Finally the data set used for remote sensing are for high
resolution aerial image with 9 types of urban land cover.
Multi-scale spectral, size, shape, and texture information are
used for classification. There are a low number of training
samples for each class (14-30) and a high number of
classification features (148). the source of data is Institute
for Global Environmental Strategies; 2108-11
Kamiyamaguchi, Hayama, Kanagawa, 240-0115 Japan[24].
Also available on UCI machine learning repository
[23]. these data have been used in two papers [22, 25].
Figure 7 shows a color infrared image of the study area.
Classes were sampled into 9 categories; Asphalt 59
instances, Building 122 instances, Car 36 instances,
Concrete 116 instances, Grass 112 instances, Pool 29
instances, Shadow 61 instances, Soil 34 instances and Tree
106 instances.
Fig -7: Infrared Image of remote sensing study area
2.2 Normalization
Input variable (features) those used in classification or in
other machine learning operations, are usually obtained
from different sources with different physical meaning, the
variety of sources gives data sets different ranges. The
dispersion in values of features could affect the performance
of the classification, as slowing the classification process or
causing computation problems due to the limited memory
access in some computers.
Normalization Technique [2,6] is used to solve most of the
pervious problems. In this dissertation data sets are
classified with and without normalization under the four
suggested kernels, to show the effect of normalization for
different data sets and different kernels. Normalization
scales the input variables’ range into {[0, 1] or [-1, 1]}.
In this paper normalization is used to get the feature scaling
into the range {[0, 1]}, through equation (32).
= (32)
The same Scale of normalization used on training data
should be used on testing and cross validation sets, which
may lead to values greater than 1 or less than 0 in the tested
data. To achieve this mission a library from scikit Learn
(Python programming language machine learning toolkit)
[26] is used. The code to normalize data is as follows:
>>> min_max_scaler=preprocessing.MinMaxScaler()
>>>Normalized_Train_DAta=min_max_scaler.fit_transfor
m(Original_Train_Set)
>>>Normalized_Test_DAta=min_max_scaler.transform(Ori
ginal_Test_Set)
2.3 Cross Validation Technique
This technique used to ensure the classifier ability of
generalization, within given set of data, applying this
method by dividing data into training, cross validation and
testing groups would allow a chance of testing the classifier
after choosing a parameter or set of parameters through
cross validation technique.
In this research when this technique introduces data were
divided as 60% training, 20% cross validation and 20%
testing except for the remote sensing set, where 508
instances were provided for testing , almost 23% of them
used for cross validation and the rest for the final testing.
The number of training data was kept as the original source
provided for the sake of results' comparison.
2.4 Performance Measuring
Among a number of techniques used to measure
classification performance, is the Classification Accuracy
and Area Under Curve (AUC), where the curve is the
Receiver Operating Characteristic curve, or ROC curve.
The Classification Accuracy measures how often a given
classifier finds the correct prediction. It’s simply the ratio
between the correctly classified instants and the total
number of instances.
accuracy =
#
#
(33)
For Accuracy measuring does not make any distinction
between classes, i.e. correctly identified instances for class 0
and class 1, are treated the same. In some applications, some
classes are more important to be classified correctly, so in
such case accuracy measuring would not give a proper view
of the classification. To see more of the classification
performance, other methods are used like confusion matrix,
per-class accuracy, log-loss, F1 score and AUC [27].
In this paper AUC is used through generating ROC.
Receiver Operating Characteristic curve (ROC) got its name
from a paper published in the 1970s by Charles Metz with
the name "Basic Principles of ROC analysis." [28]. ROC
curve shows the classification sensitivity through plotting
the rate of true positive instances to false positive instances.
That means it shows how many correct positive instances
could be gained if more and more false positive are allowed.
7. IJRET: International Journal of Research in Engineering and Technology eISSN: 2319-1163 | pISSN: 2321-7308
_______________________________________________________________________________________
Volume: 05 Issue: 03 | Mar-2016, Available @ http://www.ijret.org 357
A perfect classifier with no mistake would yield a true
positive rate of 100% without a single false positive in it.
Through this paper experiments, ROC curves are shown for
all classes found by different kernels, then AUC is obtained
from these ROC curves as a single value to evaluate and
compare the different classifiers. A good classifier yields a
ROC curve with a wider area under the curve, i.e. the true
positive rate gets to 1.0 (equals to 100%) as quickly as
possible.
For multi-classes classification the AUC is calculated for
each class alone (one class vs. all classes), finally average
AUC of all classes is used to evaluate the classifier.
2.5 Software and System Specification
Hardware Intel Processor i7, Frequency 2.67 GHz, Ram 8
GB.
Operating System Ubuntu 12.04 (precise) 64 bit.
Programming Language Implementation is in python
language v 2.7 [29, 30].
IDE Programming is done with the Eclipse IDE
environment.
SHOGUN Toolbox API for machine learning tool [31],
version 2.1.0.
3. EXPERIMENTAL STEPS AND RESULTS
This part explains the steps followed to find kernel methods'
best performance using single kernel and then using un-
weighted combination of the proposed kernels. It also shows
the most important results through the experiments. the final
part shows the experiments and the results on remote
sensing data sets and compare the results to other results
obtained by other research.
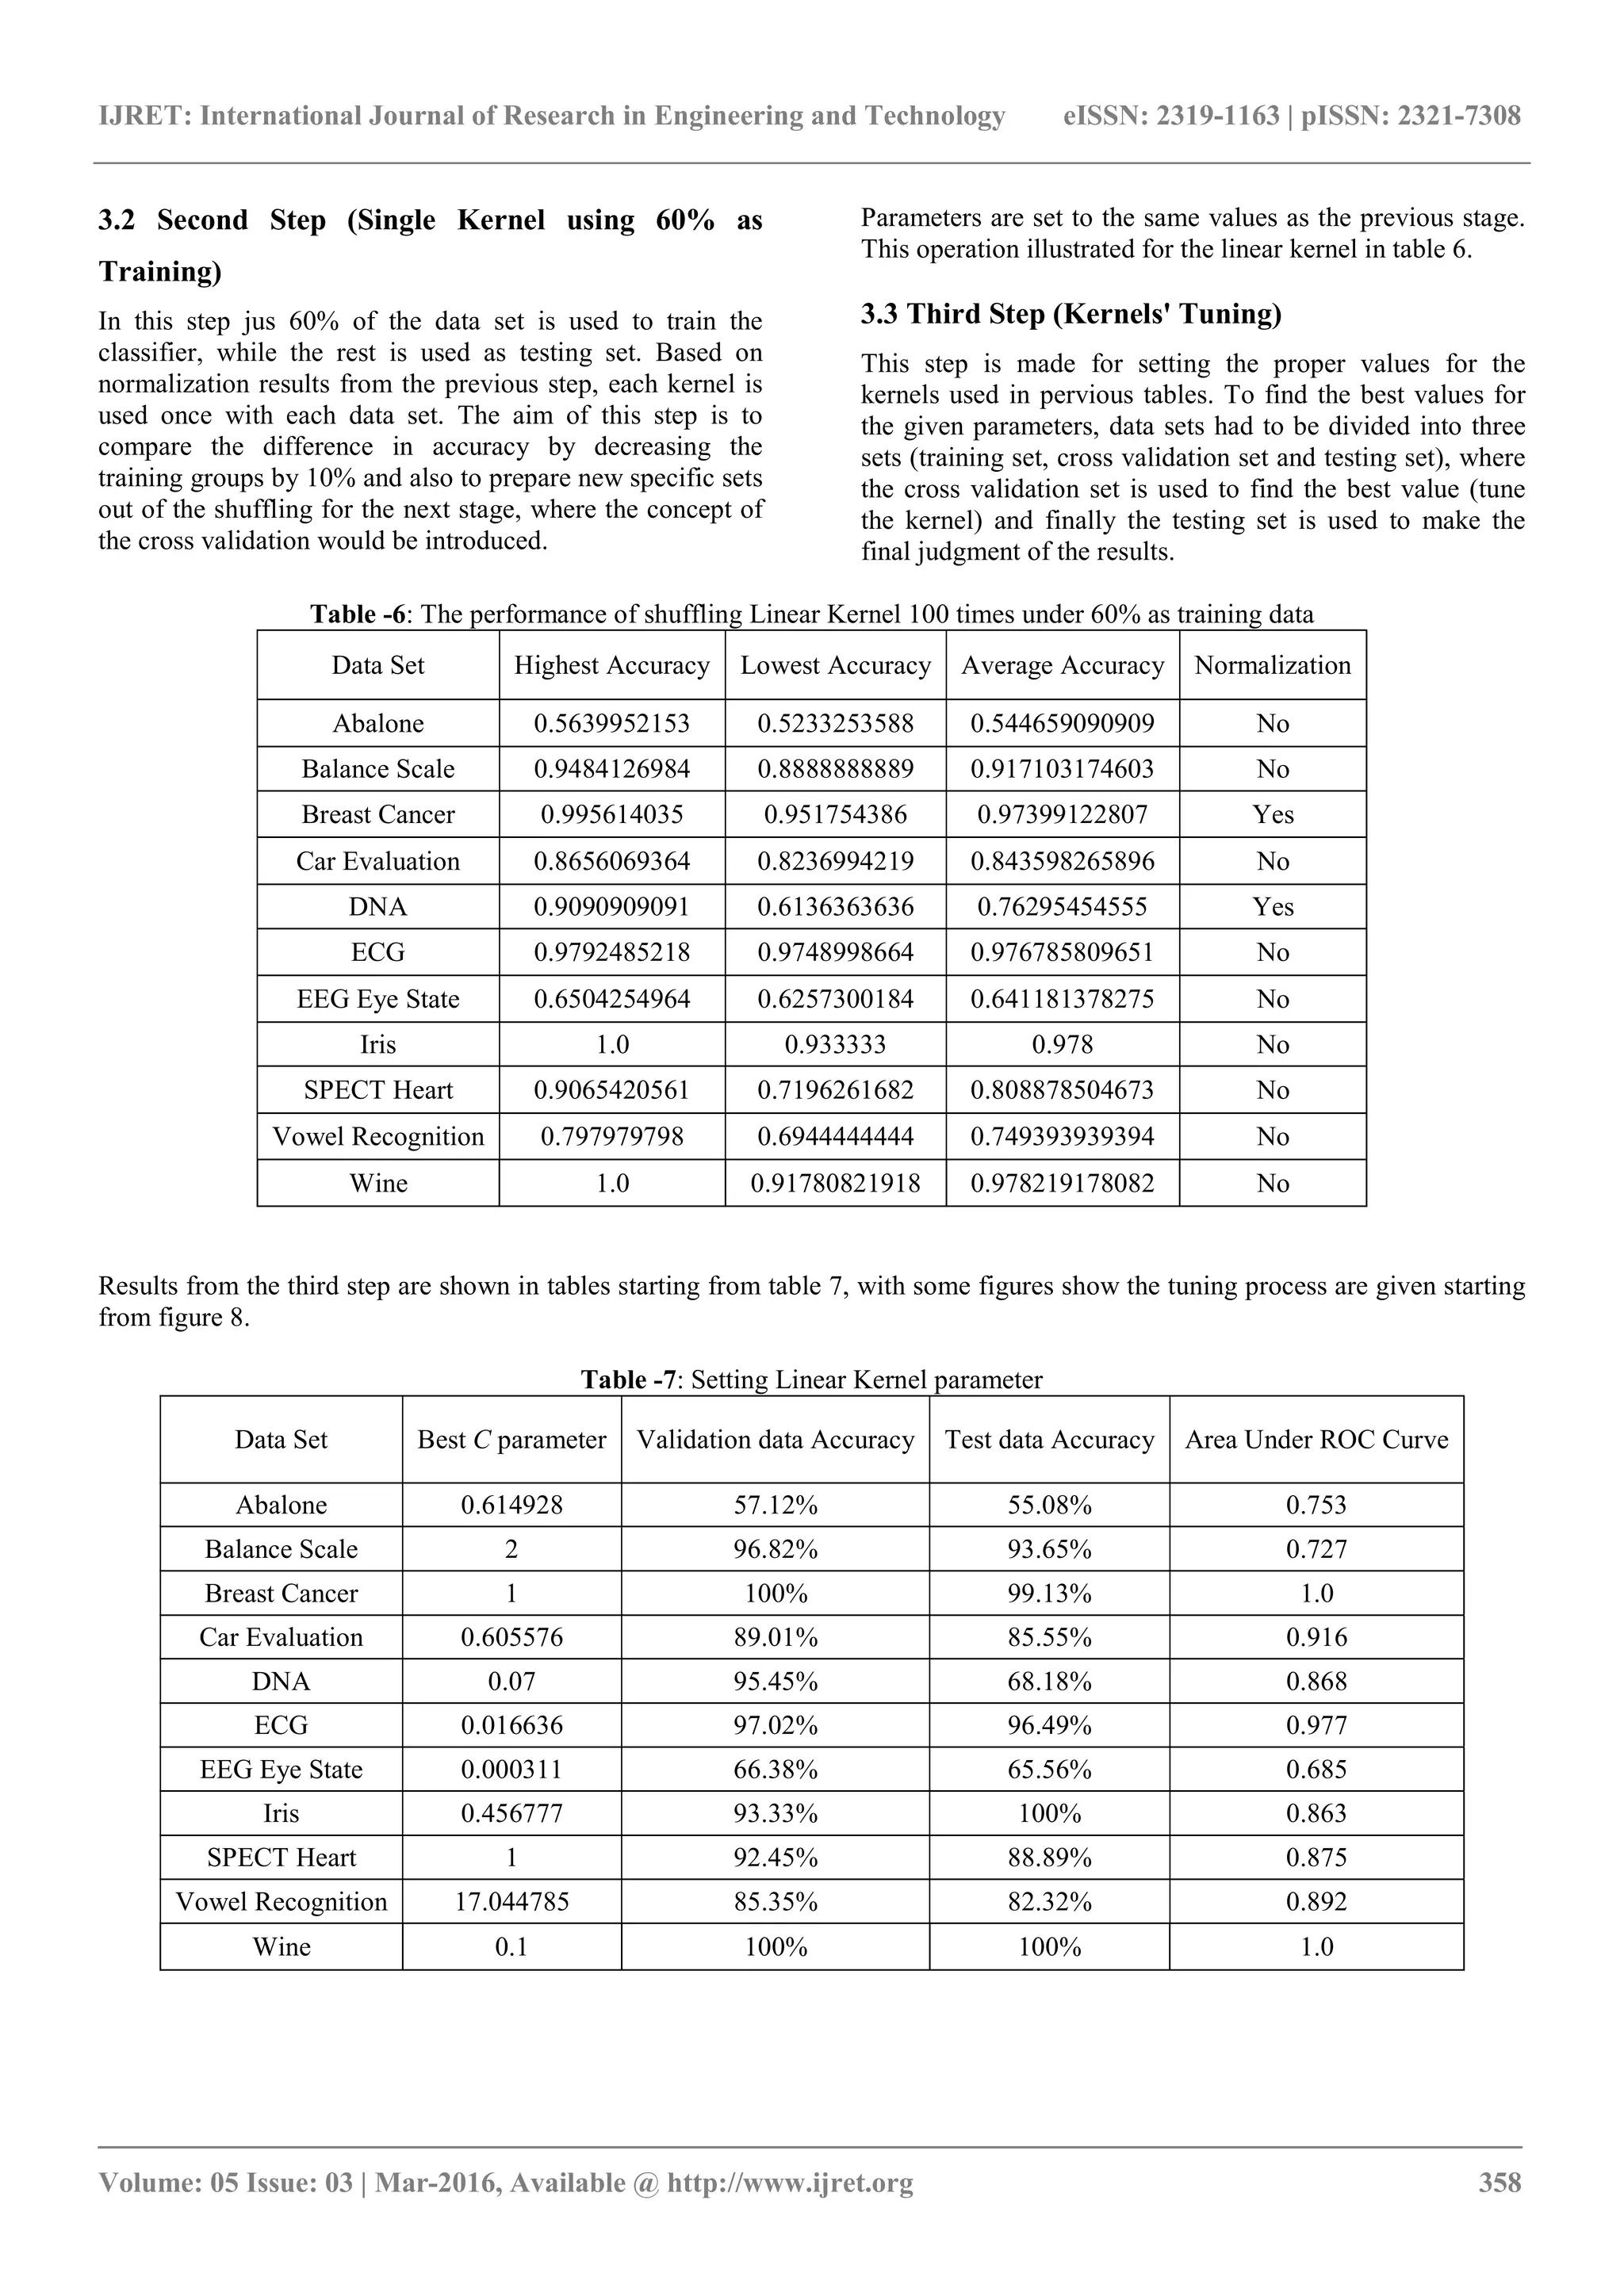
3.1 First Step (Single Kernel Initial Values using
70% Training)
In this step arbitrary values are assigned to the parameters,
then data shuffled 100 times under each of the proposed
kernels. The aim of this stage is to try the kernels with
normalization and without normalization, and then due to
the outcome a decision of using or not using the
normalization technique is taken for each kernel with each
data set.
This part gets the results of training 70% of the data and
using the rest for testing the classification accuracy. The aim
is to show the difference in the accuracy under different
training rates of the data (later using 60% as training) and to
find the efficiency of using the normalization technique.
Kernels’ parameters are set as follows:
Linear Kernel: = 1
Polynomial Kernel: = 1 and = 3
Gaussian Kernel: = 1 and = 0.1
Sigmoid Kernel: = 1 and = 0.01
some of this stage results are given in the following tables:
Table -2: Shuffling Abalone data set for 100 times without
normalization
Kernel
Highest
Accuracy
Lowest
Accuracy
Average
Accuracy
Linear 0.564940239044 0.521115537849 0.544541832669
Polynomial 0.548207171315 0.498007968127 0.521314741036
Gaussian 0.565737051793 0.509163346614 0.537657370518
Sigmoid 0.214342629482 0.145019920319 0.180605577689
Table -3: Shuffling Abalone data set for 100 times with
normalization
Kernel
Highest
Accuracy
Lowest
Accuracy
Average
Accuracy
Linear 0.569721115583 0.521912350598 0.544111553785
Polynomial 0.572908366534 0.527490039841 0.547569721116
Gaussian 0.581673306773 0.530677290837 0.557354581673
Sigmoid 0.537848605578 0.500398406375 0.520374501992
The average accuracy is calculated through the shuffling as
follows:
Average Accuracy =
∑
#
#
(34)
Table -4: Shuffling Vowel Recognition data set for 100
times without normalization
Kernel
Highest
Accuracy
Lowest Accuracy
Average
Accuracy
Linear 0.808080808081 0.707070707071 0.75430976431
Polynomial 0.673400673401 0.538720538721 0.604276094276
Gaussian 0.858585858586 0.703703703704 0.782861952862
Sigmoid 0.56228956229 0.434343434343 0.505218855219
Table -5: Shuffling Vowel Recognition data set for 100
times with normalization
Kernel
Highest
Accuracy
Lowest
Accuracy
Average
Accuracy
Linear 0.700336700337 0.592592592593 0.647878787879
Polynomial 0.794612794613 0.686868686869 0.733569023569
Gaussian 0.993265993266 0.939393939394 0.977306397306
Sigmoid 0.542087542088 0.417508417508 0.471043771044
8. IJRET: International Journal of Research in Engineering and Technology eISSN: 2319-1163 | pISSN: 2321-7308
_______________________________________________________________________________________
Volume: 05 Issue: 03 | Mar-2016, Available @ http://www.ijret.org 358
3.2 Second Step (Single Kernel using 60% as
Training)
In this step jus 60% of the data set is used to train the
classifier, while the rest is used as testing set. Based on
normalization results from the previous step, each kernel is
used once with each data set. The aim of this step is to
compare the difference in accuracy by decreasing the
training groups by 10% and also to prepare new specific sets
out of the shuffling for the next stage, where the concept of
the cross validation would be introduced.
Parameters are set to the same values as the previous stage.
This operation illustrated for the linear kernel in table 6.
3.3 Third Step (Kernels' Tuning)
This step is made for setting the proper values for the
kernels used in pervious tables. To find the best values for
the given parameters, data sets had to be divided into three
sets (training set, cross validation set and testing set), where
the cross validation set is used to find the best value (tune
the kernel) and finally the testing set is used to make the
final judgment of the results.
Table -6: The performance of shuffling Linear Kernel 100 times under 60% as training data
Data Set Highest Accuracy Lowest Accuracy Average Accuracy Normalization
Abalone 0.5639952153 0.5233253588 0.544659090909 No
Balance Scale 0.9484126984 0.8888888889 0.917103174603 No
Breast Cancer 0.995614035 0.951754386 0.97399122807 Yes
Car Evaluation 0.8656069364 0.8236994219 0.843598265896 No
DNA 0.9090909091 0.6136363636 0.76295454555 Yes
ECG 0.9792485218 0.9748998664 0.976785809651 No
EEG Eye State 0.6504254964 0.6257300184 0.641181378275 No
Iris 1.0 0.933333 0.978 No
SPECT Heart 0.9065420561 0.7196261682 0.808878504673 No
Vowel Recognition 0.797979798 0.6944444444 0.749393939394 No
Wine 1.0 0.91780821918 0.978219178082 No
Results from the third step are shown in tables starting from table 7, with some figures show the tuning process are given starting
from figure 8.
Table -7: Setting Linear Kernel parameter
Data Set Best C parameter Validation data Accuracy Test data Accuracy Area Under ROC Curve
Abalone 0.614928 57.12% 55.08% 0.753
Balance Scale 2 96.82% 93.65% 0.727
Breast Cancer 1 100% 99.13% 1.0
Car Evaluation 0.605576 89.01% 85.55% 0.916
DNA 0.07 95.45% 68.18% 0.868
ECG 0.016636 97.02% 96.49% 0.977
EEG Eye State 0.000311 66.38% 65.56% 0.685
Iris 0.456777 93.33% 100% 0.863
SPECT Heart 1 92.45% 88.89% 0.875
Vowel Recognition 17.044785 85.35% 82.32% 0.892
Wine 0.1 100% 100% 1.0
9. IJRET: International Journal of Research in Engineering and Technology
__________________________________________________________
Volume: 05 Issue: 03 | Mar-2016, Available @
Fig -8: Change in accuracy while C changes for classifying
Abalone Data set under linear kernel
Table
Data Set
Best C
parameter
Best Degree
parameter
Abalone 0.707 2
Balance Scale 300 2
Breast Cancer 62 2
Car Evaluation 25 7
DNA 1.5 2
ECG 57 19
EEG Eye State 1 2
Iris 5 2
SPECT Heart 1.3 2
Vowel
Recognition
3500 11
Wine 2650 3
Table
Data Set
Best C
Parameter
Best Gamma
parameter
Abalone 1.648774 0.114
Balance Scale 0.7 1.5
Breast Cancer 0.359742 6.5
Car Evaluation 2 0.15
DNA 0.5 3
ECG 5.35 0.3
EEG Eye State 1 3.5
Iris 1 1.35
SPECT Heart 1 4
Vowel
Recognition
1.51 0.12
Wine 1.5 5
IJRET: International Journal of Research in Engineering and Technology eISSN: 2319
_______________________________________________________________________________________
, Available @ http://www.ijret.org
changes for classifying
Abalone Data set under linear kernel
Fig -9: Tuning of Breast Cancer
kernel
Table -8: Setting Polynomial Kernel parameters
Degree
parameter
Validation data
Accuracy
Test data
Accuracy
2 54.61% 56.63%
2 100% 99.2 %
2 95.57% 92.17%
7 97.68% 95.95%
2 90.91% 95.45%
19 99.30% 99.27%
2 55.10% 55.12%
2 93.33% 90.0%
2 83.02% 88.89%
11 95.45% 94.95%
3 100% 89.19%
Table -9: Setting Gaussian Kernel parameters
Best Gamma
parameter
Validation data
Accuracy
Test data
Accuracy
0.114 56.64% 57.47%
1.5 89.68% 91.27%
6.5 97.34% 90.43%
0.15 98.84% 98.26%
3 90.91% 86.36%
0.3 99.42% 99.46%
3.5 55.47% 55.09%
1.35 96.66% 96.66%
4 90.56% 81.48%
0.12 97.98% 95.96%
5 100% 97.3%
eISSN: 2319-1163 | pISSN: 2321-7308
_____________________________
359
Breast Cancer parameter under Gaussian
kernel
Area Under
ROC Curve
Normalization
0.708 Yes
0.949 Yes
0.986 Yes
0.989 Yes
1 No
0.998 No
0.64 Yes
0.948 No
0.877 No
0.991 No
0.987 No
Area Under
ROC Curve
Normalization
0.693 Yes
0.976 Yes
0.99 Yes
0.999 Yes
0.917 Yes
0.999 No
0.6 Yes
0.838 Yes
0.897 No
0.969 Yes
0.996 Yes
10. IJRET: International Journal of Research in Engineering and Technology
__________________________________________________________
Volume: 05 Issue: 03 | Mar-2016, Available @
Fig -10: Tuning of EEG Eye State parameter under
Gaussian kernel
Fig -11: Tuning of Abalone parameter under Gaussian
kernel
Table
Data Set
Best C
parameter
Best
parameter
Abalone 7 0.192031
Balance Scale 3320 0.01
Breast Cancer 10 0.095
Car Evaluation 18.5 0.1
DNA 1 0.05
ECG 1.83 0.0222
EEG Eye State N.E N.E
Iris 1 0.0001
SPECT Heart 0.6 3
Vowel
Recognition
61.5 0.0093
Wine 3 0.3
Notice that values stated as N.E (Not Effective)
the parameter value.
IJRET: International Journal of Research in Engineering and Technology eISSN: 2319
_______________________________________________________________________________________
, Available @ http://www.ijret.org
parameter under
parameter under Gaussian
Fig -12: Tuning of Car Evaluation
sigmoid kernel
Fig -13: Tuning of Iris parameter under sigmoid kernel
Table -10: Setting Sigmoid Kernel parameters
Best
parameter
Validation data
Accuracy
Test data
Accuracy
Area Under ROC
0.192031 54% 51%
0.01 96% 89.68%
0.095 95.56% 97.39%
0.1 78.61% 74.56%
0.05 90.91% 86.36%
0.0222 97.31% 97.29%
N.E 55.1% 55.12%
0.0001 96.66% 90%
3 92.45% 85.18%
0.0093 71.21% 61.11%
0.3 97.22% 91.89%
(Not Effective) means that the performance of the classifier was not affected with the change in
eISSN: 2319-1163 | pISSN: 2321-7308
_____________________________
360
Car Evaluation parameter under
sigmoid kernel
parameter under sigmoid kernel
Area Under ROC
Curve
Normalization
0.72 Yes
0.745 Yes
0.999 Yes
0.855 Yes
0.893 Yes
0.979 No
0.586 Yes/No
0.882 Yes
0.509 No
0.705 No
0.868 Yes
means that the performance of the classifier was not affected with the change in
11. IJRET: International Journal of Research in Engineering and Technology eISSN: 2319-1163 | pISSN: 2321-7308
_______________________________________________________________________________________
Volume: 05 Issue: 03 | Mar-2016, Available @ http://www.ijret.org 361
3.4 Fourth Step (MKL Initial Values using 70%
Training )
In this step MKL algorithm is trained with un-weighted
summation of the stated kernels using initial values of
parameters close or equal to those used in single kernel
operations with training data percentage equal to 70% and
testing data percentage equal to 30%. Each data set shuffled
100 times if possible, except for big sets they were shuffled
only 10 times because of computational issues related to
MKL made those data processing highly time consuming.
After shuffling the average accuracy was obtained to be
compared to the single kernel performance later. Parameters
are set to; C = 1, d = 2, γ = 0.1 and a = 0.001.
While date normalization or scaling is an option with the
single kernel operation, it is necessary with MKL training
processes, especially when using shogun toolbox through
Ubuntu operating system 12.4 [32] , because of features
combining process and data chunking are highly
computationally expensive.
The results out of the previous paragraph are presented in
table 11.
Table -11: Training MKL with 70% of data sets and shuffling for 100 or 10 times
Data Set Best Accuracy Lowest Accuracy Average Accuracy
Abalone (10 times) 0.567330677291 0.543426294821 0.553466135458
Balance Scale 0.989417989418 0.957671957672 0.973968253968
Breast Cancer 0.953488372093 0.866279069767 0.915
Car Evaluation 0.857692307692 0.792307692308 0.833326923077
DNA 0.90625 0.65625 0.77625
ECG (10 times) 0.988760044756 0.931288780389 0.97031329468
EEG Eye State (10 times) 0.753726362625 0.739043381535 0.746184649611
Iris 1.0 0.88888889 0.95111111
SPECT Heart 0.888888888889 0.740740740741 0.826790123457
Vowel Recognition 0.946127946128 0.878787878788 0.913737373737
Wine 0.890909090 0.6363636364 0.785454545
3.5 Fifth Step (MKL using 60% as Training)
In this step the same process from the previous step is
repeated with one difference, which is 60% of the data are
used as training set and 40% as testing set. The aim of this
step is to choose proper sets for the next step. Properly
chosen sets can reveal the ability of MKL classifier to
enhance the classification accuracy. In some cases Like Iris
data set the set with the worst accuracy out of the second
step is chosen for further processing, because the best
performance out of the Iris set has 100% accuracy, which is
not good for judging the ability of the classifier to enhance
the accuracy. Results from second step are presented in table
12.
Table -12: Training MKL with 60% of data sets and shuffling for 100 or 10 times
Data Set Best Accuracy Lowest Accuracy Average Accuracy
Abalone (10 times) 0.570574162679 0.546052631579 0.555921052632
Balance Scale 0.992063492063 0.940476190476 0.973134920635
Breast Cancer 0.951754385965 0.868421052632 0.91649122807
Car Evaluation 0.851156069364 0.799132947977 0.826719653179
DNA 0.886363636364 0.659090909091 0.770681818182
ECG (10 times) 0.990120160214 0.933778371162 0.9730650391
EEG Eye State (10 times) 0.743534123144 0.729017186718 0.737460370432
Iris 1.0 0.9 0.9505
SPECT Heart 0.88785046729 0.766355140187 0.82691588785
Vowel Recognition 0.944444444444 0.856060606061 0.894166666667
Wine 0.849315068493 0.616438356164 0.756849315068
3.6 Sixth Step (Tuning MKL)
In this step the technique of cross validation is used to find
the best parameters through tuning the classifier using each
parameter range. Data sets are chosen from the previous step
with new distribution in this step, which is 60% training,
20% cross validation and 20 percent for testing.
Final results’ performances are measured through the
accuracy and AUC from ROC.
12. IJRET: International Journal of Research in Engineering and Technology
__________________________________________________________
Volume: 05 Issue: 03 | Mar-2016, Available @
Since un-weighted linear combination is used with MKL
method, the parameters in use would be the kernels’
parameters allowed to control by shogun toolbox
regularization parameter on kernels’ weights to prevent
them from shooting off to infinity, this parameter is
Another parameter available through shogun toolbox is
norm as described in reference [31] and Marius Kloft, Ulf
Brefeld, Soeren Sonnenburg, and Alexander Zien. Efficient
and accurate lp-norm multiple kernel learning
To summarize the previous part, the following par
are used for MKL algorithm training:
Table -
Data Set C
Abalone (10 times) 0.009
Balance Scale 0.05
Breast Cancer N.E
Car Evaluation 10
DNA N.E
ECG (10 times) N.E
EEG Eye State (10 times) N.E
Iris 0.005
SPECT Heart N.E
Vowel Recognition 15
Wine 1
Fig -12: MKL Car evaluation tuning
Fig -13: ROCs of classes under MKL for Car evaluation
IJRET: International Journal of Research in Engineering and Technology eISSN: 2319
_______________________________________________________________________________________
, Available @ http://www.ijret.org
ion is used with MKL
, the parameters in use would be the kernels’
parameters allowed to control by shogun toolbox [31] plus
regularization parameter on kernels’ weights to prevent
them from shooting off to infinity, this parameter is .
shogun toolbox is lp-
] and Marius Kloft, Ulf
Brefeld, Soeren Sonnenburg, and Alexander Zien. Efficient
norm multiple kernel learning [33].
To summarize the previous part, the following parameters
Parameter: kernels’ weights regularization
parameter.
Parameter: stands for lp
enhance the performance.
Parameter: the polynomial kernel degree.
Parameter: the RBF positive parameter to control
the radius.
Parameter: stands for one of the S
parameters.
Final results from the third step are presented in table
then some of the results' graphs are given.
-13: Final Results out of Tuning MKL algorithm
d a Norm Cross Validation
1.066 2 0.001 12 55.81%
0.5 8 N.E 6 93.65%
0.01 2 N.E 2 98.23%
0.5 2 0.01 2 99.13%
0.1 N.E N.E N.E 90.91%
0.1726 2 N.E 2 98.76%
0.000007074 2 N.E 2 84.78%
0.1 N.E N.E N.E 96.66%
0.1 N.E N.E 2 92.45%
0.1 2 N.E 2 98.48%
0.4 10 N.E N.E 100%
tuning
Car evaluation
Fig -14: MKL's ROC for ECG dataset
Fig -15: ROCs of classes under MKL for Vowel
Recognition data set
eISSN: 2319-1163 | pISSN: 2321-7308
_____________________________
362
Parameter: kernels’ weights regularization
Parameter: stands for lp-norm technique to
enhance the performance.
Parameter: the polynomial kernel degree.
Parameter: the RBF positive parameter to control
rameter: stands for one of the Sigmoid kernel
Final results from the third step are presented in table 13,
graphs are given.
Cross Validation Test Set AUC
53.16% 0.757
89.68% 0.823
99.13% 0.997
99.42% 0.992
86.36% 0.942
99.07% 0.998
83.72% 0.898
100% 1.0
85.18% 0.775
92.42% 0.996
100% 1.0
: MKL's ROC for ECG dataset
: ROCs of classes under MKL for Vowel
Recognition data set
13. IJRET: International Journal of Research in Engineering and Technology
__________________________________________________________
Volume: 05 Issue: 03 | Mar-2016, Available @
Fig -16: Vowel Recognition dataset's mean ROC under
MKL
4. RESULTS COMPARISON & METHOD
SELECTION
this part is aimed to present the data in an analogous form so
one method or more could be selected to be used in
classifying remote sensing data. To achieve this goal
histograms have been made for the results obtained from all
the previous steps, the following charts represent those
results' histograms.
Chart -1: Accuracies using 70% as training data before
setting the parameters
Chart -2: Accuracies using 60% as training data before
setting the parameters
0
0.2
0.4
0.6
0.8
1
1.2
0
0.2
0.4
0.6
0.8
1
1.2
IJRET: International Journal of Research in Engineering and Technology eISSN: 2319
_______________________________________________________________________________________
, Available @ http://www.ijret.org
: Vowel Recognition dataset's mean ROC under
4. RESULTS COMPARISON & METHOD
analogous form so
one method or more could be selected to be used in
classifying remote sensing data. To achieve this goal
histograms have been made for the results obtained from all
the previous steps, the following charts represent those
using 70% as training data before
0% as training data before
Chart -3: Final Test Accuracies after setting
Chart -3: Final Test AUC
Theoretically MKL method supposed to achieve better
results than single kernel method, but practically saying in
some few cases a single kernel technique could overcome
MKL and the reason for that is because some dat
a specific nature of features, those require
that may not be applicable in the case of MKL.
It is obvious from the histograms that in most cases,
polynomial kernel could deliver reasonable results,
especially when MKL failed to match single kernel
performance, so in the next step of using MKL in remote
sensing, both MKL from suggested kernels an
Kernel with normalization as single Kernel are used.
5. MKL & POLYNOMIAL KERNEL FOR
REMOTE SENSING
This part shows the results of using
of the proposed kernels and Polynomial kernel on the data
set that had been chosen for remote sensing
set information and specification
previously in this paper with all needed details.
Figures 17 and 18 present the results obtained from
parameters in this paper and figure 19
extraction of the paper in reference [2
results during scale parameters are shown.
Linear
Kernel
Polynomial
Kernel
Gaussian
Kernel
Sigmoid
Kernel
MKL
Linear
Kernel
Polynomial
Kernel
Gaussian
Kernel
Sigmoid
Kernel
MKL
0.00%
20.00%
40.00%
60.00%
80.00%
100.00%
120.00%
0
0.2
0.4
0.6
0.8
1
1.2
eISSN: 2319-1163 | pISSN: 2321-7308
_____________________________
363
Final Test Accuracies after setting the parameters
Test AUCs after setting the parameters
Theoretically MKL method supposed to achieve better
results than single kernel method, but practically saying in
some few cases a single kernel technique could overcome
MKL and the reason for that is because some data sets have
, those require special treatment
that may not be applicable in the case of MKL.
It is obvious from the histograms that in most cases,
polynomial kernel could deliver reasonable results,
especially when MKL failed to match single kernel
next step of using MKL in remote
sensing, both MKL from suggested kernels and Polynomial
Kernel with normalization as single Kernel are used.
5. MKL & POLYNOMIAL KERNEL FOR
This part shows the results of using un-weighted summation
of the proposed kernels and Polynomial kernel on the data
or remote sensing task, this data
specifications were mentioned
previously in this paper with all needed details.
the results obtained from scale
parameters in this paper and figure 19 provides an
of the paper in reference [22], where the paper's
results during scale parameters are shown.
Linear
Kernel
Polynomial
Kernel
Gaussian
Kernel
Sigmoid
Kernel
MKL
Linear
Kernel
Polynomial
Kernel
Gaussian
Kernel
Sigmoid
Kernel
MKL
14. IJRET: International Journal of Research in Engineering and Technology
__________________________________________________________
Volume: 05 Issue: 03 | Mar-2016, Available @
Fig -17: Cross Validation best accuracy obtained during
Scale of MKL parameters (Tuning)
Fig -19: Best An extraction from reference
From results depicted by the previous figures it is so clear
that the polynomial kernel could obtain th
Final results of testing data are as follows; MKL accuracy
79.35% for c = 3, d = 4, γ = 0.1, a = 0.01
polynomial kernel accuracy 84.29% for c = 2
6. CONCLUSIONS
1. Classification performance or accuracy obtained through
any classifier, does not depend only on the classification
technique or algorithm. There are many other Factors
could affect the classification, like features' transparency
IJRET: International Journal of Research in Engineering and Technology eISSN: 2319
_______________________________________________________________________________________
, Available @ http://www.ijret.org
est accuracy obtained during the
(Tuning) Fig -18: Cross Validation best accuracy obtained during
Scale of Polynomial
An extraction from reference [22] to show its scale of parameters (Tuning)
From results depicted by the previous figures it is so clear
the polynomial kernel could obtain the best results.
testing data are as follows; MKL accuracy
01 & = 2 ;
2 & = 2.
Classification performance or accuracy obtained through
any classifier, does not depend only on the classification
technique or algorithm. There are many other Factors
could affect the classification, like features' transparency
that reveals the difference
aim that any classification technique need
not to obtain 100% accuracy but to obtain the maximum
possible accuracy out of given data. To enhance the data
transparency of revealing classes other techniques
beyond this research scope are used.
2. There is a difference between a theoretical expected
outcome of an algorithm and the practical outcome,
since those two may not match because of computational
issues related to the practical application of the
algorithm, like what happens in optimization or data
segmentation.
eISSN: 2319-1163 | pISSN: 2321-7308
_____________________________
364
est accuracy obtained during the
of Polynomial parameters (Tuning)
(Tuning) results
that reveals the differences between their classes. So the
aim that any classification technique needs to achieve is
not to obtain 100% accuracy but to obtain the maximum
possible accuracy out of given data. To enhance the data
transparency of revealing classes other techniques
nd this research scope are used.
here is a difference between a theoretical expected
outcome of an algorithm and the practical outcome,
since those two may not match because of computational
issues related to the practical application of the
like what happens in optimization or data
15. IJRET: International Journal of Research in Engineering and Technology eISSN: 2319-1163 | pISSN: 2321-7308
_______________________________________________________________________________________
Volume: 05 Issue: 03 | Mar-2016, Available @ http://www.ijret.org 365
3. It is found that many methods may achieve the
maximum possible accuracy, so it would be a good
approach to compare their computational efficiency due
to time and computational resources needed to achieve
the classification.
4. When dealing the four kernels used in this paper the best
option is to combine them and also try polynomial kernel
alone, in case of combination fail to achieve the
maximum accuracy or performance.
5. Normalization technique usage does not always make a
better results specially with the linear kernel, but it is
still needed to reduce the computation load and speed the
optimization process.
6. For beginners in machine learning or when MKL is not
needed, we advice using toolboxes other than shogun for
the lack of tutorials and difficulties through the setup
process.
ACKNOWLEDGEMENT
The authors want to thank professor Andrew Yan-Tak Ng
for his prolific contributions in the field of teaching
machine learning courses, Python Programming language
open society for their generous contributions to help others
and all those contributed data sets to help others to practice
and learn.
REFERENCES
[1]. Fritzke, Bernd. Growing Cell Structures: A Self-
Organizing Network for Unsupervised and Supervised
Learning. Berkeley. International Computer Science
Institute, 1993. 7-1441-1460.
[2]. Hamel, Lutz. Knowledge Discovery with Support
Vector Machines. Hoboken: Wiley, 2009.
10.1002/9780470503065.ch7.
[3]. Vapnik, Vladimir N. Direct Methods in Statistical
Learning Theory. The Nature of Statistical Learning Theory
(2000): 225-265.
[4]. Bishop, Christopher M, ed. Pattern Recognition and
Machine Learning. New York: Springer, 2006. 978-0-387-
31073-2.
[5]. Deng, Weiping. A Study on Lane-Change Recognition
Using Support Vector Machine. N.p., 2013. Print.
[6]. Shigeo Abe. Advanced in Pattern Recognition – Support
Vector Machines for Pattern Classification 2nd
Edition.
Springer-Verlag London Limited, 2010.978-1-84996-098-4.
[7]. Perner, Petra, ed. Machine Learning and Data Mining in
Pattern Recognition. 6th International Conference, Mldm
2009, Leipzig, Germany, July 23-25, 2009 : Proceedings.
Berlin: Springer, 2009. 978-3-540-73499-4.
[8]. A. Rakotomamonjy. Analysis of SVM regression
bounds for variable ranking. Perception, Systemes et
Informations CNRS FRE 2645 INSA de Rouen. Avenue de
l’Universit´e . 76801 Saint Etienne du Rouvray, France
[9]. Vapnik, Vladimir N. The Nature of Statistical Learning
Theory. New York: Springer, 2000. 978-1-4419-3160-3
[10]. John C. Platt. Sequential Minimal Optimization: A
Fast Algorithm for Training Support Vector Machines. 1998,
MIT Press.
[11]. Kumar, M. A., and M. Gopal. An Investigation on
Linear SVM and Its Variants for Text Categorization. 2010.
doi:10.1109/ICMLC.2010.64.
[12]. Lange, Kenneth. Optimization . (2004): 69-91. 978-1-
4757-4182-7.
[13]. "Radial Basis Function Kernel." Wikipedia, the Free
Encyclopedia. Wikimedia Foundation, Inc, n.d.Web.
https://en.wikipedia.org/wiki/Radial_basis_function_kernel.
[14]. Fernandes, Silas E., Andre L. Pilastri, Luis A. Pereira,
Rafael G. Pires, and Joao P. Papa. Learning Kernels for
Support Vector Machines with Polynomial Powers of
Sigmoid. 2014 27th SIBGRAPI Conference on Graphics,
Patterns and Images (2014): n. pag. Print.
[15]. Hsuan-Tien, Lin, Chih-Jen Lin. A Study on Sigmoid
Kernels for SVM and the Training of non-PSD Kernels by
SMO-type Methods. Department of Computer Science and
Information Engineering National Taiwan University Taipei
106, Taiwan.
[16]. Mehmet Gonen n, Ethem Alpaydın. Localized
Algorithms for Multiple Kernel Learning. Pattern
Recognition ,2013,46:795–807.
[17]. Alexander Zien, Cheng Soon Ong. Multiclass Multiple
Kernel Learning. 2007 the 24th
international conference on
Machine learning. ACM New York, NY, USA 978-1-
59593-793-3.
[18]. Sören Sonnenburg, Gunnar Rätsch. Large Scale
Multiple Kernel Learning. 12/1/2006. The Journal of
Machine Learning Research archive Volume 7. 1531-1565.
[19]. Morton John Canty. Image Analysis and Pattern
Recognition for Remote Sensing with Algorithms in
ENVI/IDL. 2005, Forschungszentrum Julich GmbH.
[20]. Thomas Lillesand, Ralph W. Kiefer, Jonathan
Chipman. Remote Sensing and Image Interpretation. 17 Mar
2015. wiley. 978-1-118-34328-9.
[21]. James B. Campbell, Randolph H. Wynne .Introduction
to Remote Sensing. 17 Aug 2011. The Guilford Press. 978-
1609181765.
[22]. Johnson, B., Xie, Z., 2013. Classifying a high
resolution image of an urban area using super-object
information. ISPRS Journal of Photogrammetry and Remote
Sensing, 83, 40-49.
[23]. Lichman, M. UCI Machine Learning Repository
[http://archive.ics.uci.edu/ml]. Irvine, CA: University of
California, School of Information and Computer Science.
2013.
[24]. "Institute for Global Environmental Strategies
(IGES)." 公益財団法人地球環境戦略研究機関(IGES:
アイジェス). N.p., n.d. Web. http://www.iges.or.jp/en/.
[25]. Johnson, B., 2013. High resolution urban land cover
classification using a competitive multi-scale object-based
approach. Remote Sensing Letters, 4 (2), 131-140.
[26]. Scikit-learn: Machine Learning in Python, Pedregosa
et al., JMLR 12, pp. 2825-2830, 2011.
[27]. "How to Evaluate Machine Learning Models:
Classification Metrics." Dato's Data Science Blog | Dato.
N.p., n.d. Web. http://blog.dato.com/how-to-evaluate-
machine-learning-models-part-2a-classification-metrics
[28]. Metz, Charles E. Basic principles of ROC analysis.
Seminars in Nuclear Medicine8.4 (1978): 283-298.
16. IJRET: International Journal of Research in Engineering and Technology
__________________________________________________________
Volume: 05 Issue: 03 | Mar-2016, Available @
[29]. Beazley, David M. Python Essential Reference.
Indianapolis: Sams, 2006. Print.
[30]. Raschka, Sebastian. Python Machine Learning: Unlock
Deeper Insights into Machine Learning with Thi
Guide to Cutting-Edge Predictive Analytics. N.p.,
1783555130.
[31]. The SHOGUN Machine Learning Toolbox. N.p., n.d.
Web. http://www.shogun-toolbox.org/.
[32]. "MKL (SVM) Segmentation Fault on Ubuntu 12.04 •
Issue #1720 • Shogun-toolbox/shogun • GitHub." GitHub.
N.p., n.d. Web. https://github.com/shogun
toolbox/shogun/issues/1720.
[33]. Marius Kloft, Ulf Brefeld, Soeren Sonnenburg, and
Alexander Zien. Efficient and accurate lp
kernel learning. In Advances in Neural In
Processing Systems. 2009.MIT Press, Cambridge, MA
BIOGRAPHIES
Li Jun, received the Bachelor degree from
Lanzhou Railway Institute, Lanzhou,
China, in 1991. The master degree from
Department of Telecommunications in
Lanzhou Railway Institute, in 1999. In
2006 the Electrical Engineering PhD
degree from Xi'an Jiaotong Univers
Xian, China. Right now a full time professor in Lanzhou
Jiaotong University, Lanzhou, China.
Yassein Eltayeb, received the Bachelor
degree in Computer Engineering from
Omdurman Ahlia University, Khartoum,
Sudan, in 2009. Admitted as Teaching
Assistant in Omdurman Ahlia University
in 2011. Currently pursuing master degree
in Pattern Recognition & Intelligent
Systems in Lanzhou Jiaotong University, Lanzhou China .
IJRET: International Journal of Research in Engineering and Technology eISSN: 2319
_______________________________________________________________________________________
, Available @ http://www.ijret.org
Python Essential Reference.
Python Machine Learning: Unlock
Deeper Insights into Machine Learning with This Vital
Edge Predictive Analytics. N.p., 2015.
SHOGUN Machine Learning Toolbox. N.p., n.d.
[32]. "MKL (SVM) Segmentation Fault on Ubuntu 12.04 •
• GitHub." GitHub.
N.p., n.d. Web. https://github.com/shogun-
[33]. Marius Kloft, Ulf Brefeld, Soeren Sonnenburg, and
Alexander Zien. Efficient and accurate lp-norm multiple
kernel learning. In Advances in Neural Information
. 2009.MIT Press, Cambridge, MA.
received the Bachelor degree from
Lanzhou Railway Institute, Lanzhou,
China, in 1991. The master degree from
Department of Telecommunications in
Lanzhou Railway Institute, in 1999. In
2006 the Electrical Engineering PhD
degree from Xi'an Jiaotong University,
Xian, China. Right now a full time professor in Lanzhou
received the Bachelor
degree in Computer Engineering from
Omdurman Ahlia University, Khartoum,
Sudan, in 2009. Admitted as Teaching
nt in Omdurman Ahlia University
in 2011. Currently pursuing master degree
in Pattern Recognition & Intelligent
rsity, Lanzhou China .
eISSN: 2319-1163 | pISSN: 2321-7308
_____________________________
366