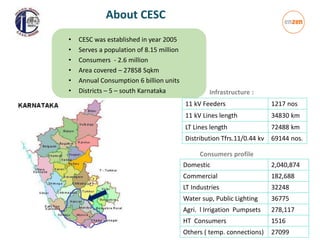
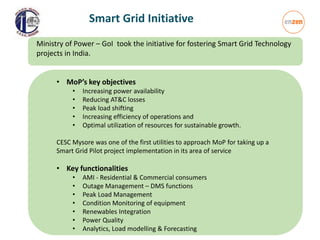
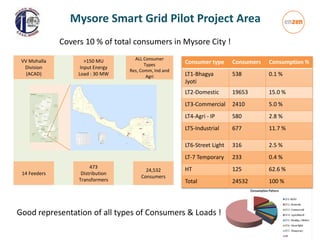
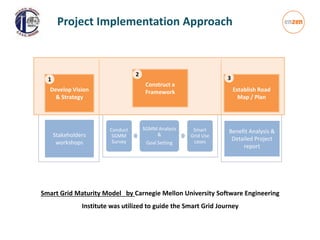
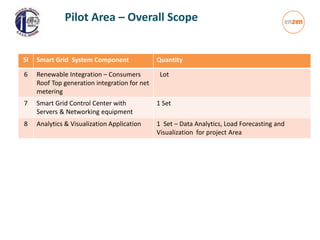
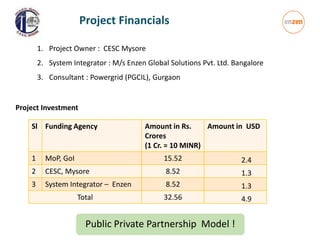
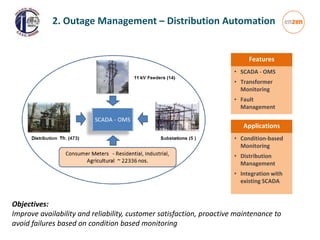
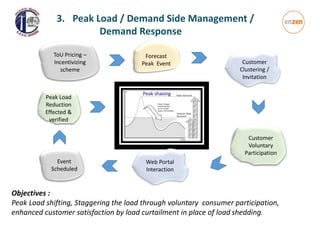
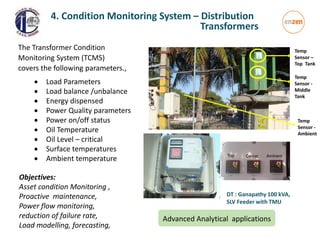
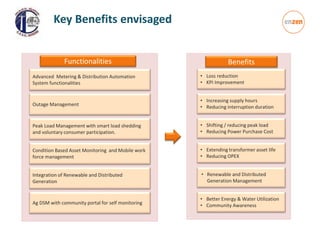
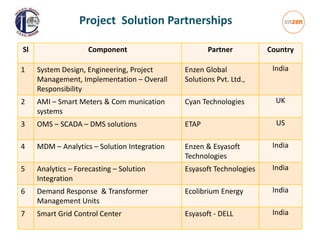
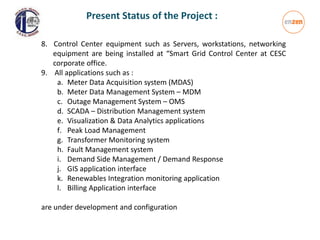
1. Mysore Smart Grid Pilot Project
CESC Mysore
Welcomes Delegates
of
ISGW - 2015
2. About CESC
• CESC was established in year 2005
• Serves a population of 8.15 million
• Consumers - 2.6 million
• Area covered – 27858 Sqkm
• Annual Consumption 6 billion units
• Districts – 5 – south Karnataka Infrastructure :
11 kV Feeders 1217 nos
11 kV Lines length 34830 km
LT Lines length 72488 km
Distribution Tfrs.11/0.44 kv 69144 nos.
Domestic 2,040,874
Commercial 182,688
LT Industries 32248
Water sup, Public Lighting 36775
Agri. l Irrigation Pumpsets 278,117
HT Consumers 1516
Others ( temp. connections) 27099
Consumers profile
3. The Mission of Chamundeshwari Electricity supply corporation Ltd., is
to ensure reliable quality power to its customers at competitive prices.
The CESC Mysore is dedicated to achieve these objectives through
Creative in managing its operation and maintenance
Empowerment of its staff by constant Upgradation of Technical competence
and Developing Human resource capabilities and delegates power
Adopting new technologies and practices that are sustainable
Transparent and accountability in Administration to improve the credibility.
Mission
4. What is Smart Grid?
…. integration of two infrastructures …
6. Smart Grid Initiative
• MoP’s key objectives
• Increasing power availability
• Reducing AT&C losses
• Peak load shifting
• Increasing efficiency of operations and
• Optimal utilization of resources for sustainable growth.
CESC Mysore was one of the first utilities to approach MoP for taking up a
Smart Grid Pilot project implementation in its area of service
• Key functionalities
• AMI - Residential & Commercial consumers
• Outage Management – DMS functions
• Peak Load Management
• Condition Monitoring of equipment
• Renewables Integration
• Power Quality
• Analytics, Load modelling & Forecasting
Ministry of Power – GoI took the initiative for fostering Smart Grid Technology
projects in India.
7. Mysore Smart Grid Pilot Project Area
14 Feeders
473
Distribution
Transformers
24,532
Consumers
VV Mohalla
Division
(ACAD)
>150 MU
Input Energy
Load : 30 MW
ALL Consumer
Types
Res, Comm, Ind and
Agri
Consumer type Consumers Consumption %
LT1-Bhagya
Jyoti
538 0.1 %
LT2-Domestic 19653 15.0 %
LT3-Commercial 2410 5.0 %
LT4-Agri - IP 580 2.8 %
LT5-Industrial 677 11.7 %
LT6-Street Light 316 2.5 %
LT-7 Temporary 233 0.4 %
HT 125 62.6 %
Total 24532 100 %
Good representation of all types of Consumers & Loads !
Covers 10 % of total consumers in Mysore City !
8. Project Implementation Approach
Smart Grid Maturity Model by Carnegie Mellon University Software Engineering
Institute was utilized to guide the Smart Grid Journey
Develop Vision
& Strategy
Stakeholders
workshops
Conduct
SGMM
Survey
SGMM Analysis
&
Goal Setting
Smart
Grid Use
cases
Construct a
Framework Establish Road
Map / Plan
Benefit Analysis &
Detailed Project
report
1
2
3
9. 9
Sl Smart Grid System Component Quantity
1 Smart Meter system – Automated
Metering Infrastructure (AMI) :
(Smart Meters, Data Concentrator
Units, Modems etc.,)
19487 – Single Phase Meters
2337 - Three Ph. Meters (Industrial Agri IP sets)
150 HT - Customers (Modems for existing meters)
1 Set - Meter Data Acquisition Software
1 Set - Meter Data Management Software
1 Set – Analytics and Visualization Software
2 SCADA , OMS (Outage Management),
FMS (Fault Management) with Fault
Passage Indicators (FPI) for Project
Area Feeders : Hardware and Software
1 Set - covering 14 nos HT Feeders in Project Area
3 Transformer Monitoring System (TMS)
– Hardware and Software
473 DTs Spread in Project Area for monitoring
Condition of DTs
4 Peak Load Management, Demand Side
Management – Demand Response
Application Software
1 set - DSM / DR for Industrial Consumers
5 Consumer Portal, DSM / DR Portal,
Employee portal
1 set - Portals for Consumer Interaction
Pilot Area – Overall Scope
10. Sl Smart Grid System Component Quantity
6 Renewable Integration – Consumers
Roof Top generation integration for net
metering
Lot
7 Smart Grid Control Center with
Servers & Networking equipment
1 Set
8 Analytics & Visualization Application 1 Set – Data Analytics, Load Forecasting and
Visualization for project Area
Pilot Area – Overall Scope
11. Project Financials
1. Project Owner : CESC Mysore
2. System Integrator : M/s Enzen Global Solutions Pvt. Ltd. Bangalore
3. Consultant : Powergrid (PGCIL), Gurgaon
Sl Funding Agency Amount in Rs.
Crores
(1 Cr. = 10 MINR)
Amount in USD
1 MoP, GoI 15.52 2.4
2 CESC, Mysore 8.52 1.3
3 System Integrator – Enzen 8.52 1.3
Total 32.56 4.9
Project Investment
Public Private Partnership Model !
12. 12
AMI scope includes Smart Meters capable of two way
communication capability built in along with other
features listed below
Remote meter reading
Remote connect /disconnect capabilities
Outage detection and management
Tamper detection with disconnection
Time of Use tariff
Prepaid / Credit metering mode with
‘over the air’ change provision
Real-time load monitoring, load
curtailment beyond sanctioned limit
Energy Audit & signaling for Load control
Two way messaging - consumption and
pricing information to consumers
Net metering feature for Roof-top solar
energy integration with the grid
Meter Data Acquisition and Management
System
1. Advanced Metering Infrastructure (AMI) – Residential,
Industrial & Commercial consumers
Key Components
• Energy Accounting
• Demand side
Management
• AgDSM
• Outage
Monitoring
Applications
13. 2. Outage Management – Distribution Automation
• SCADA - OMS
• Transformer
Monitoring
• Fault
Management
• Condition-based
Monitoring
• Distribution
Management
• Integration with
existing SCADA
Features
Applications
Objectives:
Improve availability and reliability, customer satisfaction, proactive maintenance to
avoid failures based on condition based monitoring
14. Forecast
Peak Event Customer
Clustering /
Invitation
ToU Pricing –
Incentivizing
scheme
Customer
Voluntary
Participation
Event
Scheduled
Peak Load
Reduction
Effected &
verified
Peak shaving
Web Portal
Interaction
3. Peak Load / Demand Side Management /
Demand Response
Objectives :
Peak Load shifting, Staggering the load through voluntary consumer participation,
enhanced customer satisfaction by load curtailment in place of load shedding.
15. 4. Condition Monitoring System – Distribution
Transformers
The Transformer Condition
Monitoring System (TCMS)
covers the following parameters.,
Load Parameters
Load balance /unbalance
Energy dispensed
Power Quality parameters
Power on/off status
Oil Temperature
Oil Level – critical
Surface temperatures
Ambient temperature
DT : Ganapathy 100 kVA,
SLV Feeder with TMU
Temp
Sensor –
Top Tank
Temp
Sensor -
Middle
Tank
Temp
Sensor -
Ambient
Advanced Analytical applications
Objectives:
Asset condition Monitoring ,
Proactive maintenance,
Power flow monitoring,
reduction of failure rate,
Load modelling, forecasting,
16. • Sensors and FRTUs on 11 kV Feeders
for real-time monitoring of network
health
• Fault Management communicated
through the FRTU to the FMS at the
SGCC
• Fault localization for operations
support
• The WFM application notifies the
Crew to respond to the fault
5. Fault Management/Work Force Management
Objectives :
Quicker fault location identification, faster mobilization of crew and
support, reliability improvement
18. o 512 numbers of agricultural consumers
o Smart meters with inbuilt GPRS modem at DT
o MDM to analyse IP Set consumption
o A consumer interactive portal is deployed
6. Agricultural Demand Side Management
Objective :
Creating community awareness for water & energy conservation
through community portals for energy monitoring
19. 7. Advanced Utility Data Analytics:
Huge amount of Data from Smart Grid devices / equipment
Visualization – Modelling – Analytics scenarios built
Load forecasting
Consumer profiling and consumption pattern analysis
Theft detection
20. Applications Deployed at SGCC
• Meter Data Management System –
MDM
• Outage Management System – OMS
• SCADA – Distribution Management
system
• Visualization & Data Analytics
applications
• Peak Load Management
• Transformer Monitoring system
• Fault Management system
• Demand Side Management / Demand
Response
• GIS application interface
• Renewables Integration monitoring
application
• Billing Application interface
To be located at CESC Corporate office –
new premise
8. Smart Grid Control Centre – SGCC
23. Advanced Metering & Distribution Automation
System functionalities
• Shifting / reducing peak load
• Reducing Power Purchase Cost
• Extending transformer asset life
• Reducing OPEX
• Renewable and Distributed
Generation Management
• Better Energy & Water Utilization
• Community AwarenessAg DSM with community portal for self monitoring
Integration of Renewable and Distributed
Generation
Condition Based Asset Monitoring and Mobile work
force management
Peak Load Management with smart load shedding
and voluntary consumer participation.
Outage Management
• Loss reduction
• KPI Improvement
• Increasing supply hours
• Reducing interruption duration
Functionalities Benefits
Key Benefits envisaged
24. May 2014 Oct 2015
Timelines and Status
Legend Project on track Future Milestones
• Factory Acceptance Tests
• System Integration Tests
• Operational Acceptance Tests
25. Sl Component Partner Country
1 System Design, Engineering, Project
Management, Implementation – Overall
Responsibility
Enzen Global
Solutions Pvt. Ltd.,
India
2 AMI – Smart Meters & Com munication
systems
Cyan Technologies UK
3 OMS – SCADA – DMS solutions ETAP US
4 MDM – Analytics – Solution Integration Enzen & Esyasoft
Technologies
India
5 Analytics – Forecasting – Solution
Integration
Esyasoft Technologies India
6 Demand Response & Transformer
Management Units
Ecolibrium Energy India
7 Smart Grid Control Center Esyasoft - DELL India
Project Solution Partnerships
26. 1. As is study of the existing system including survey of the 11 kV feeder
network complete.
2. Preparation of the detailed designs and documentation for
implementation complete
3. Approval of the Software Application Architecture Design and blueprint.
4. Approval of Hardware design architecture complete
5. Selection and finalization of AMI solution, including Smart Meters &
Communication network solution provider.
6. Transformer Monitoring System demo units installed at site. Sample
Meter units installed at site for data communication and analysis.
7. First lot of 500 smart meters will be installed by end March 2015.
Present Status of the Project :
27. 8. Control Center equipment such as Servers, workstations, networking
equipment are being installed at “Smart Grid Control Center at CESC
corporate office.
9. All applications such as :
a. Meter Data Acquisition system (MDAS)
b. Meter Data Management System – MDM
c. Outage Management System – OMS
d. SCADA – Distribution Management system
e. Visualization & Data Analytics applications
f. Peak Load Management
g. Transformer Monitoring system
h. Fault Management system
i. Demand Side Management / Demand Response
j. GIS application interface
k. Renewables Integration monitoring application
l. Billing Application interface
are under development and configuration
Present Status of the Project :