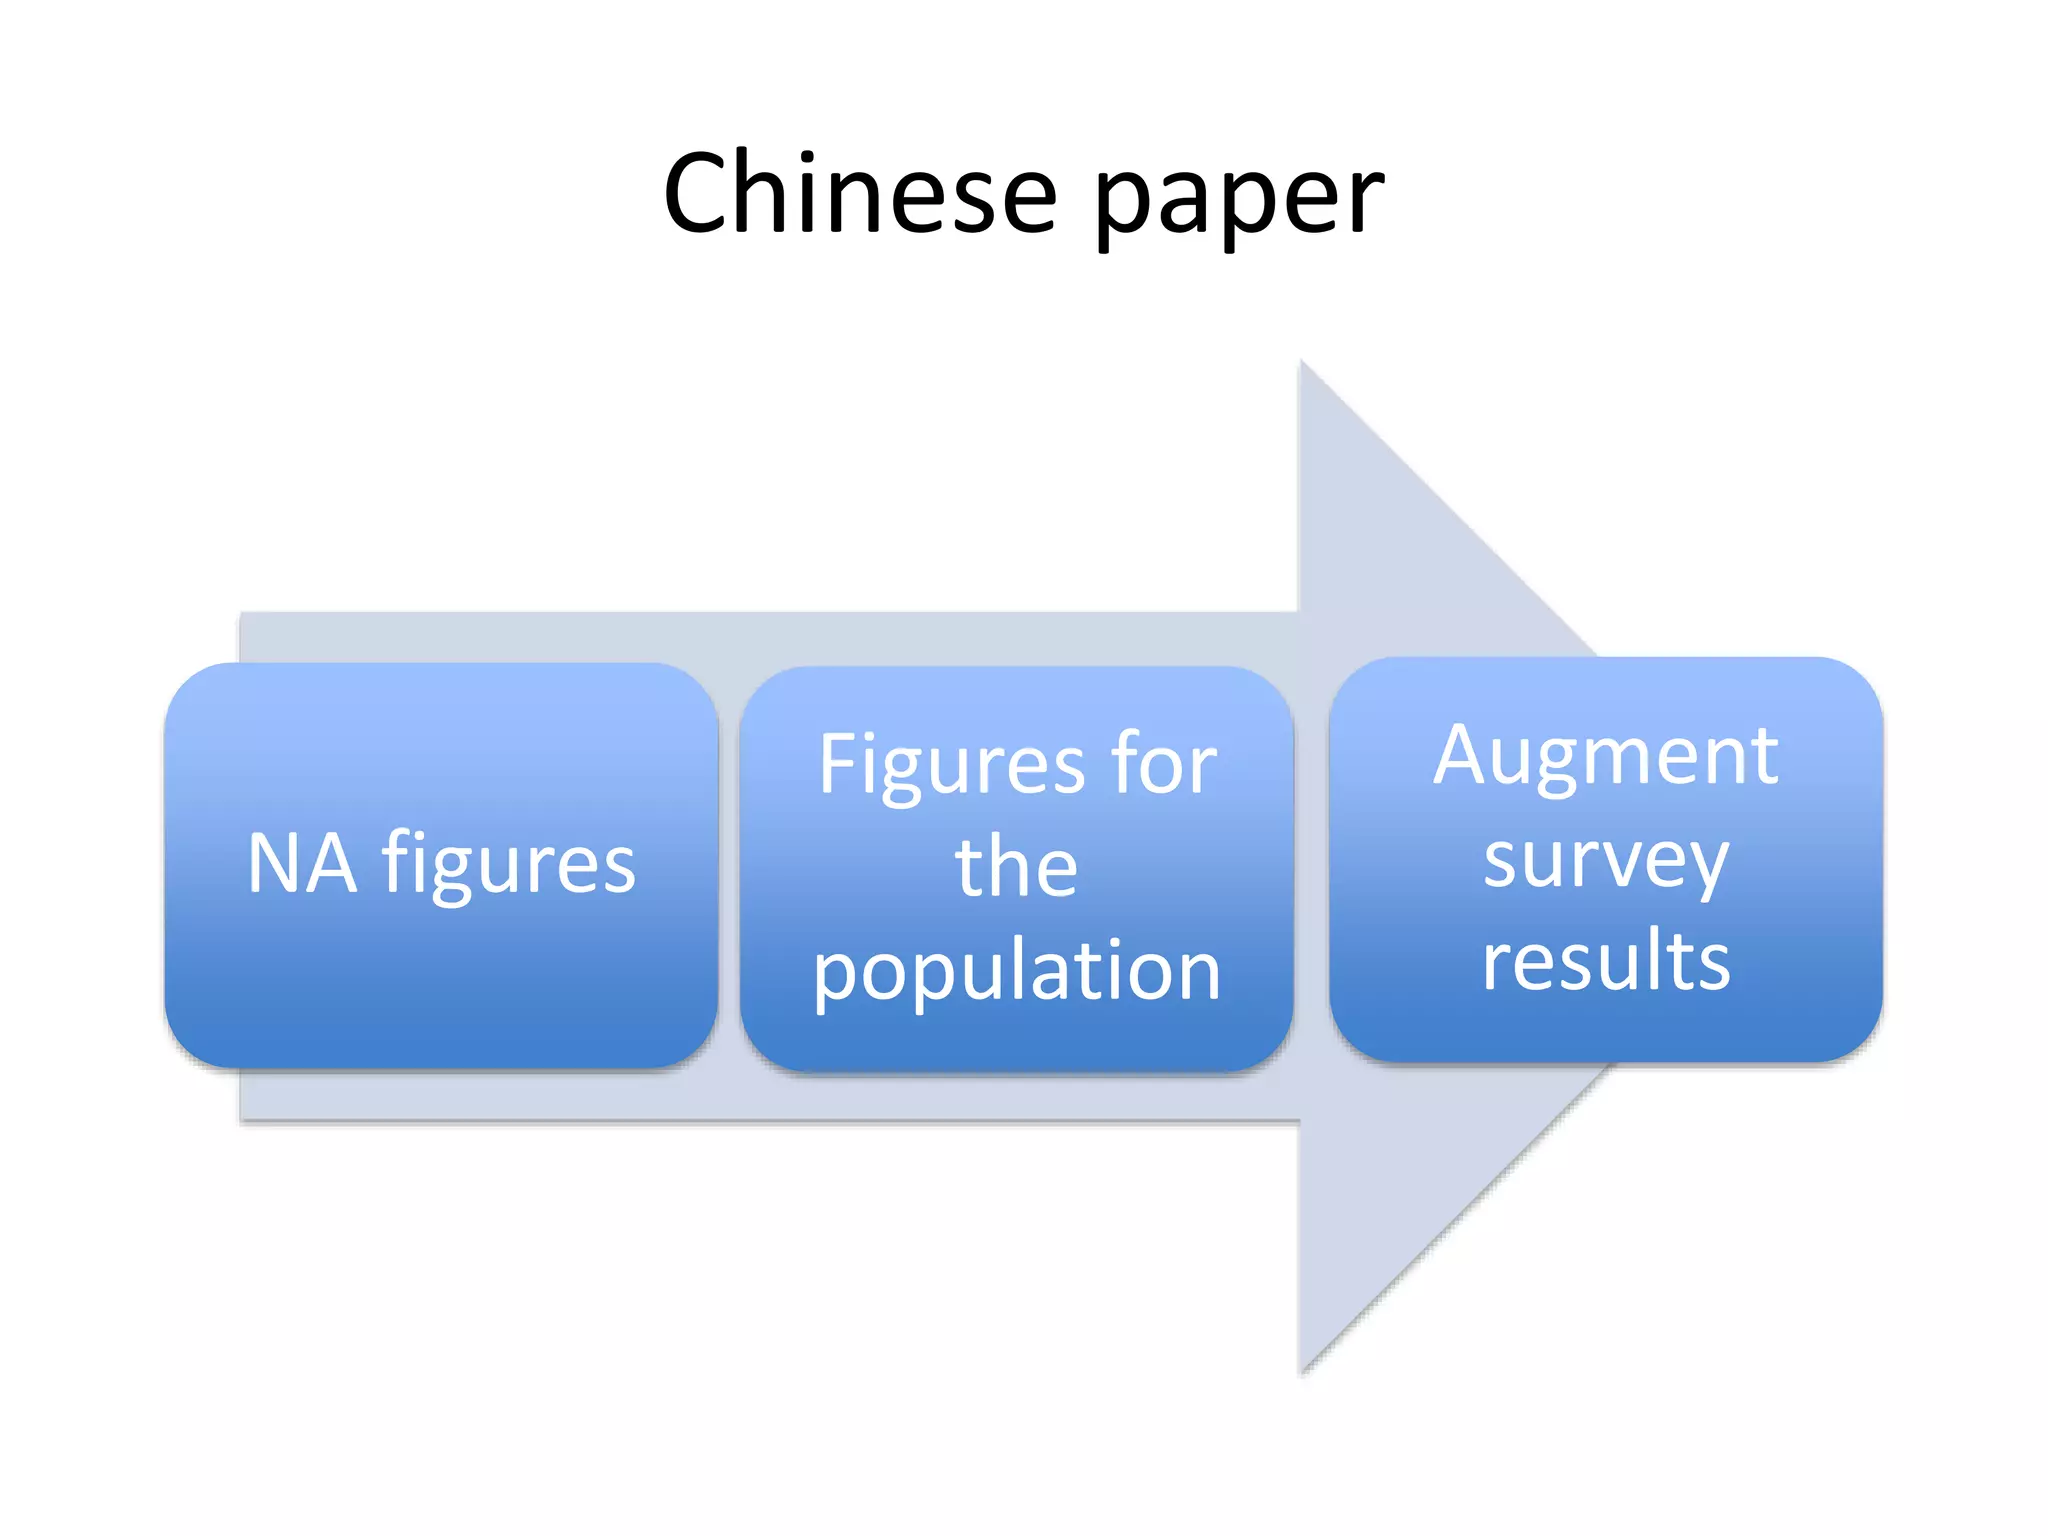
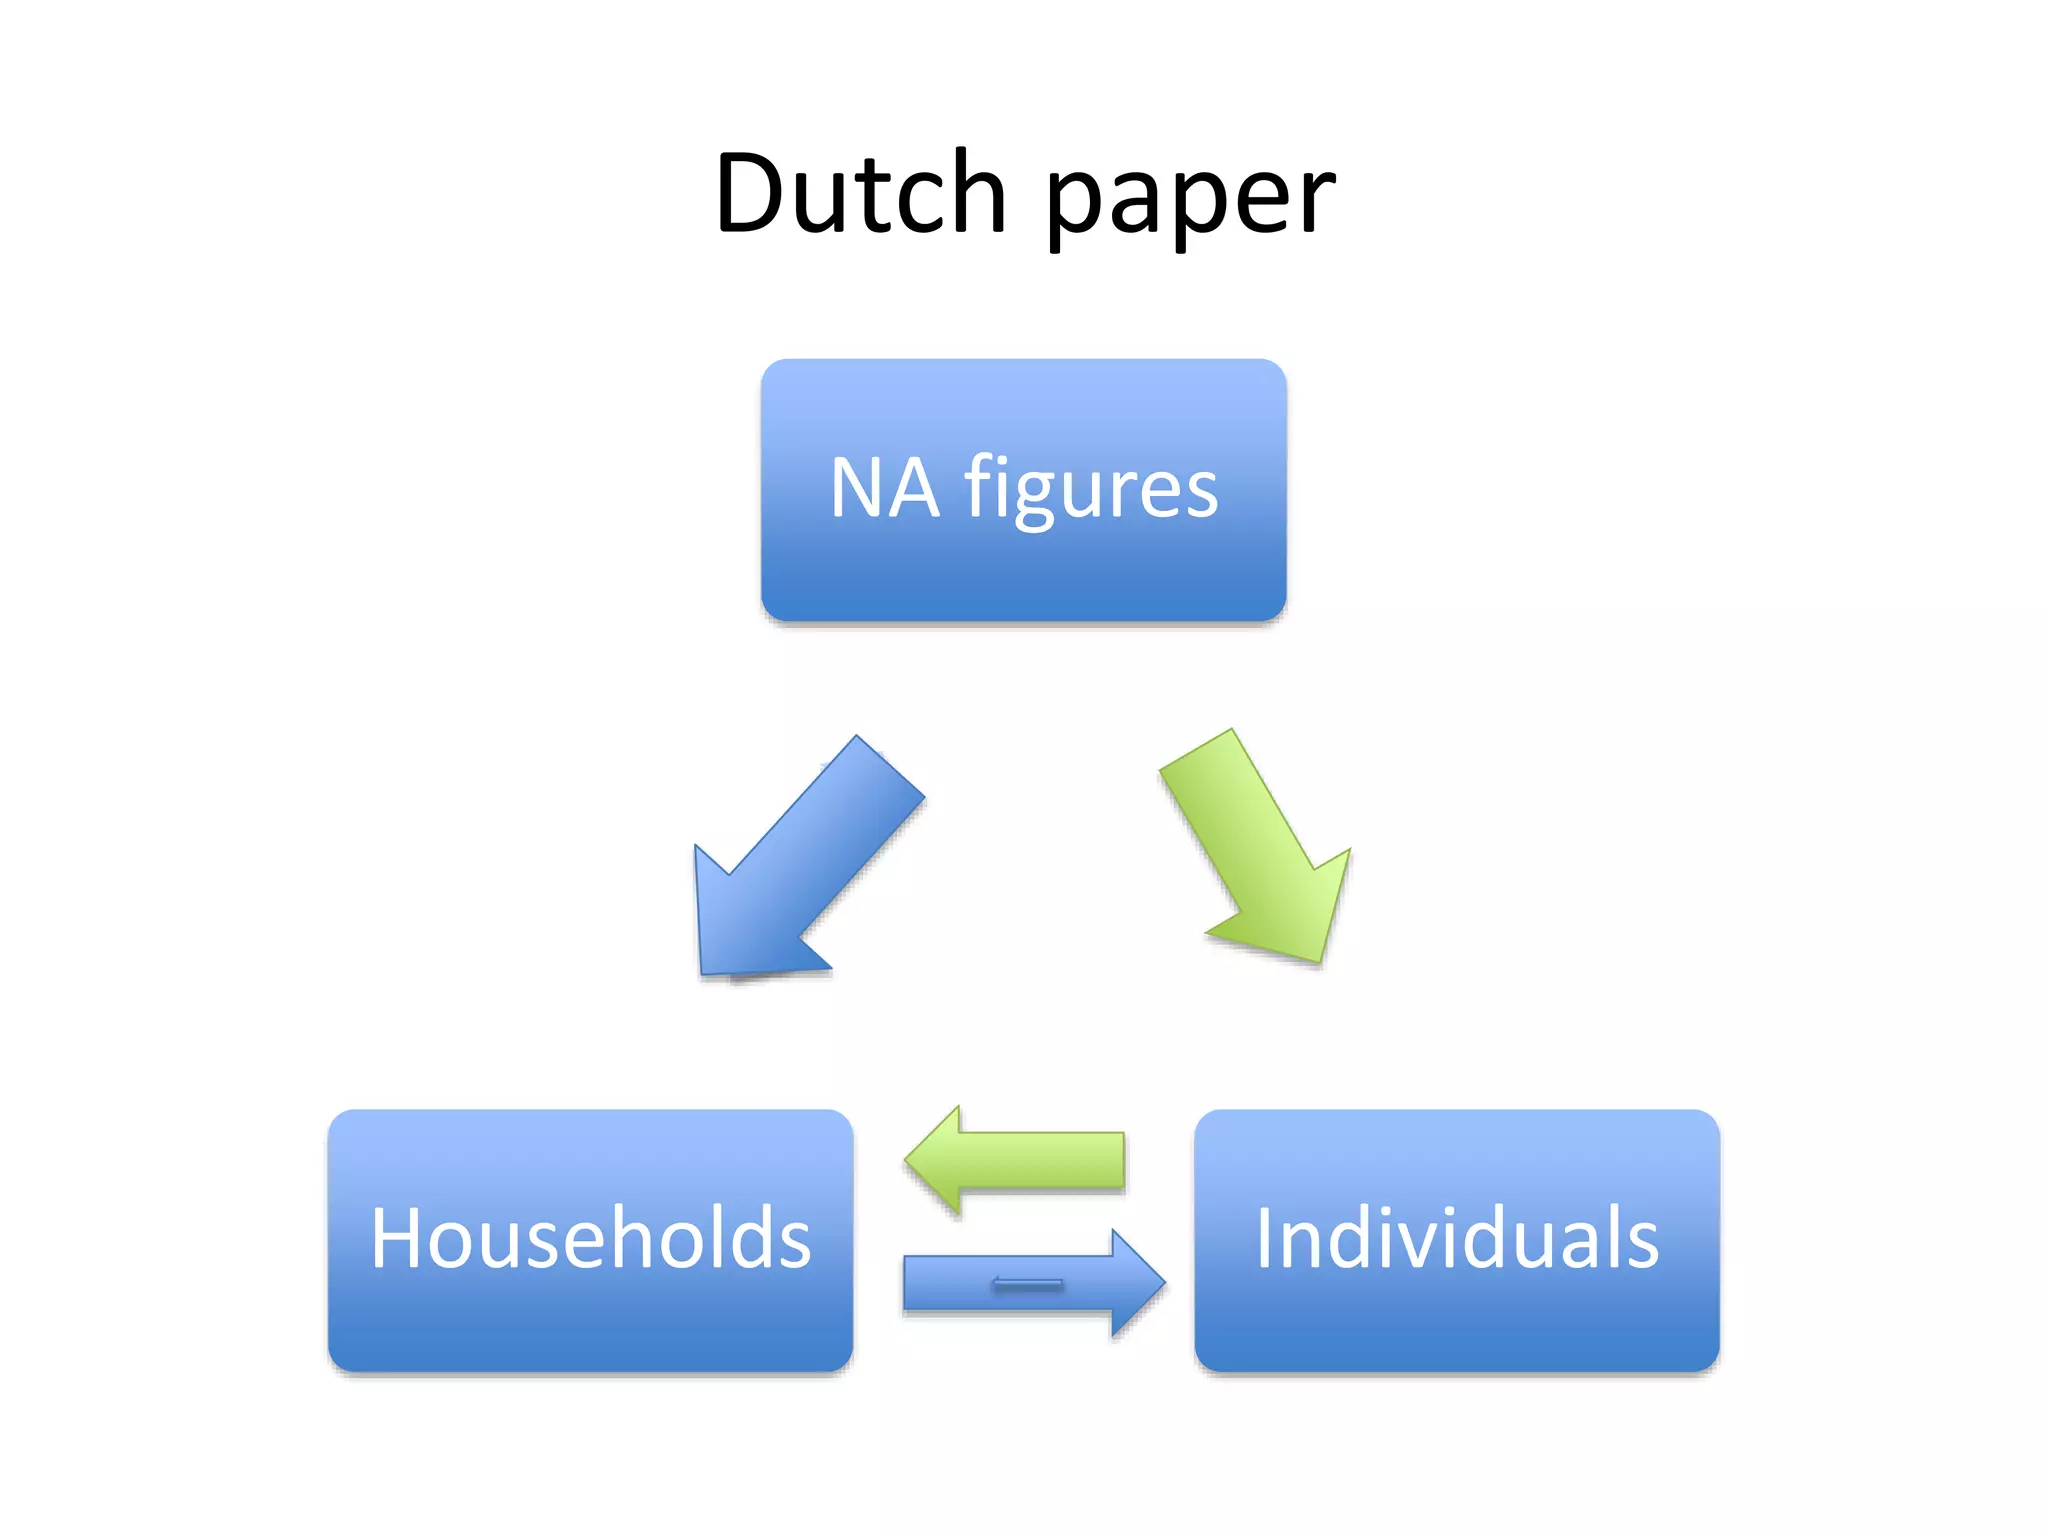
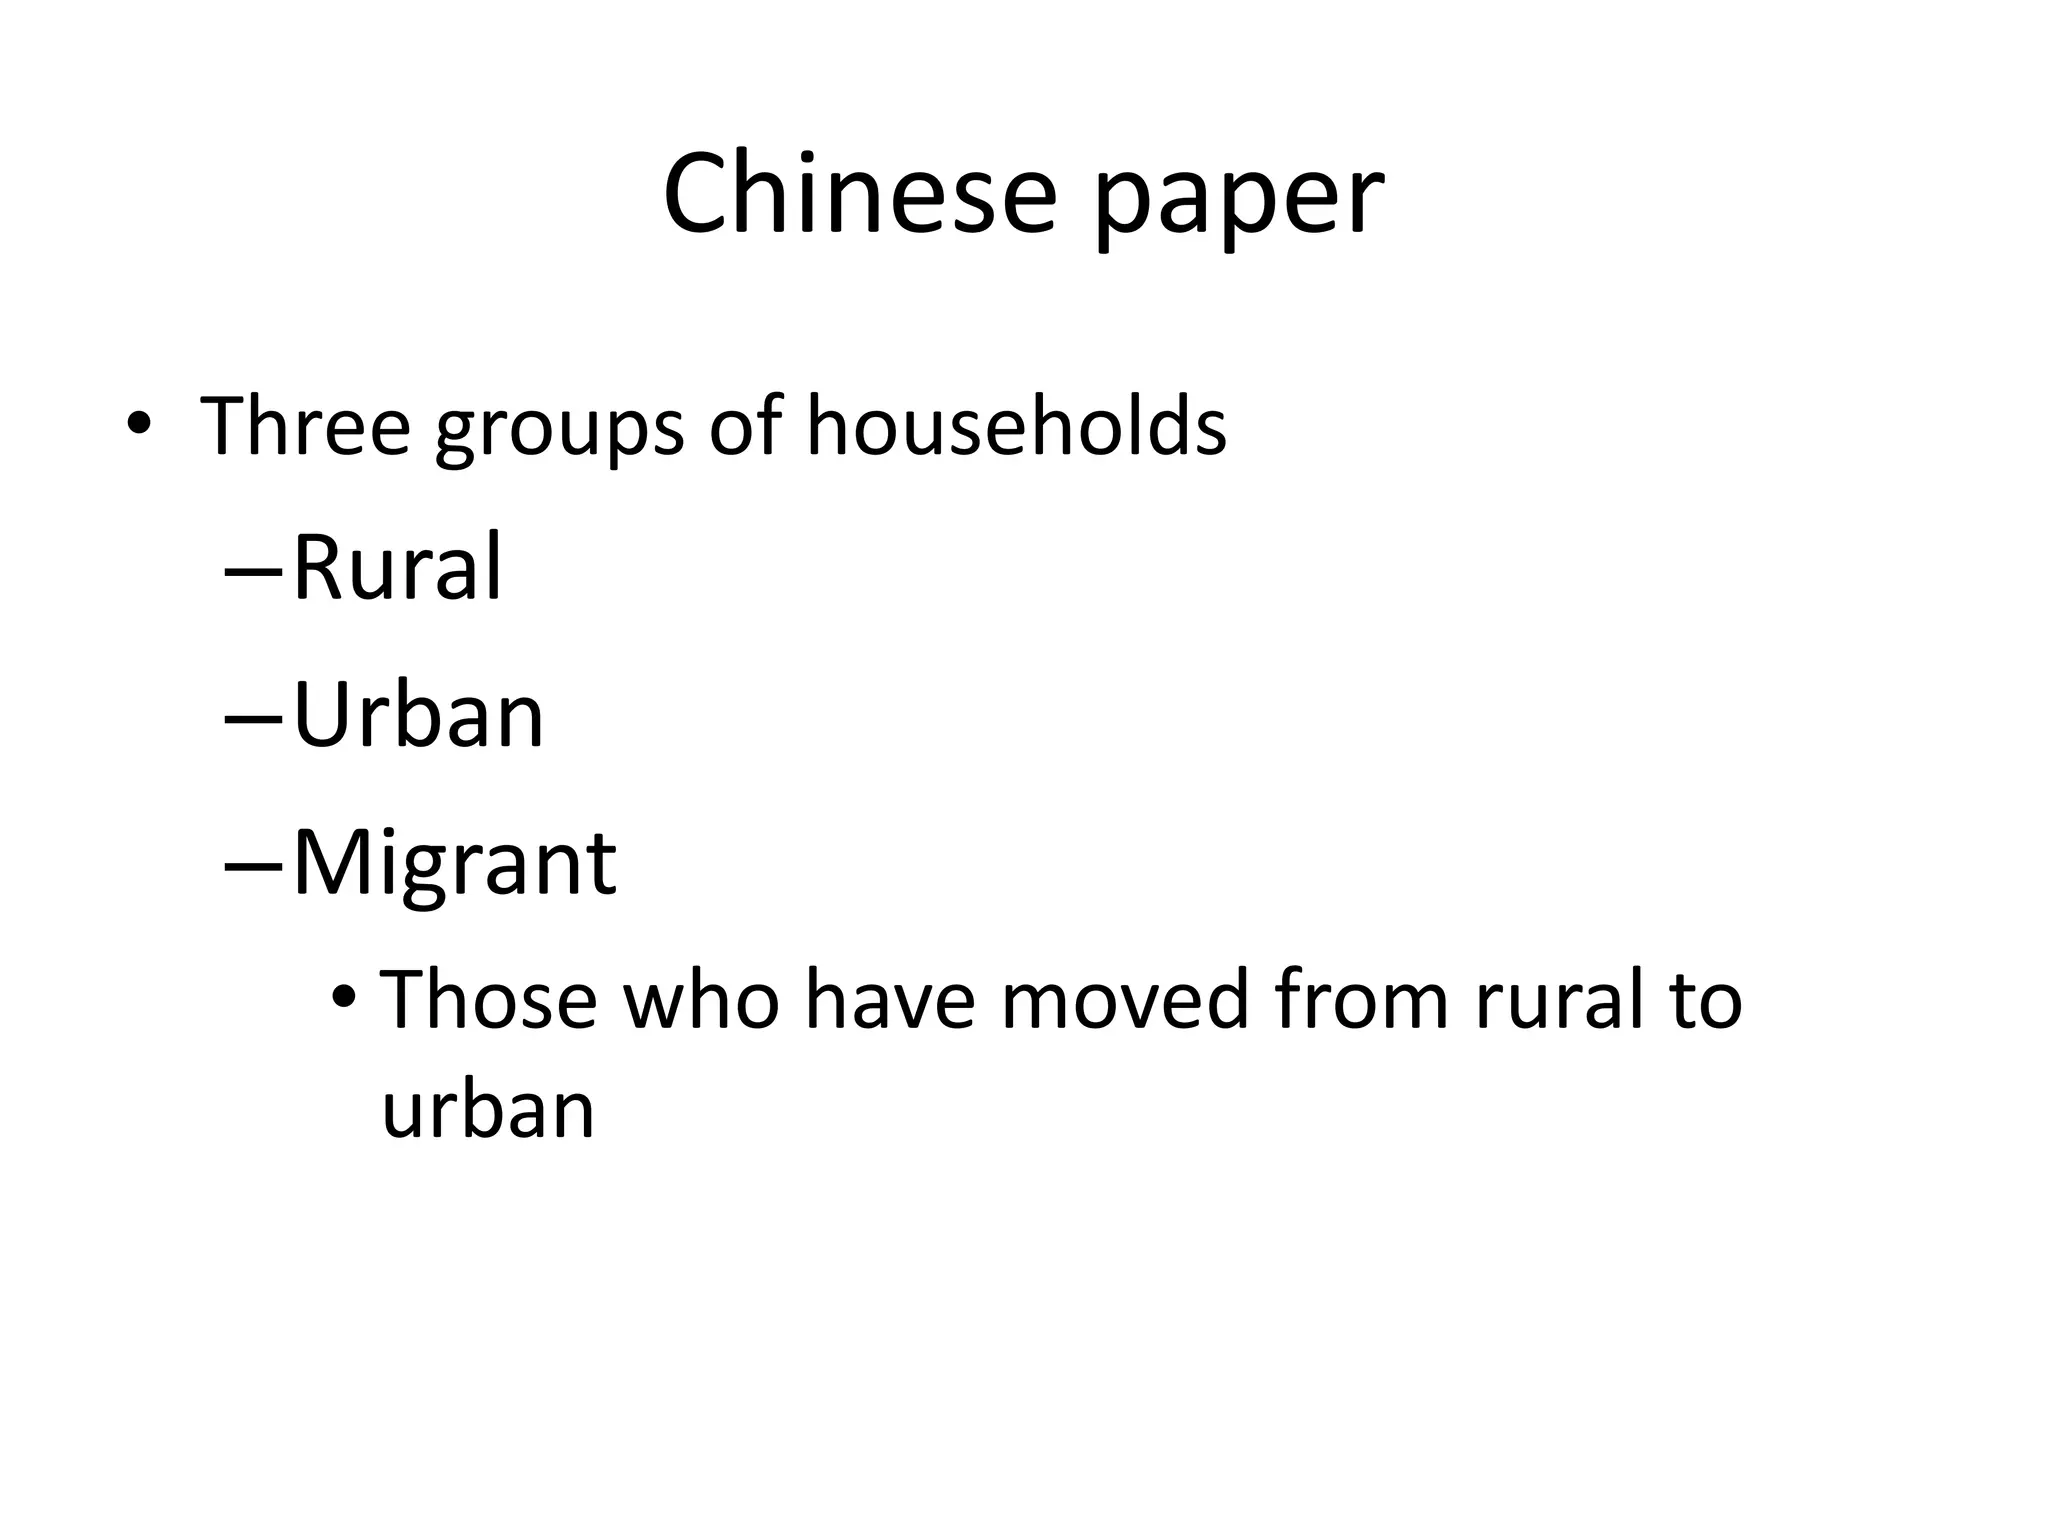
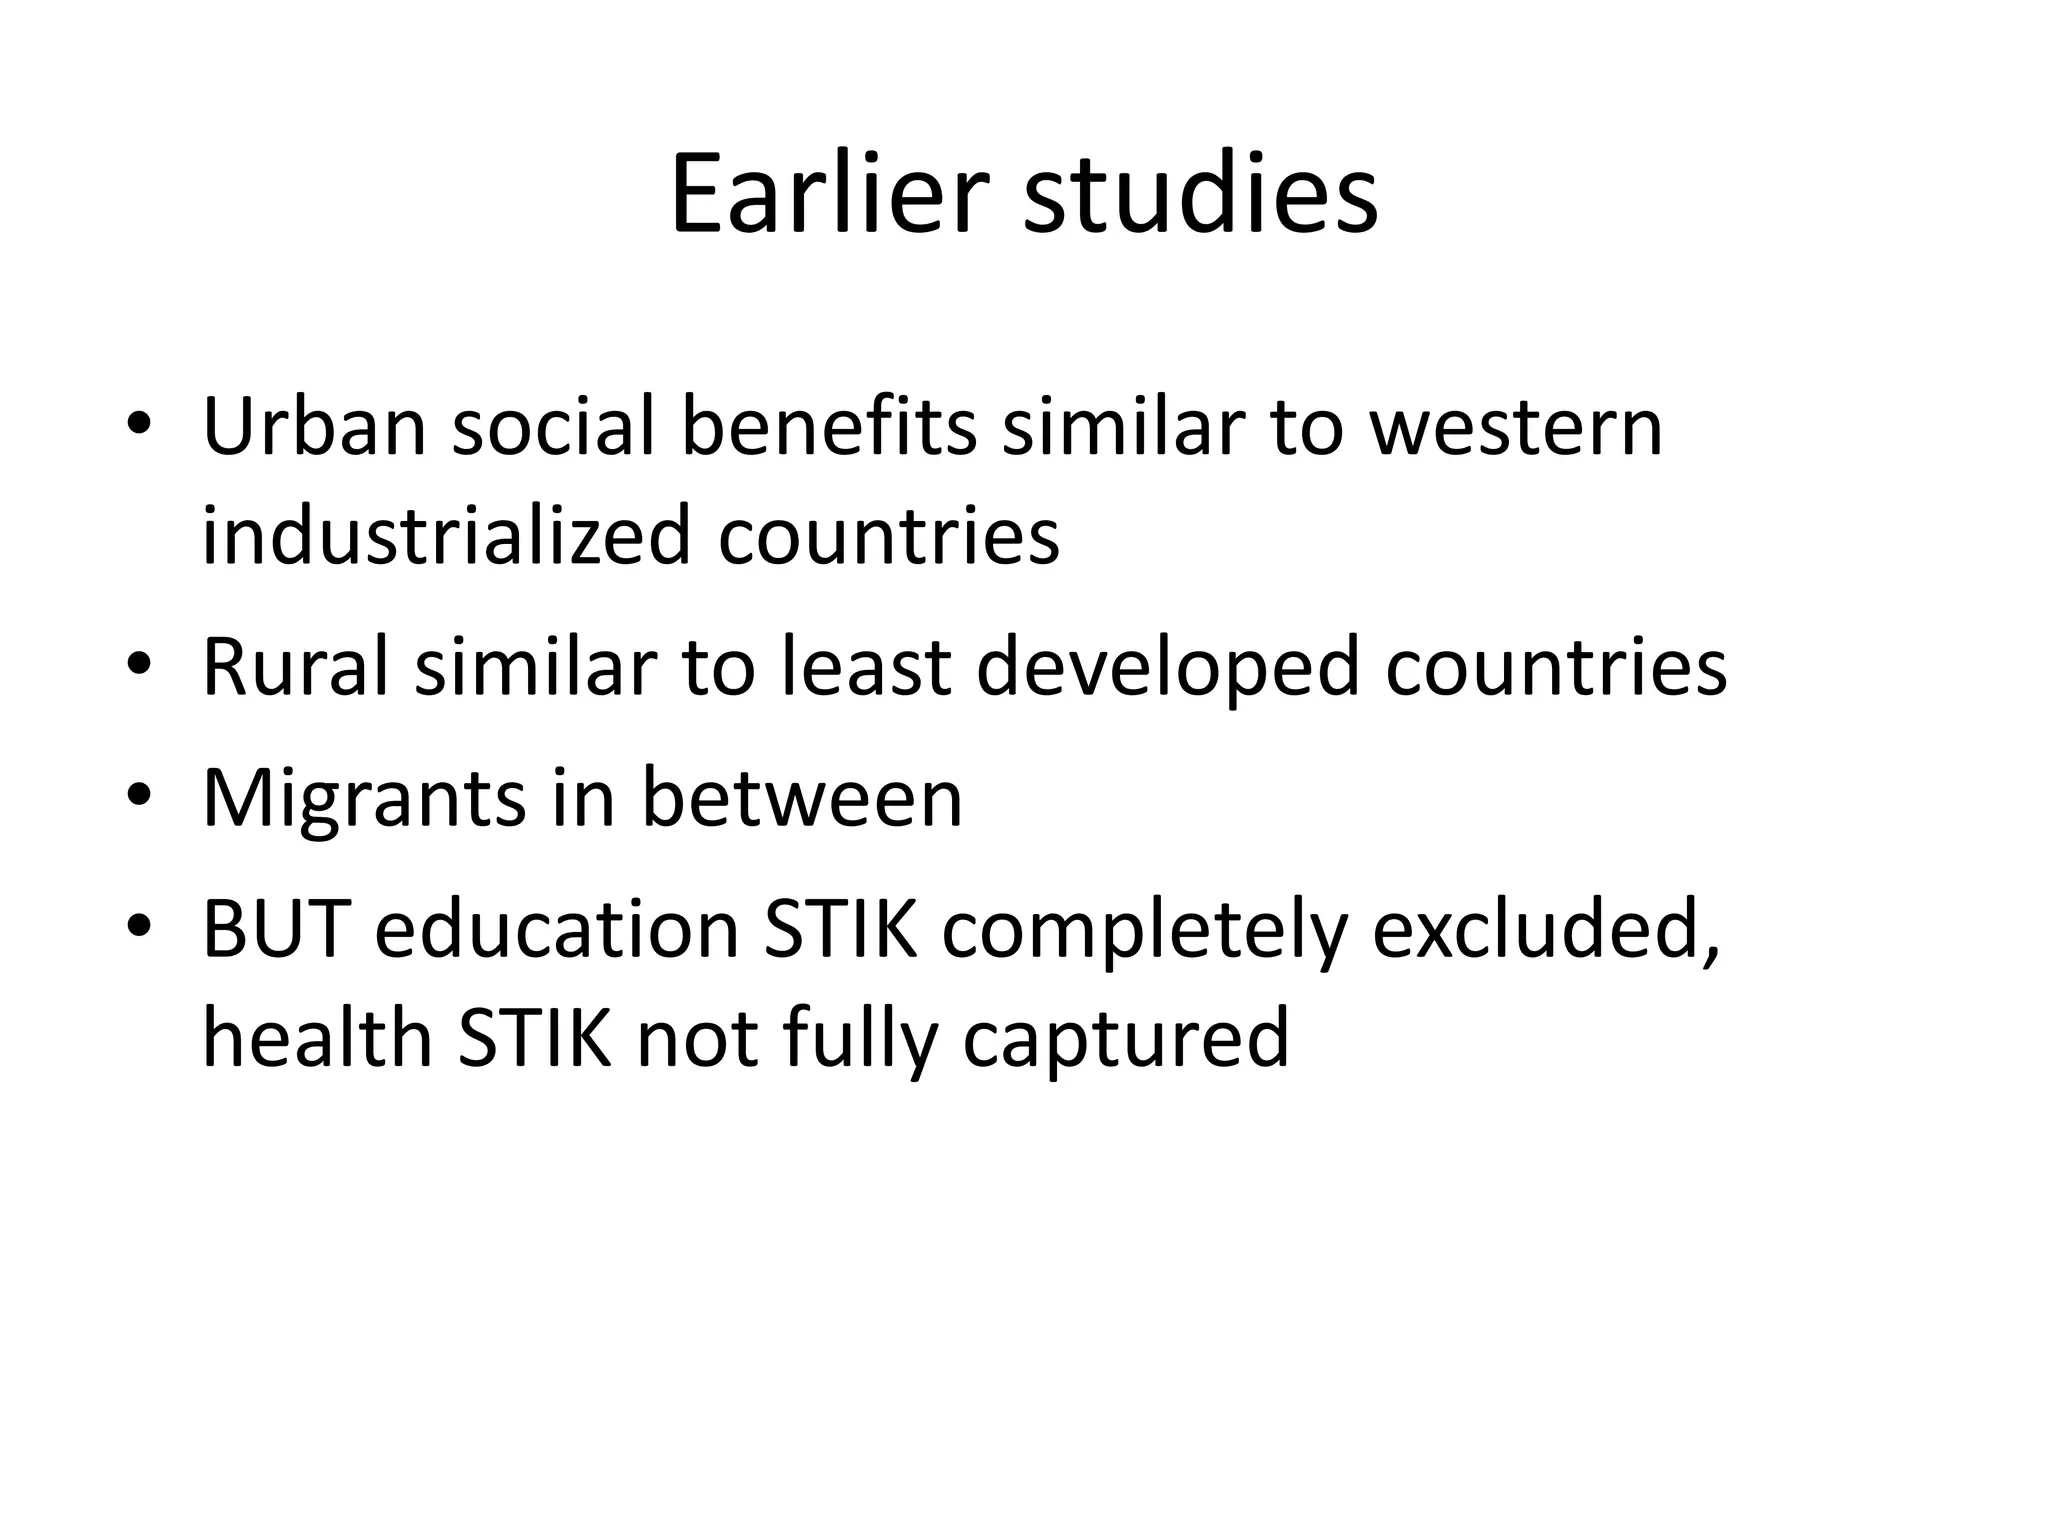
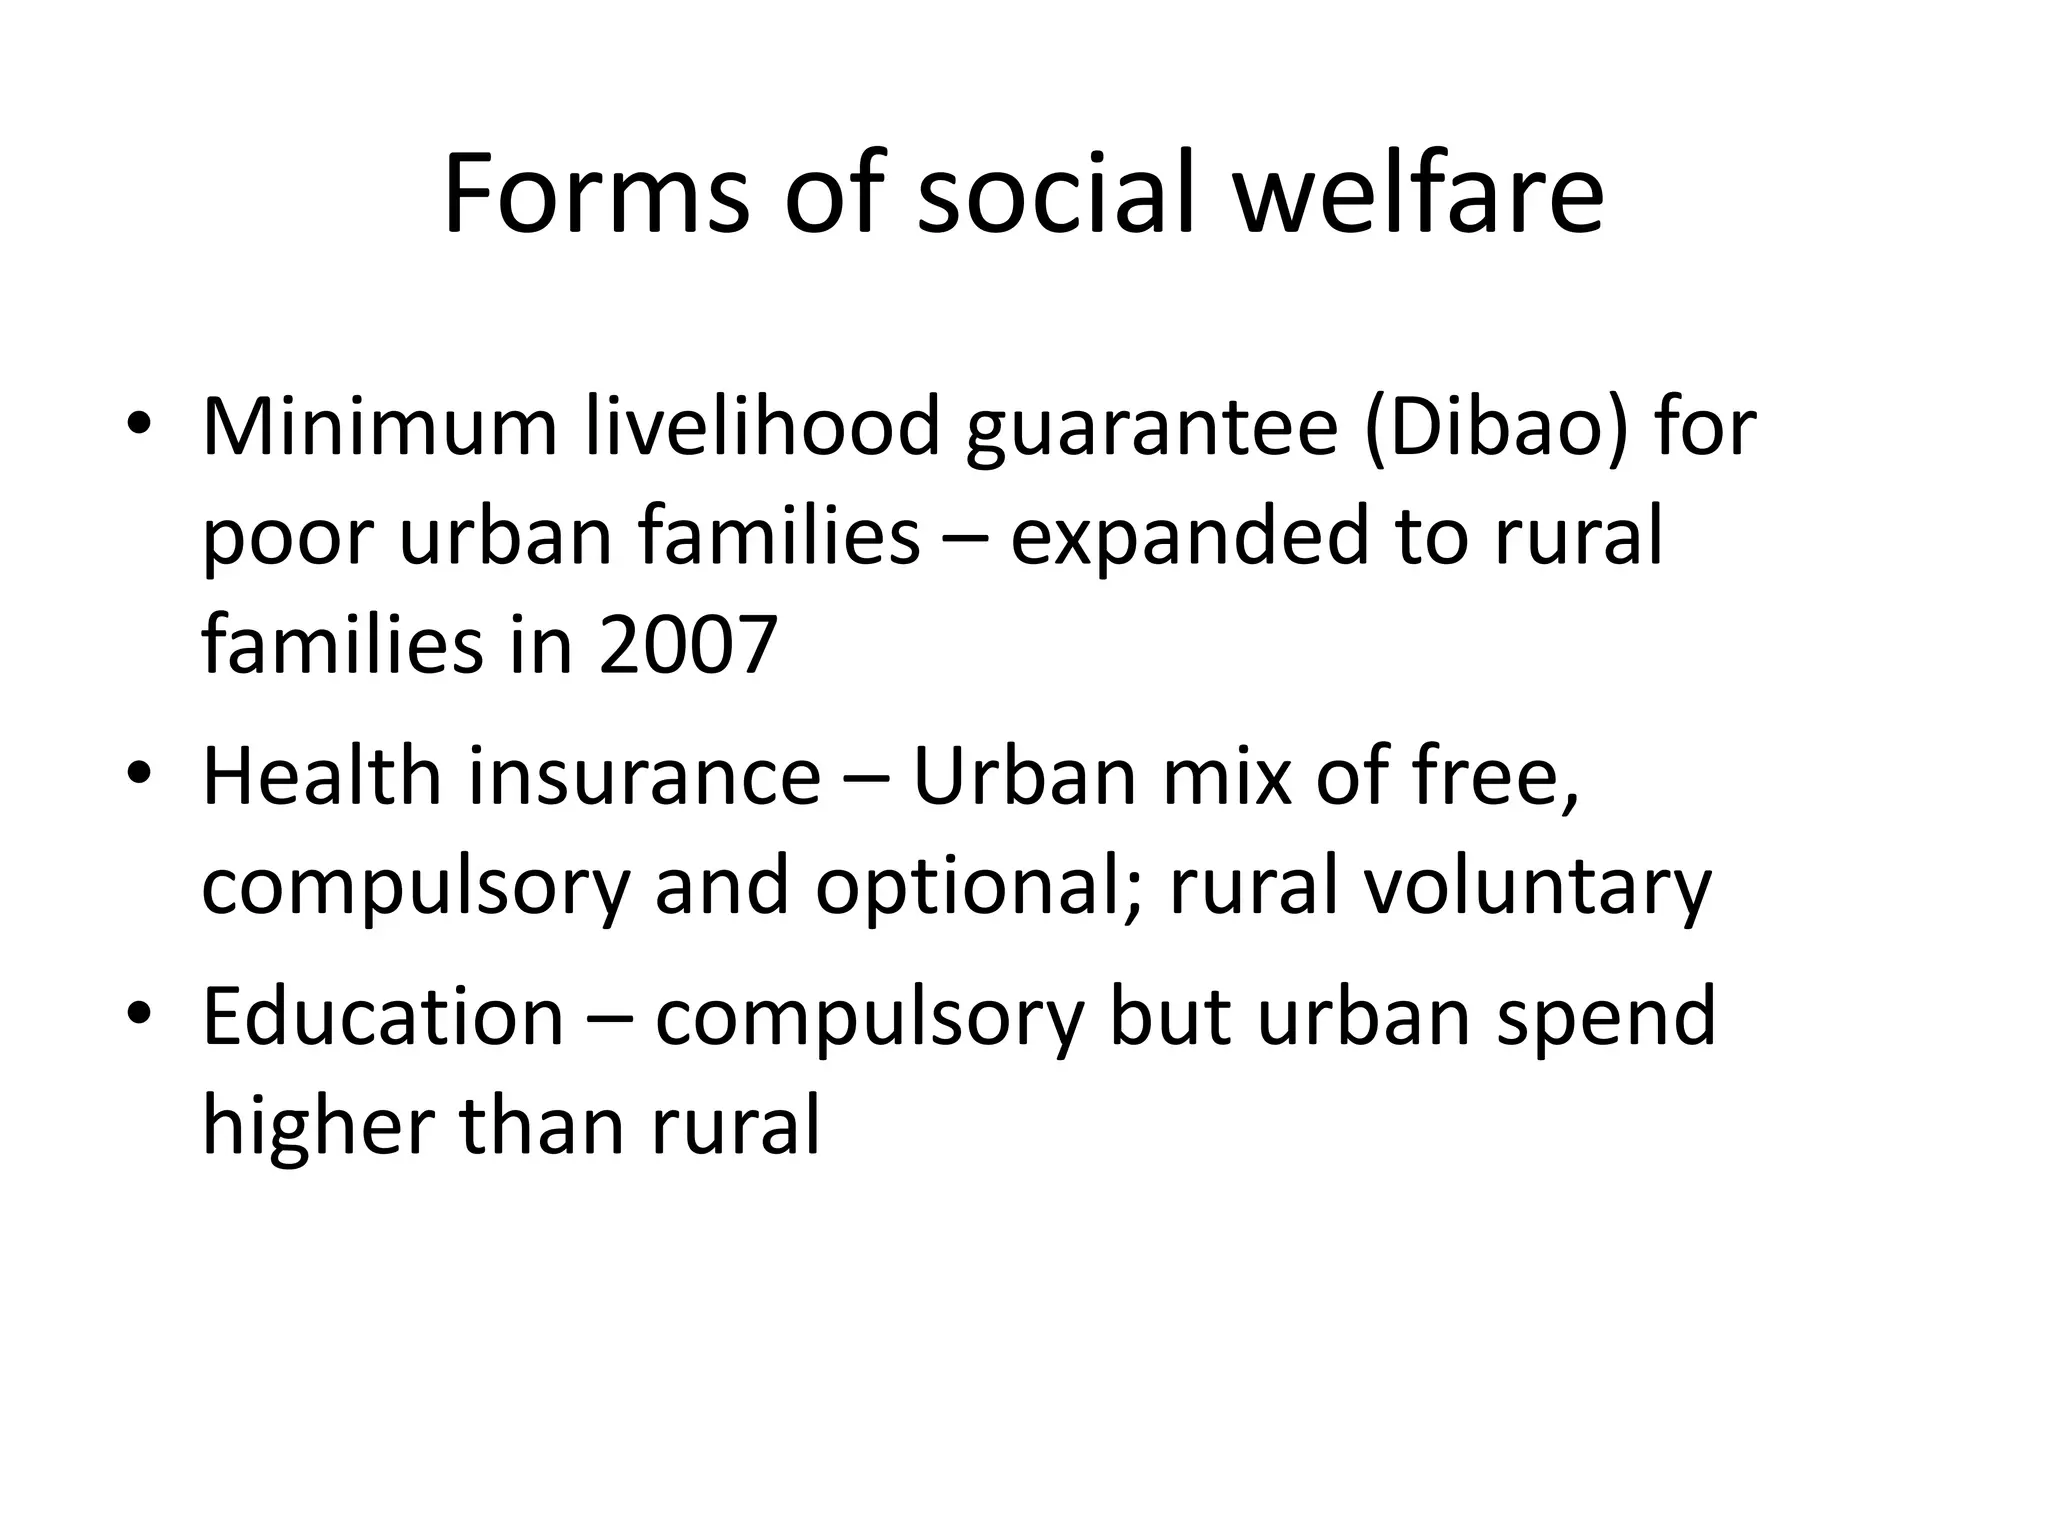
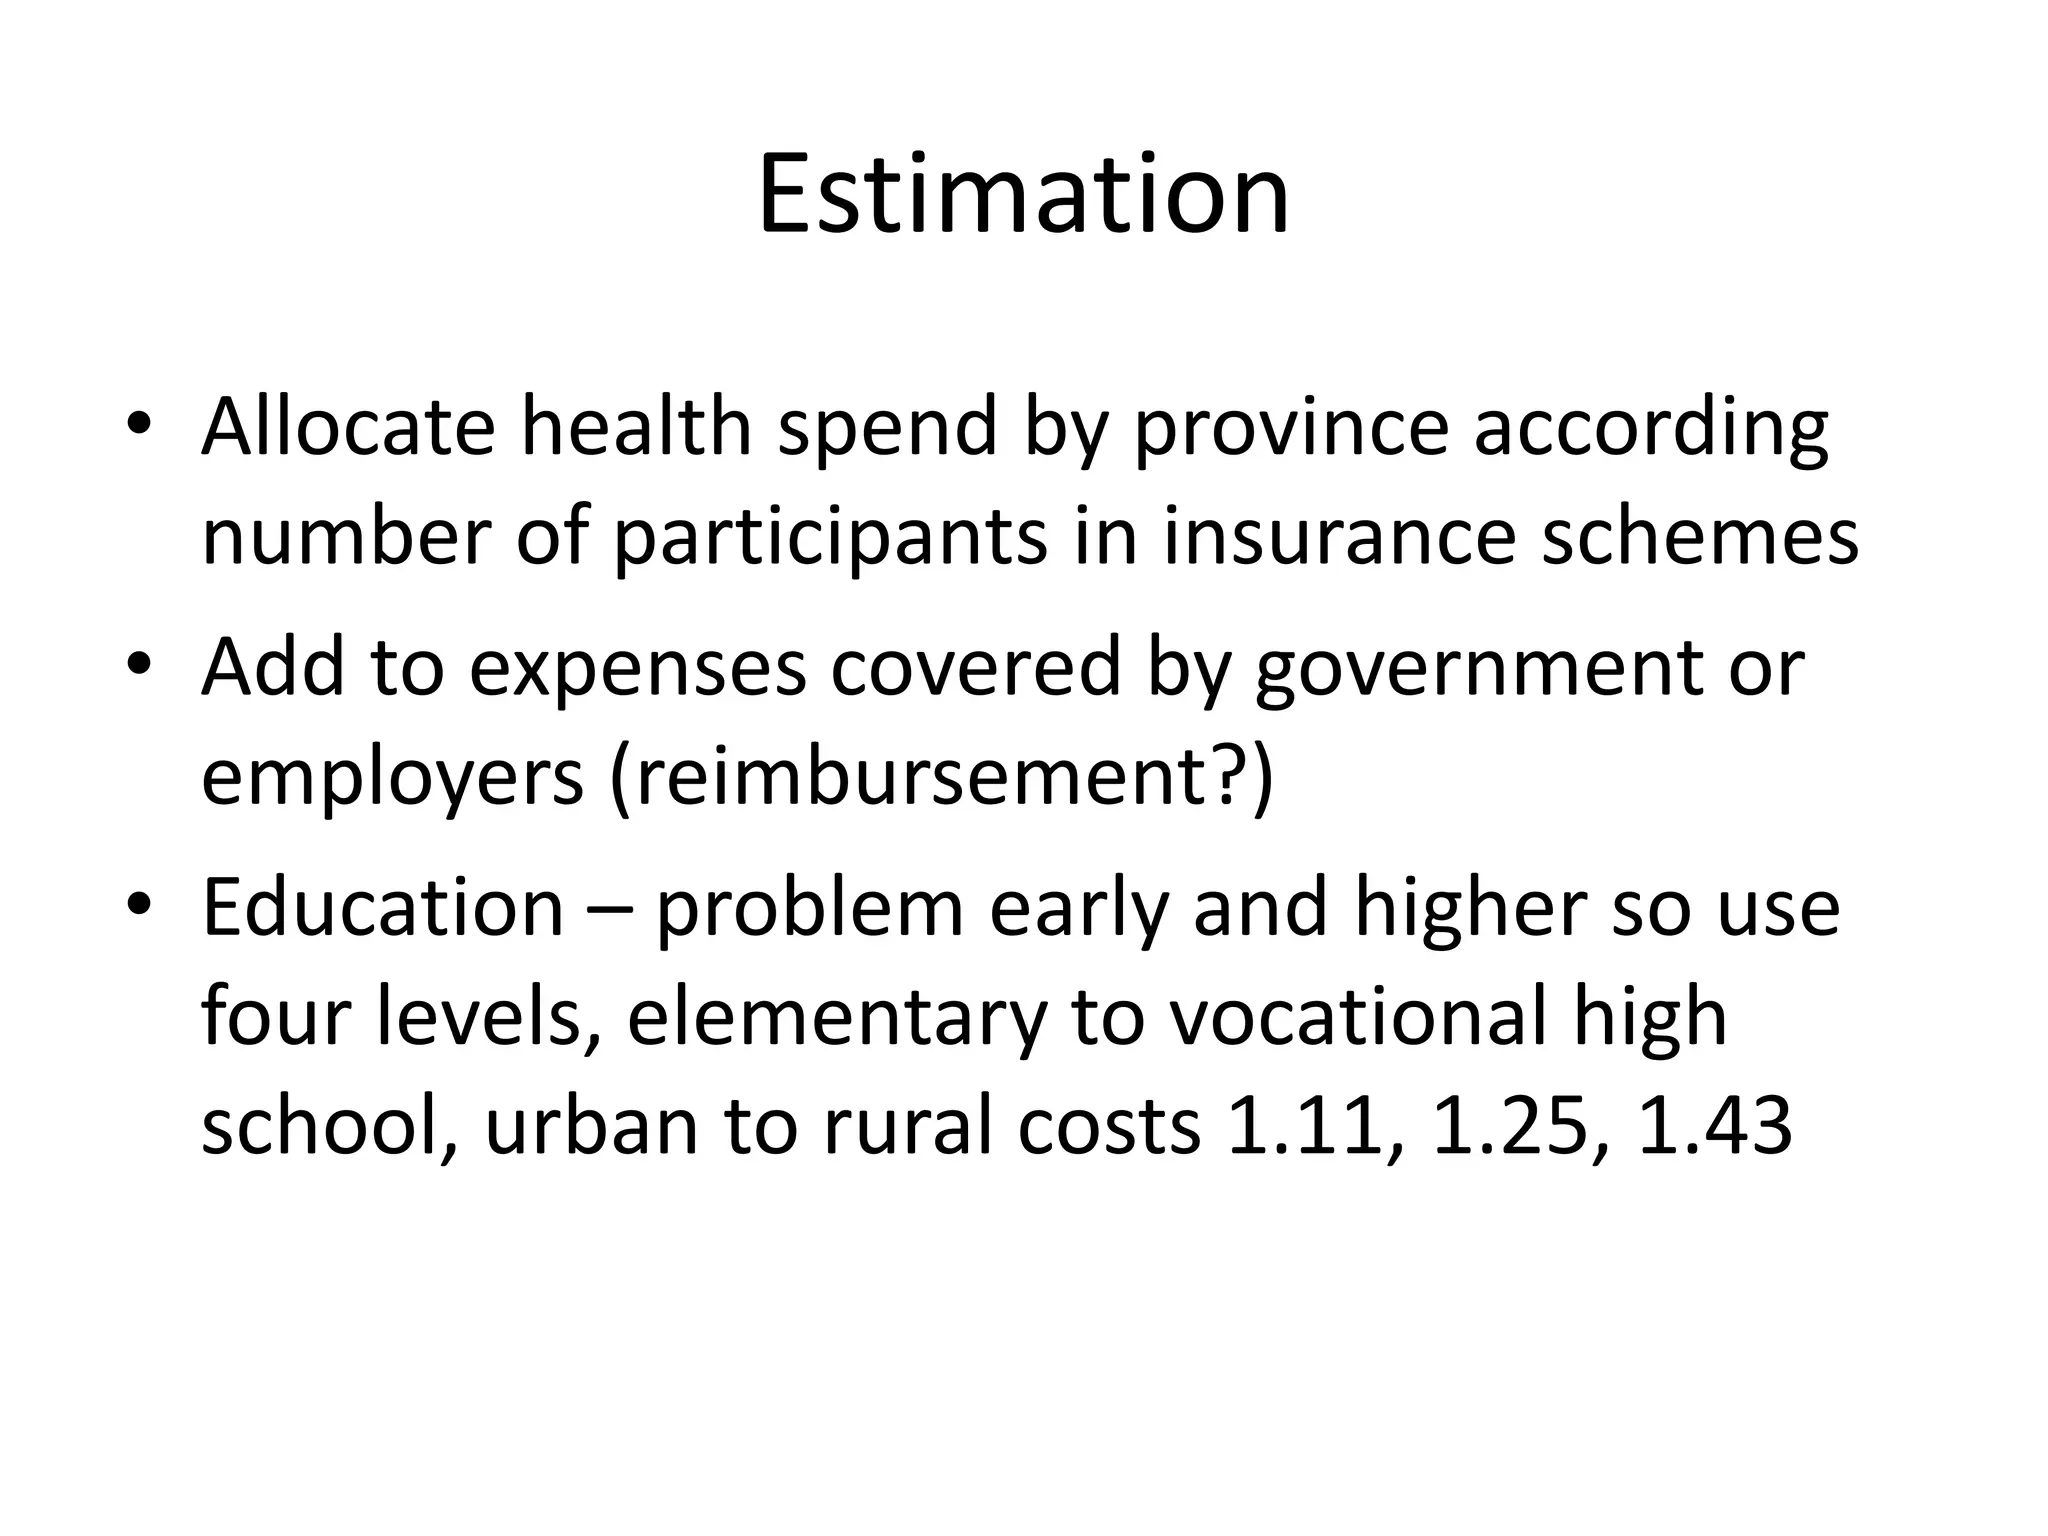
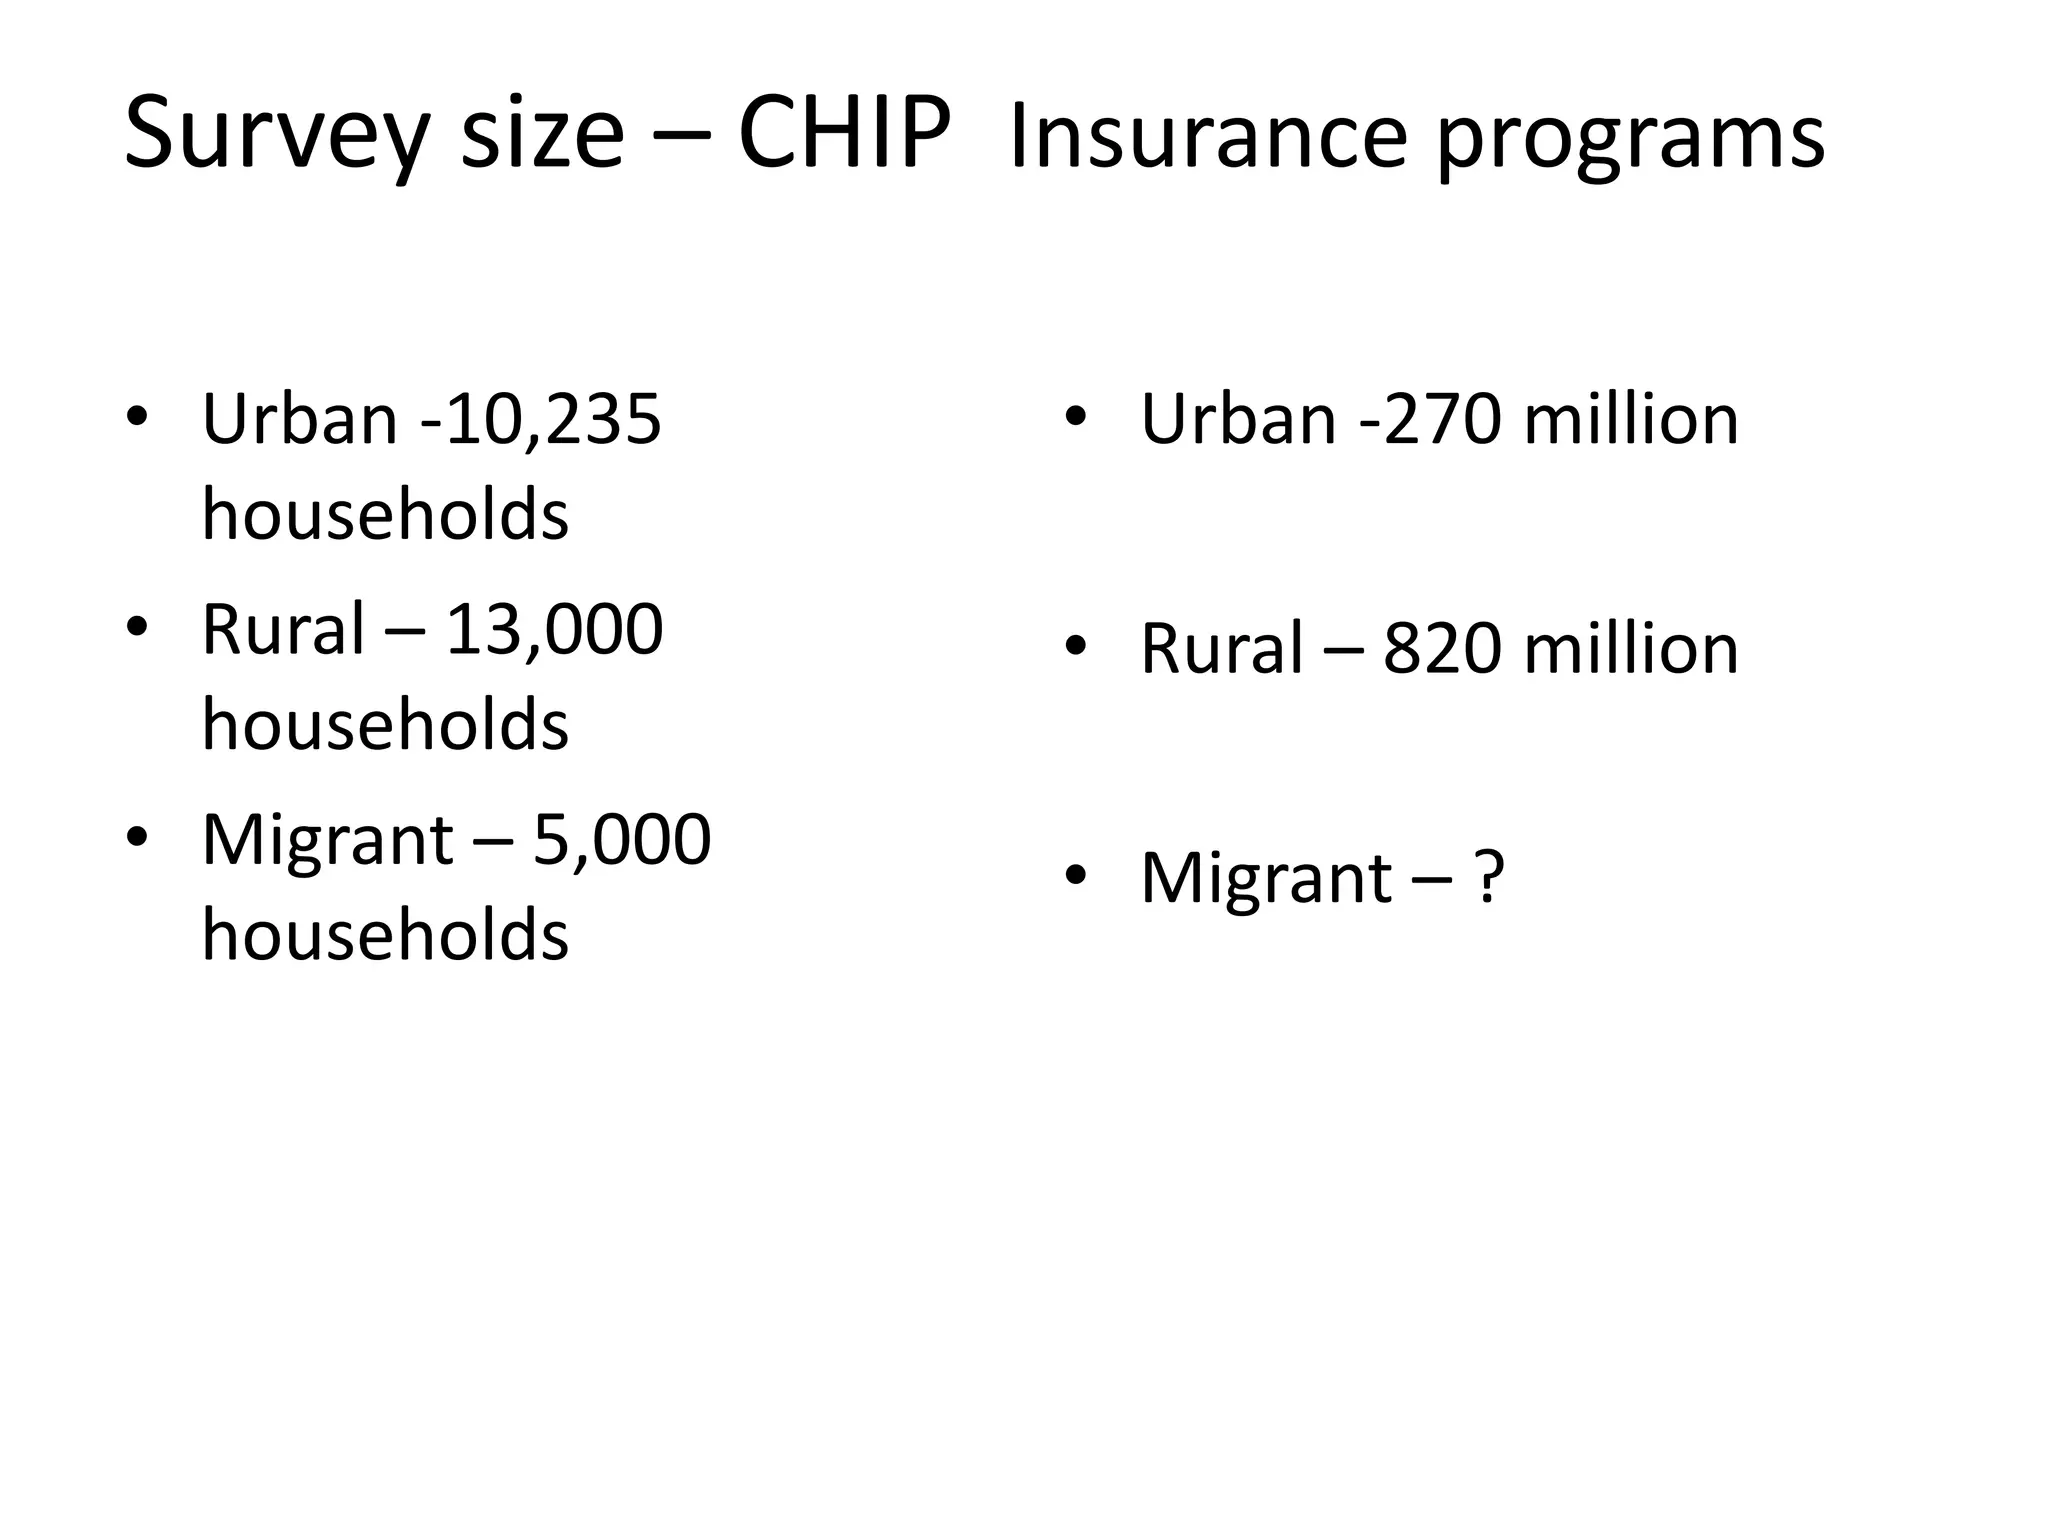
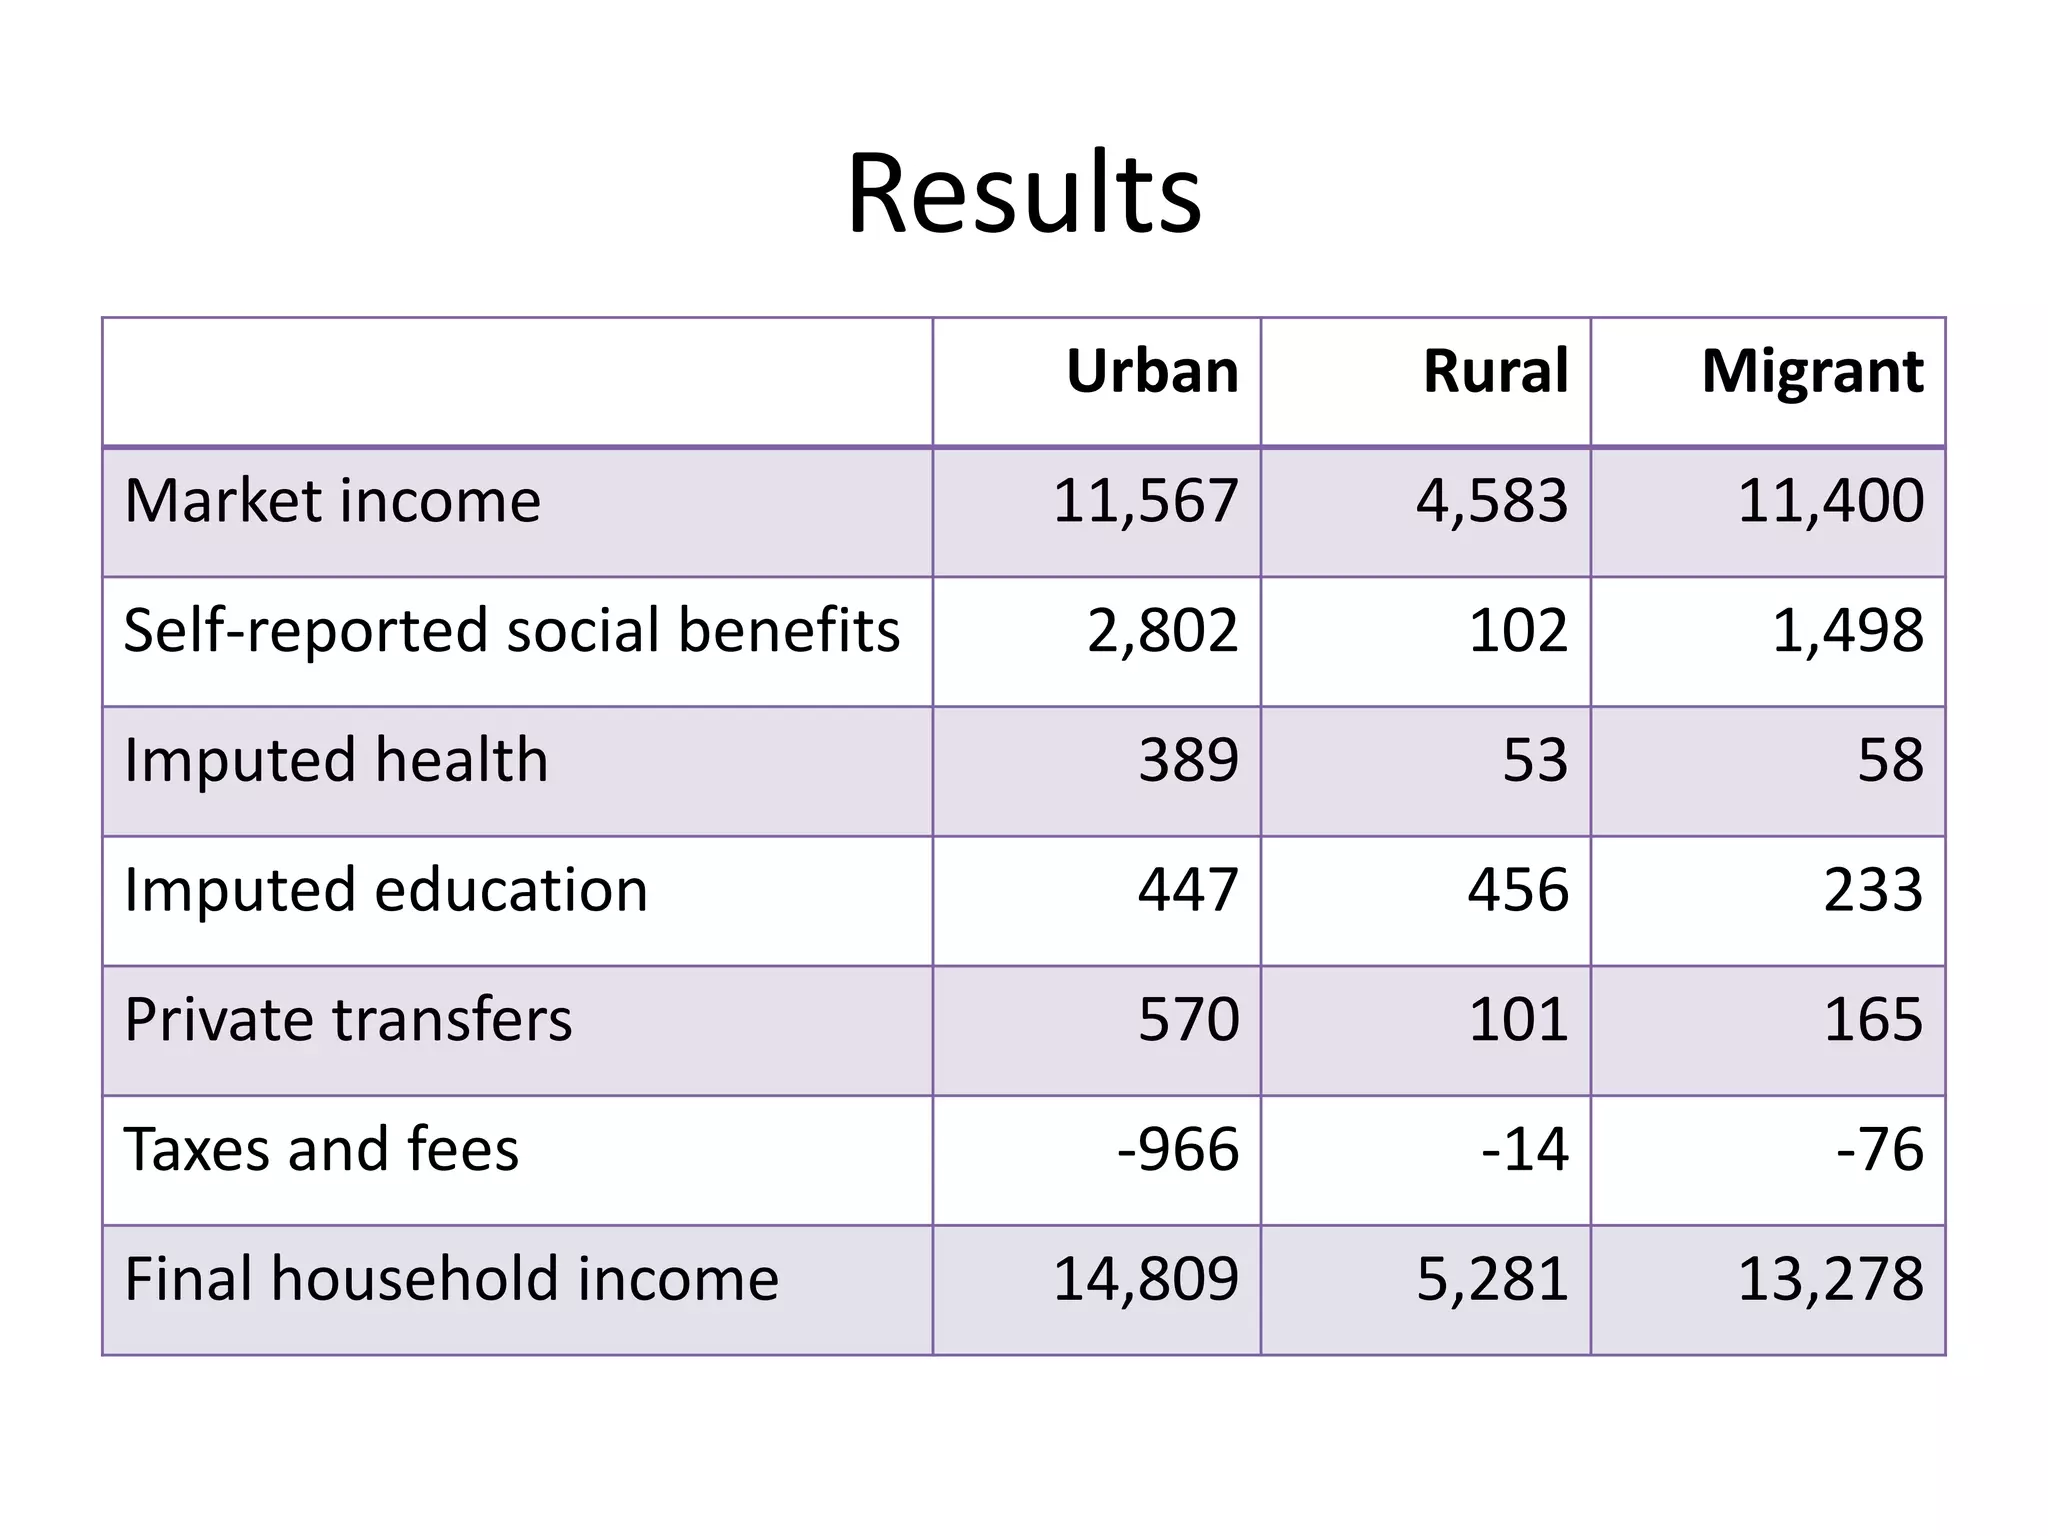
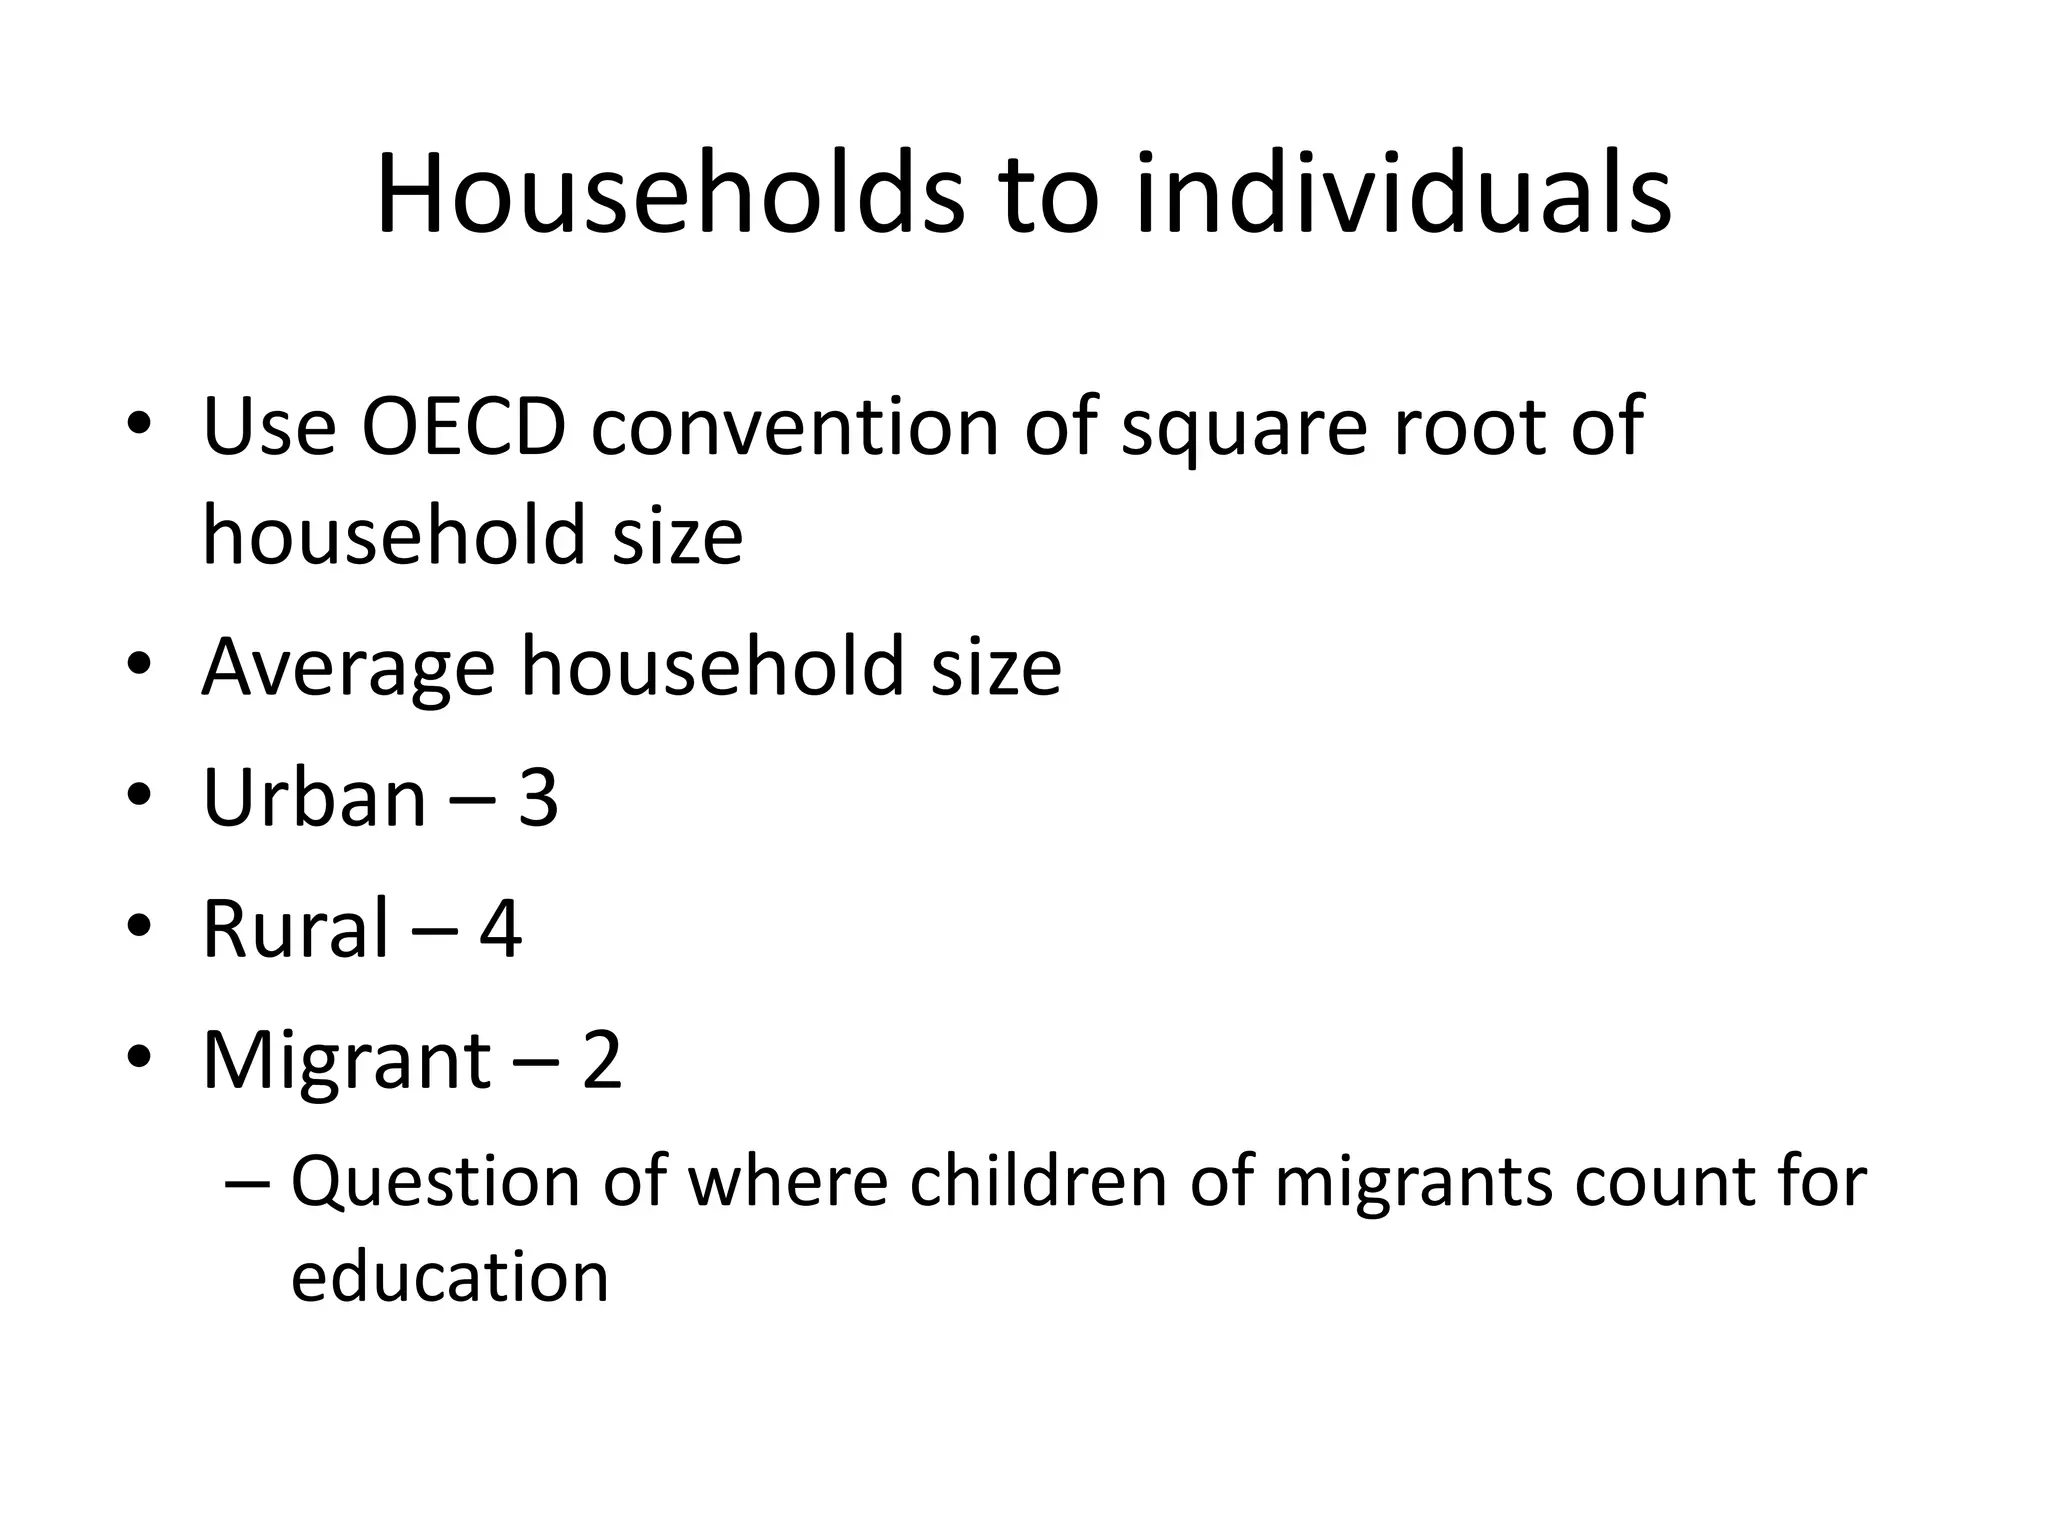
Three worlds of the Chinese welfare 
system: Do health and education 
change the picture? 
Qin Gao, Sui Yang,Yalu Zhang, Shi LI
Households and individuals: two 
sides of the same coin 
Arjan Bruil and Florin Barb
Both papers 
• Aim to allocate national accounts figures for 
social transfers in kind to individuals or 
households
Chinese paper 
NA figures 
Augment 
survey 
results 
Figures for 
the 
population
Dutch paper 
NA figures 
Households Individuals
Chinese paper 
• Three groups of households 
–Rural 
–Urban 
–Migrant 
• Those who have moved from rural to 
urban
Earlier studies 
• Urban social benefits similar to western 
industrialized countries 
• Rural similar to least developed countries 
• Migrants in between 
• BUT education STIK completely excluded, 
health STIK not fully captured
Forms of social welfare 
• Minimum livelihood guarantee (Dibao) for 
poor urban families – expanded to rural 
families in 2007 
• Health insurance – Urban mix of free, 
compulsory and optional; rural voluntary 
• Education – compulsory but urban spend 
higher than rural
Estimation 
• Allocate health spend by province according 
number of participants in insurance schemes 
• Add to expenses covered by government or 
employers (reimbursement?) 
• Education – problem early and higher so use 
four levels, elementary to vocational high 
school, urban to rural costs 1.11, 1.25, 1.43
Survey size – CHIP Insurance programs 
• Urban -10,235 
households 
• Rural – 13,000 
households 
• Migrant – 5,000 
households 
• Urban -270 million 
• Rural – 820 million 
• Migrant – ?
Results 
Urban Rural Migrant 
Market income 11,567 4,583 11,400 
Self-reported social benefits 2,802 102 1,498 
Imputed health 389 53 58 
Imputed education 447 456 233 
Private transfers 570 101 165 
Taxes and fees -966 -14 -76 
Final household income 14,809 5,281 13,278
Households to individuals 
• Use OECD convention of square root of 
household size 
• Average household size 
• Urban – 3 
• Rural – 4 
• Migrant – 2 
– Question of where children of migrants count for 
education
Conclusions 
• Health reinforces urban-rural split 
• Education significantly improves the position 
• Social benefits still has almost negligible effect 
on reducing urban/rural disparity
Comments 
• Rather brief discussion on impact by deciles 
using Gini coefficients only 
• More would be interesting – which urban 
decile does top rural decile match? 
• Other measures eg Palma indices?
Dutch paper 
• Incorporate micro data into national accounts 
• Register of individuals and of households 
• Wealth and household consumption at 
household level only 
• Income panel survey gives both but no 
imputed items 
• STIK are at individual level only
Virtual register 
• Identify individuals by characteristics such as 
age, marital status, gender, type of household 
• Household characteristics such as age of head, 
number of members 
• Even if only have a survey of households, 
could do similar matching
Health care costs - Ind to Hh 
• Figure 1: costs high at birth, decline sharply, 
slowly rise to end of life 
• Women have higher costs in child-bearing 
years, men at end of life 
• With data for 2007 can estimate patterns for 
2009 
• Later combine with actual 2009
Consumption – Hh to Ind 
• Equivalence scales – translate HH figures to 
individuals, show by male/female 
• Figure 6 shows significant differences when 
head =1, other adult = 0.5 because man is 
often taken to be the head
Where does this analysis lead? 
• Gives a useful distributional dimension to STIK 
• Does this lead on to show the consequences 
for consumption? 
• Is there feedback to other parts of national 
accounts or is this just a supplementary table?
Suppose mapping individuals to 
households not possible 
• Employees are individuals, STIK usually for 
individuals 
• Consumption for households, property 
income may be also 
• SAMs long predate Stiglitz, Sen, Fitoussi but 
have major discontinuity between 
employment and consumption without a 
mapping from individuals to households
Questions 
• Would this work in other countries? 
• Size 
– Netherlands population 16.8 million 
– China -1,366.3 million?? 
• Other issues 
– UK population – 64 million (?59 million!) 
– Resistance to registers 
• More on “virtual registers”

Session 6 c stik

  • 1.
    Three worlds ofthe Chinese welfare system: Do health and education change the picture? Qin Gao, Sui Yang,Yalu Zhang, Shi LI
  • 2.
    Households and individuals:two sides of the same coin Arjan Bruil and Florin Barb
  • 3.
    Both papers •Aim to allocate national accounts figures for social transfers in kind to individuals or households
  • 4.
    Chinese paper NAfigures Augment survey results Figures for the population
  • 5.
    Dutch paper NAfigures Households Individuals
  • 6.
    Chinese paper •Three groups of households –Rural –Urban –Migrant • Those who have moved from rural to urban
  • 7.
    Earlier studies •Urban social benefits similar to western industrialized countries • Rural similar to least developed countries • Migrants in between • BUT education STIK completely excluded, health STIK not fully captured
  • 8.
    Forms of socialwelfare • Minimum livelihood guarantee (Dibao) for poor urban families – expanded to rural families in 2007 • Health insurance – Urban mix of free, compulsory and optional; rural voluntary • Education – compulsory but urban spend higher than rural
  • 9.
    Estimation • Allocatehealth spend by province according number of participants in insurance schemes • Add to expenses covered by government or employers (reimbursement?) • Education – problem early and higher so use four levels, elementary to vocational high school, urban to rural costs 1.11, 1.25, 1.43
  • 10.
    Survey size –CHIP Insurance programs • Urban -10,235 households • Rural – 13,000 households • Migrant – 5,000 households • Urban -270 million • Rural – 820 million • Migrant – ?
  • 11.
    Results Urban RuralMigrant Market income 11,567 4,583 11,400 Self-reported social benefits 2,802 102 1,498 Imputed health 389 53 58 Imputed education 447 456 233 Private transfers 570 101 165 Taxes and fees -966 -14 -76 Final household income 14,809 5,281 13,278
  • 12.
    Households to individuals • Use OECD convention of square root of household size • Average household size • Urban – 3 • Rural – 4 • Migrant – 2 – Question of where children of migrants count for education
  • 13.
    Conclusions • Healthreinforces urban-rural split • Education significantly improves the position • Social benefits still has almost negligible effect on reducing urban/rural disparity
  • 14.
    Comments • Ratherbrief discussion on impact by deciles using Gini coefficients only • More would be interesting – which urban decile does top rural decile match? • Other measures eg Palma indices?
  • 15.
    Dutch paper •Incorporate micro data into national accounts • Register of individuals and of households • Wealth and household consumption at household level only • Income panel survey gives both but no imputed items • STIK are at individual level only
  • 16.
    Virtual register •Identify individuals by characteristics such as age, marital status, gender, type of household • Household characteristics such as age of head, number of members • Even if only have a survey of households, could do similar matching
  • 17.
    Health care costs- Ind to Hh • Figure 1: costs high at birth, decline sharply, slowly rise to end of life • Women have higher costs in child-bearing years, men at end of life • With data for 2007 can estimate patterns for 2009 • Later combine with actual 2009
  • 18.
    Consumption – Hhto Ind • Equivalence scales – translate HH figures to individuals, show by male/female • Figure 6 shows significant differences when head =1, other adult = 0.5 because man is often taken to be the head
  • 19.
    Where does thisanalysis lead? • Gives a useful distributional dimension to STIK • Does this lead on to show the consequences for consumption? • Is there feedback to other parts of national accounts or is this just a supplementary table?
  • 20.
    Suppose mapping individualsto households not possible • Employees are individuals, STIK usually for individuals • Consumption for households, property income may be also • SAMs long predate Stiglitz, Sen, Fitoussi but have major discontinuity between employment and consumption without a mapping from individuals to households
  • 21.
    Questions • Wouldthis work in other countries? • Size – Netherlands population 16.8 million – China -1,366.3 million?? • Other issues – UK population – 64 million (?59 million!) – Resistance to registers • More on “virtual registers”