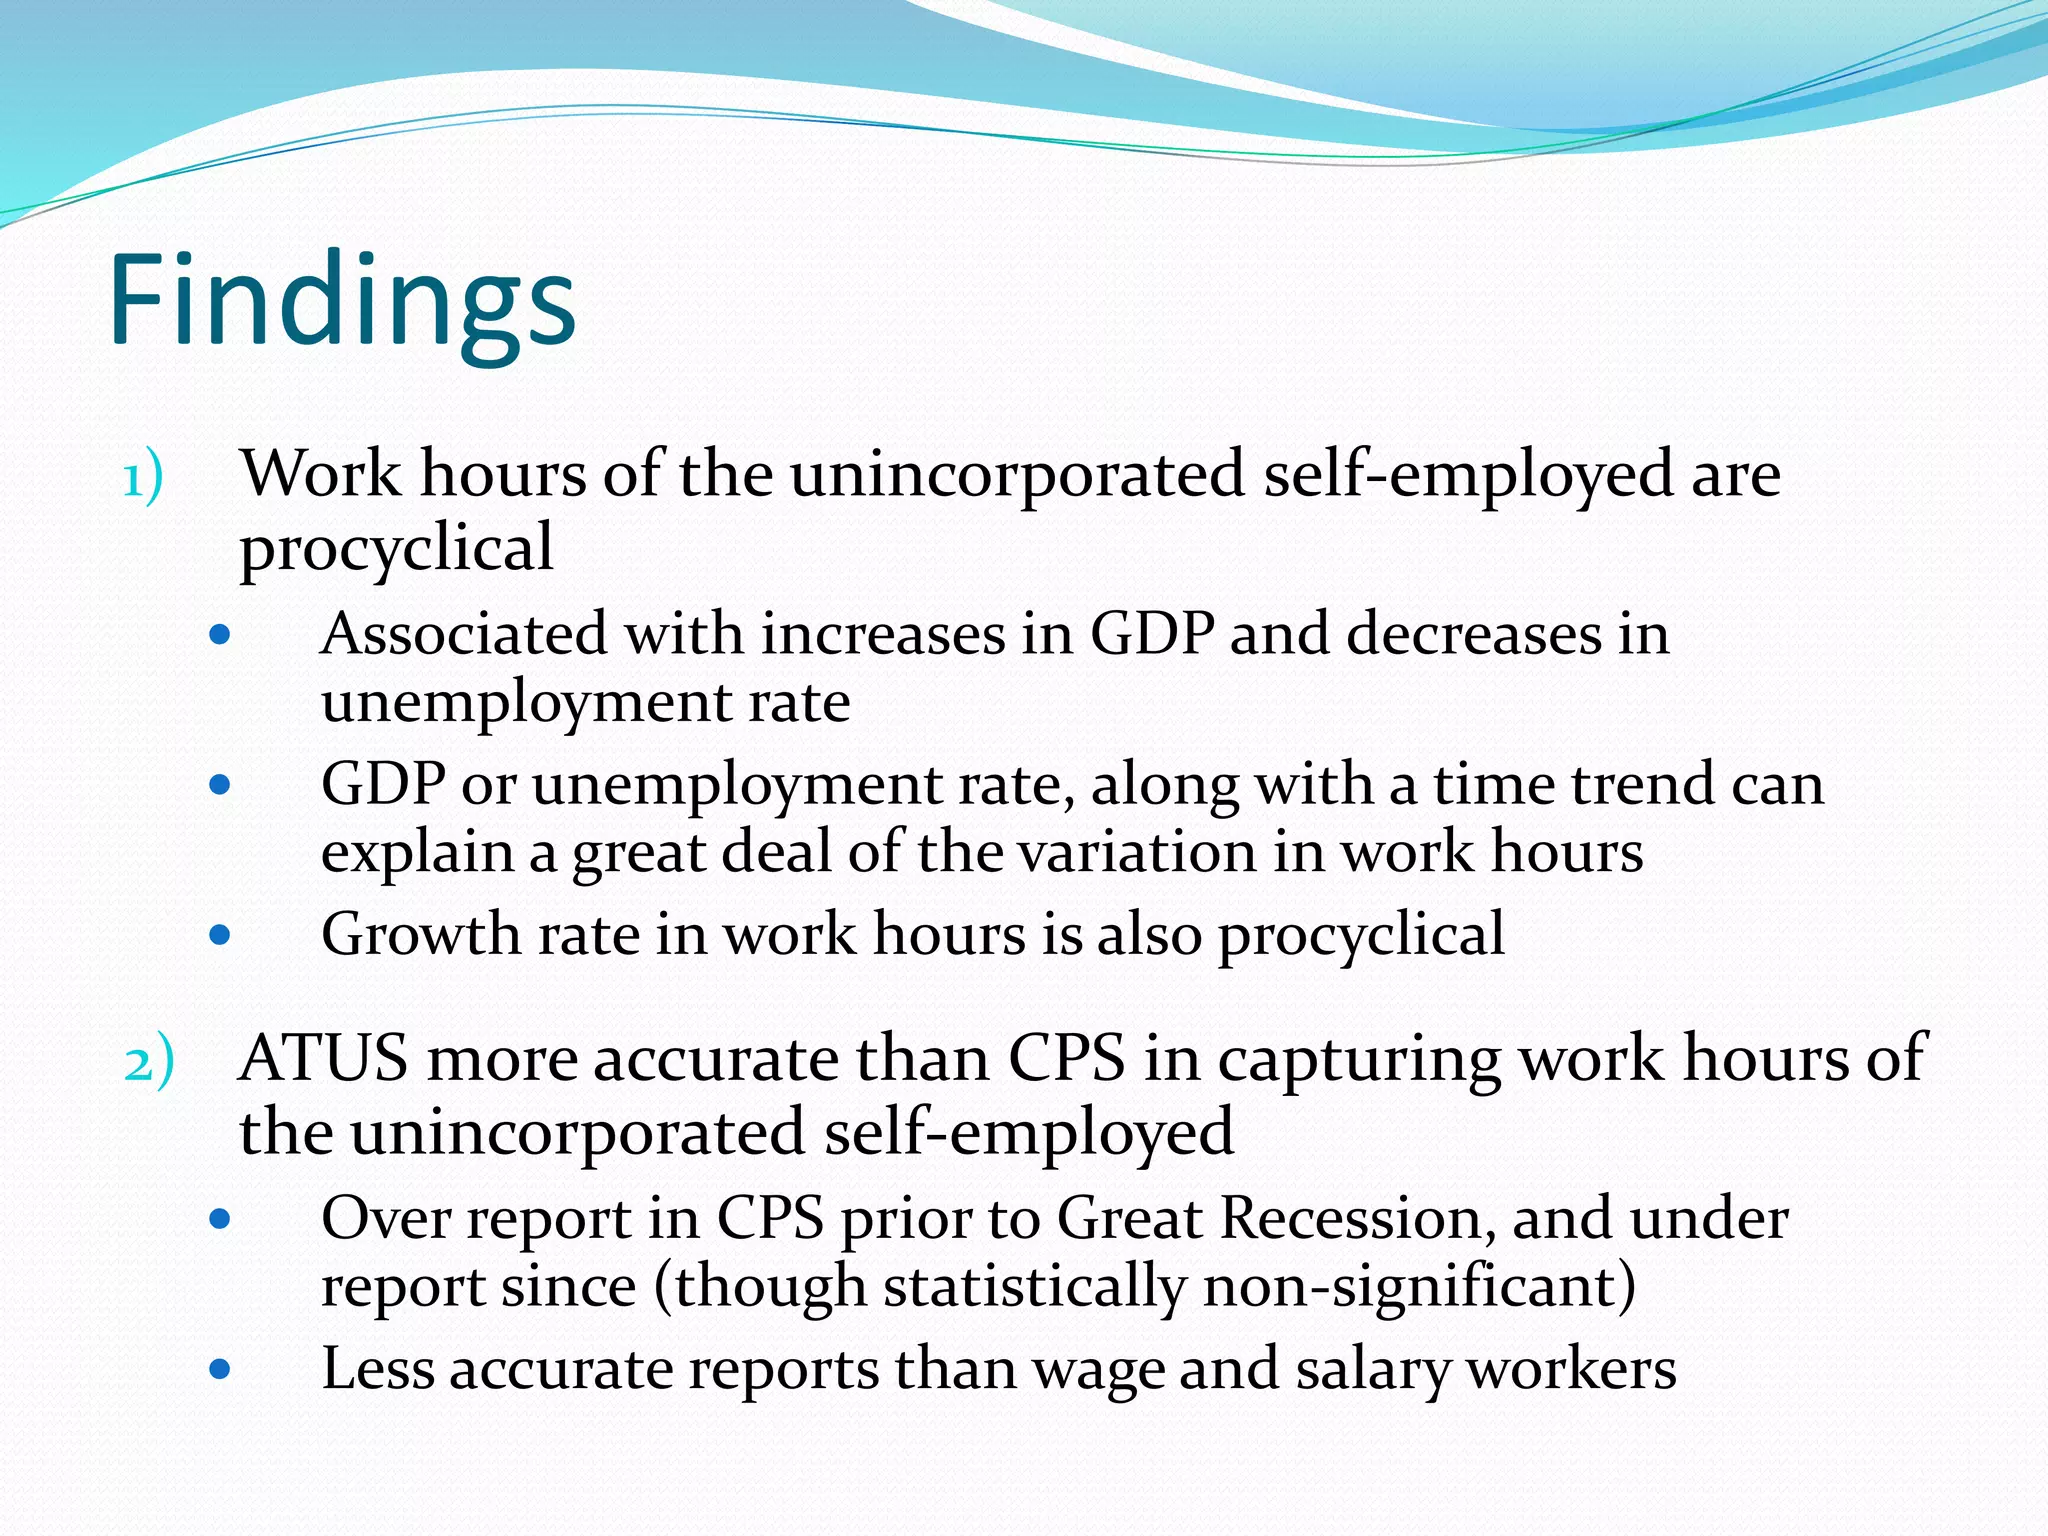
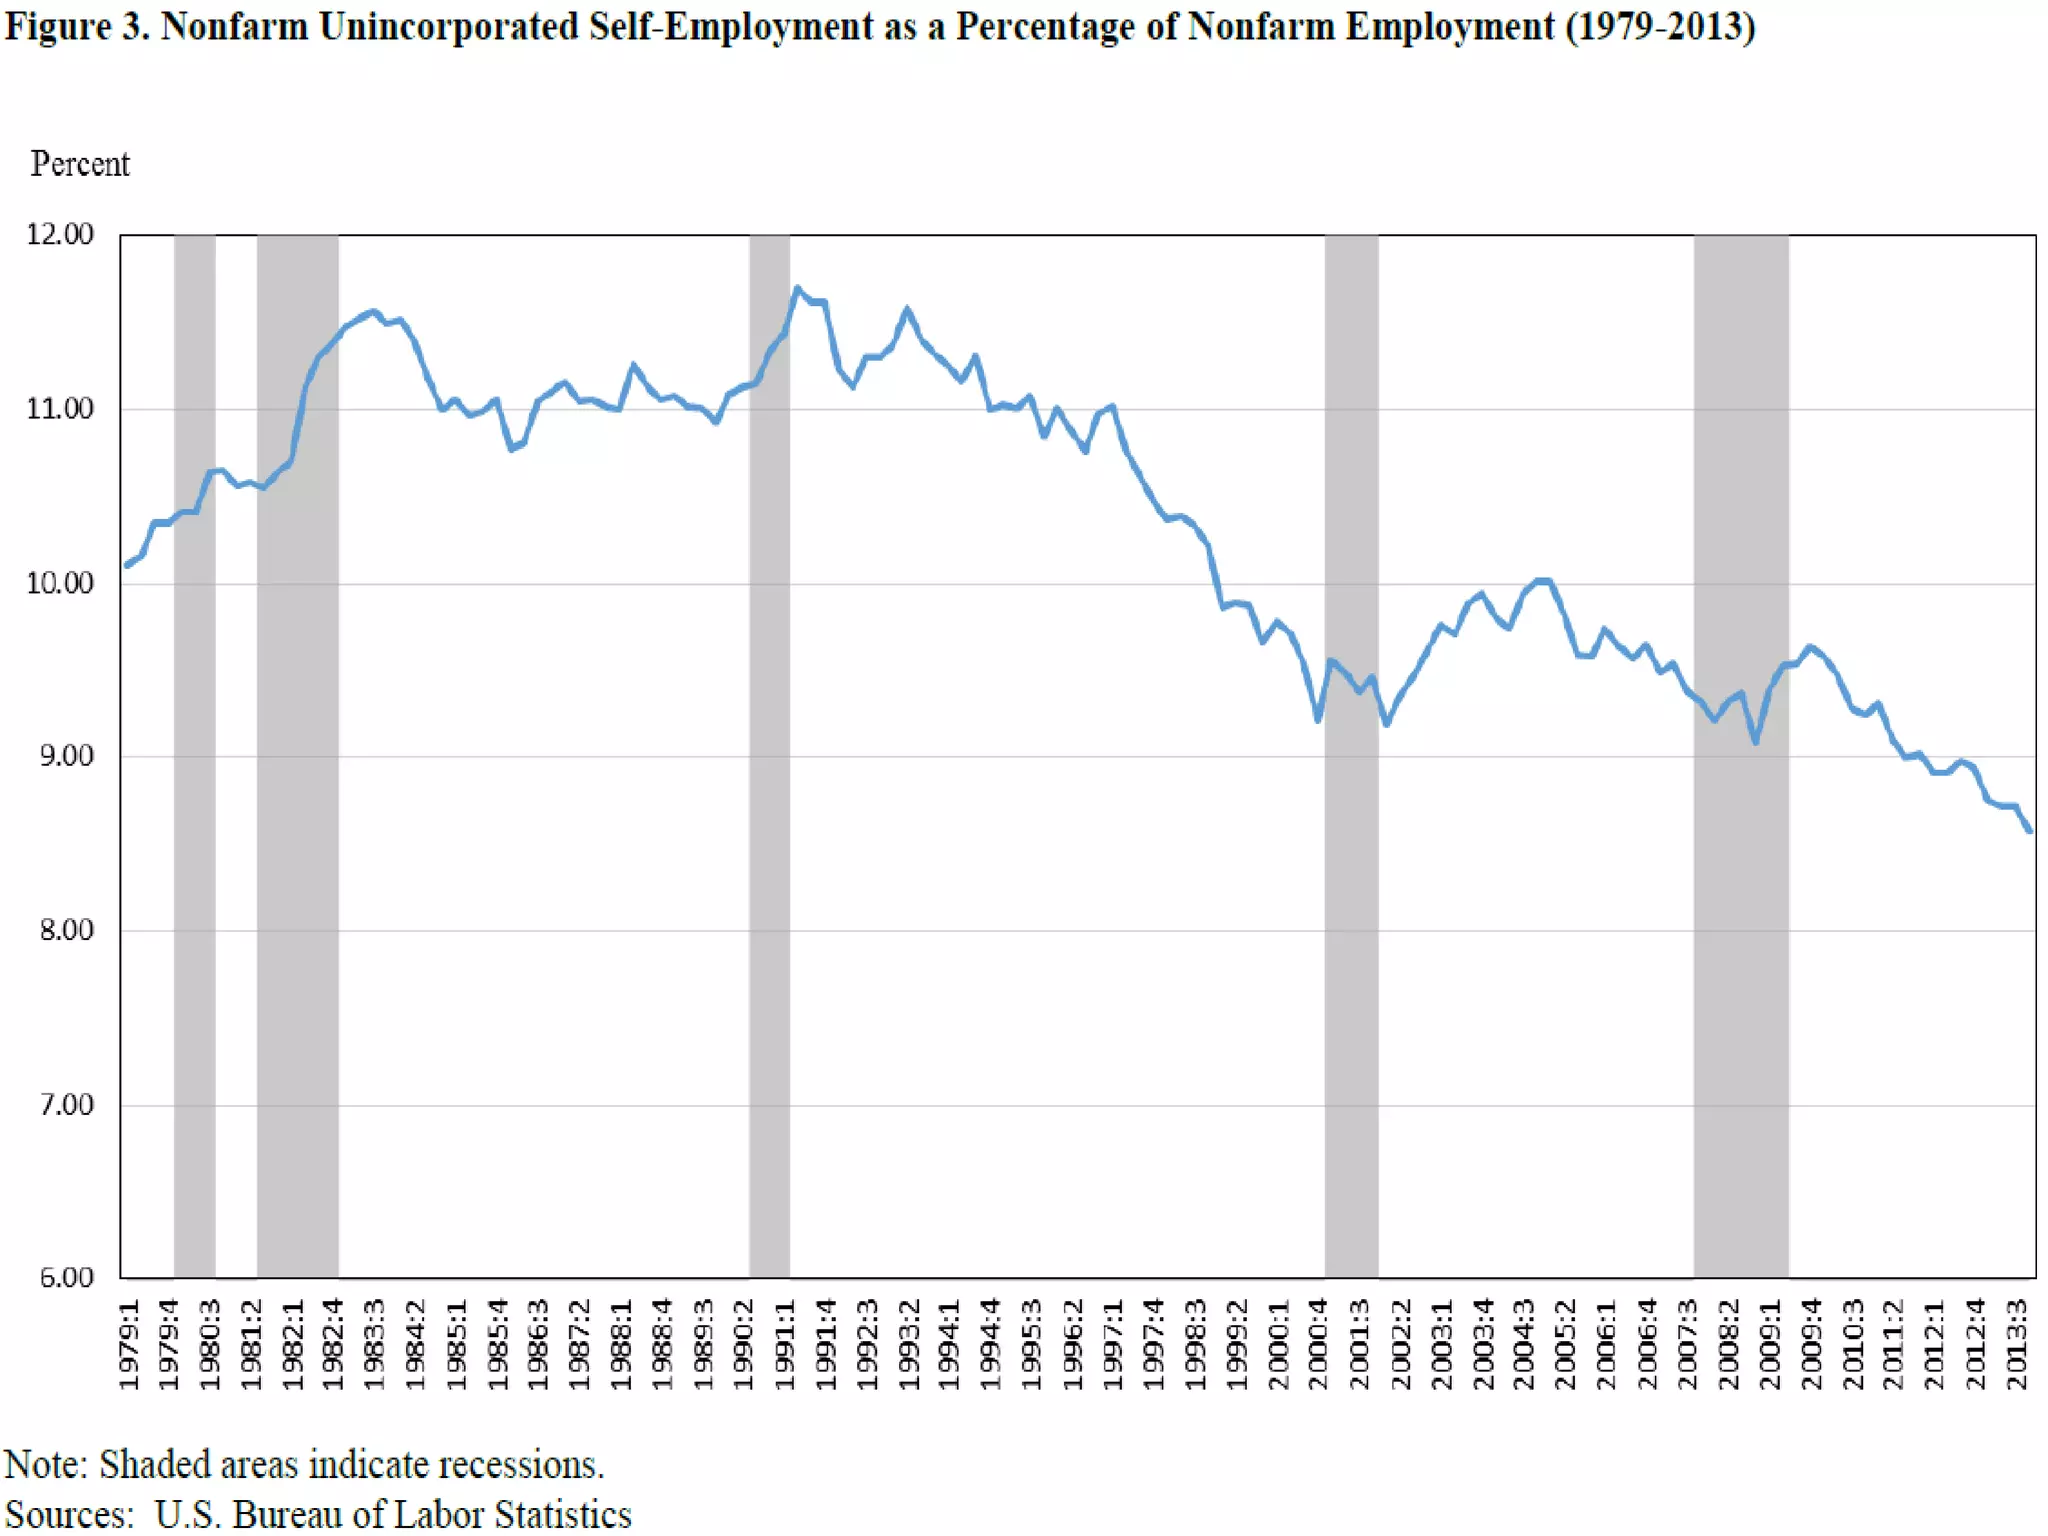
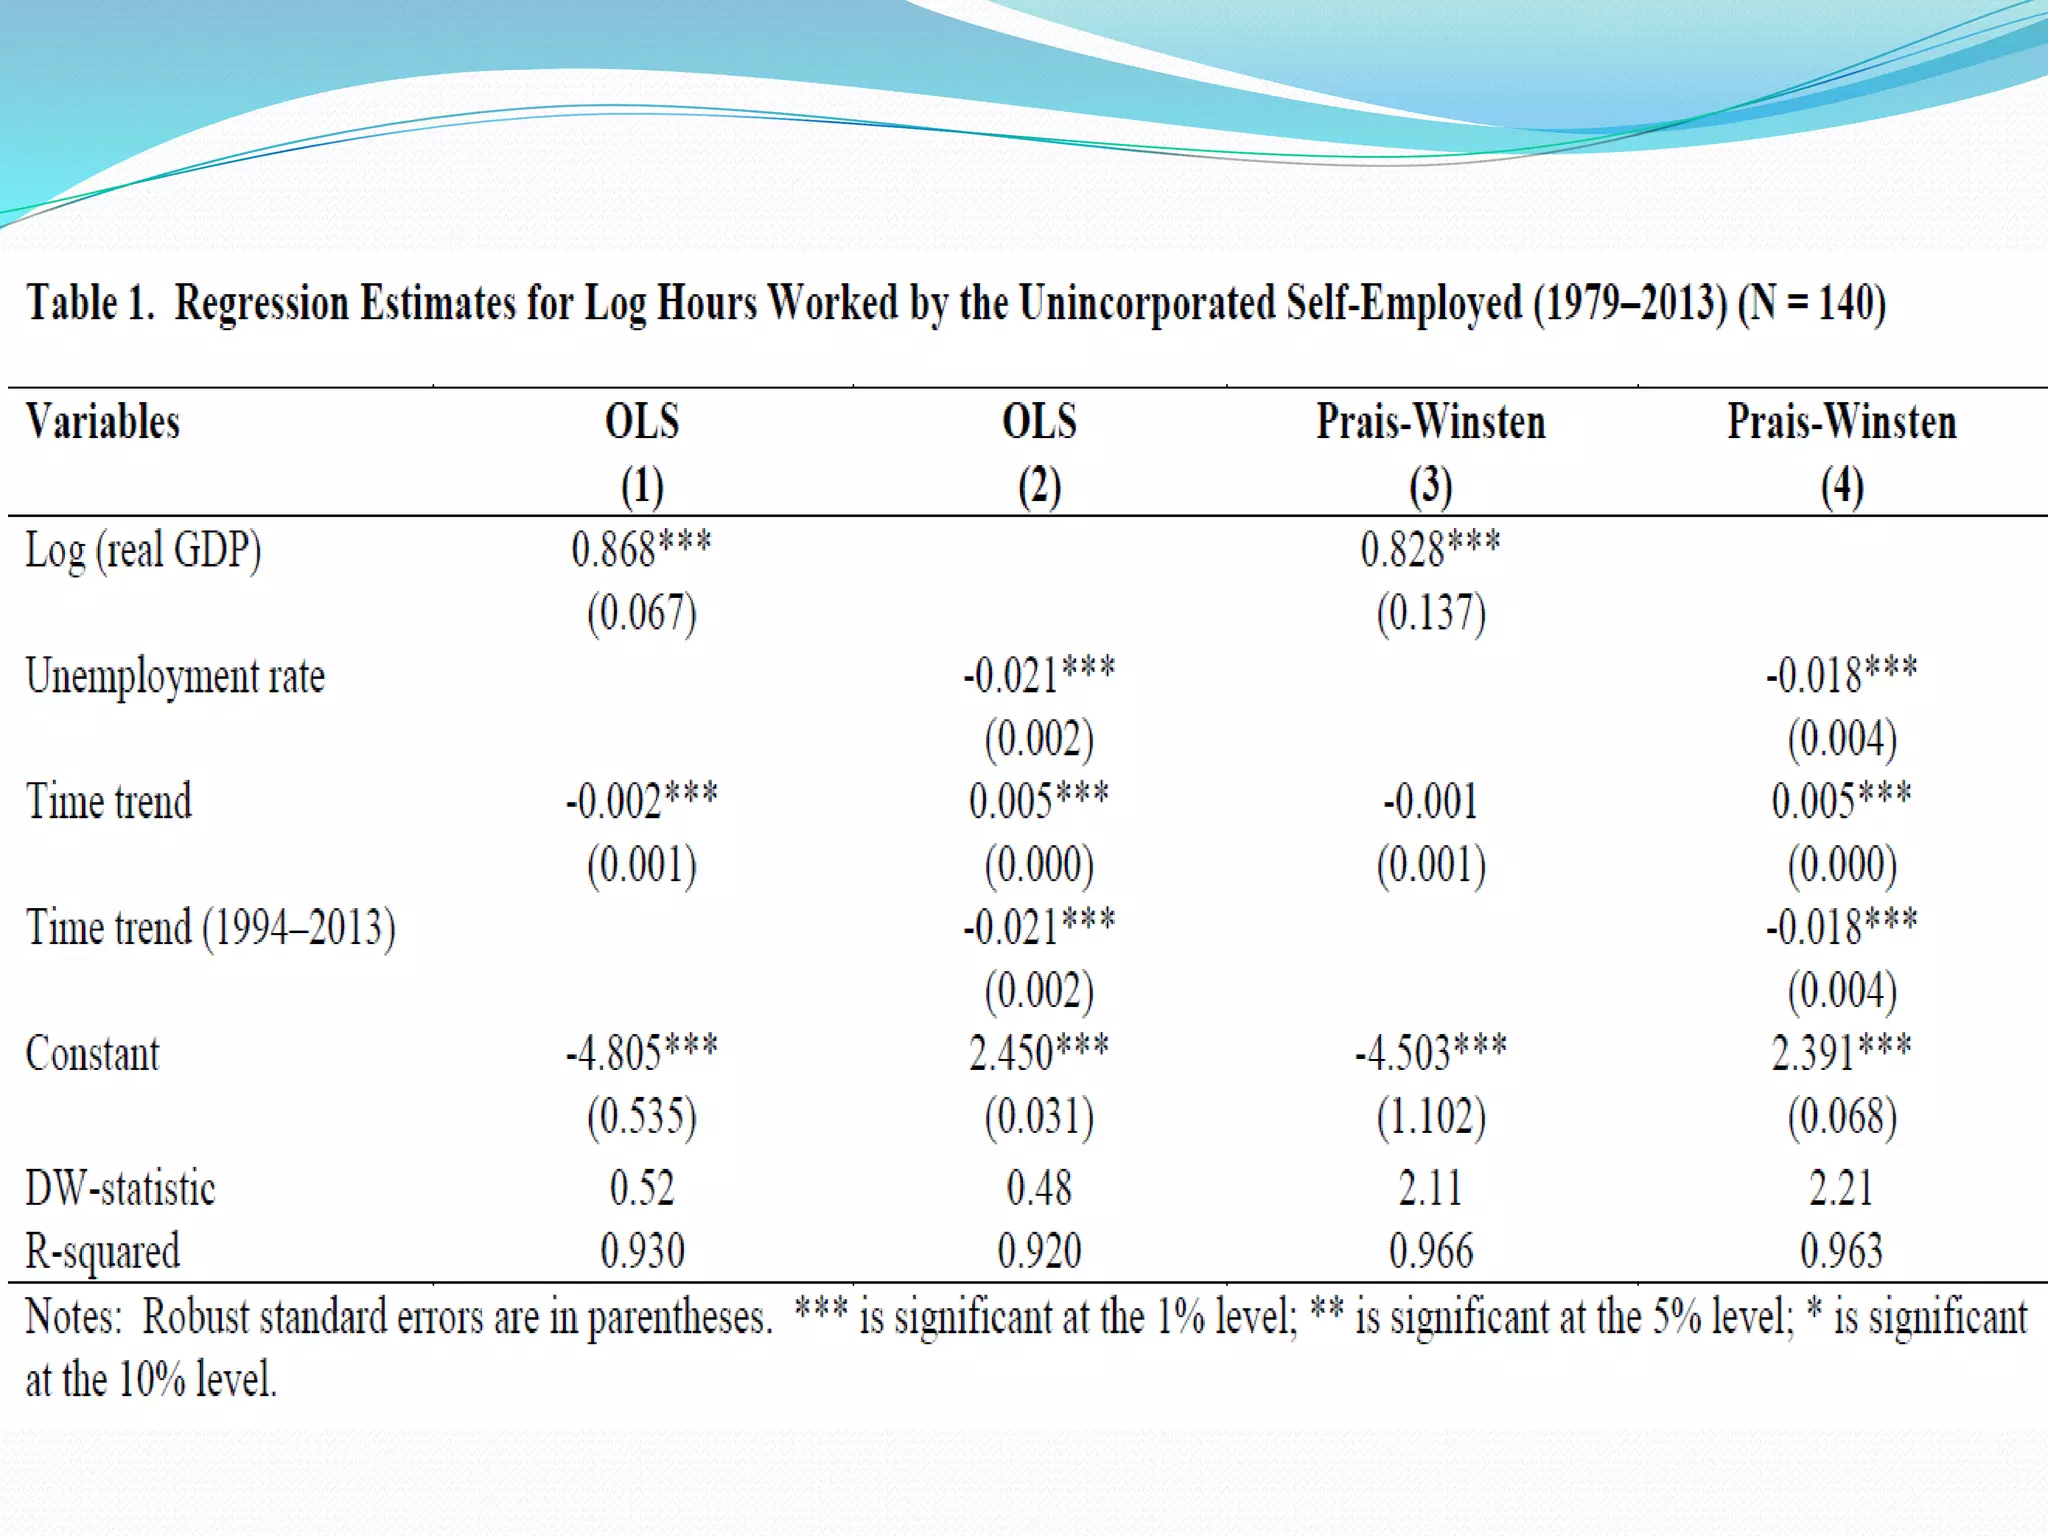
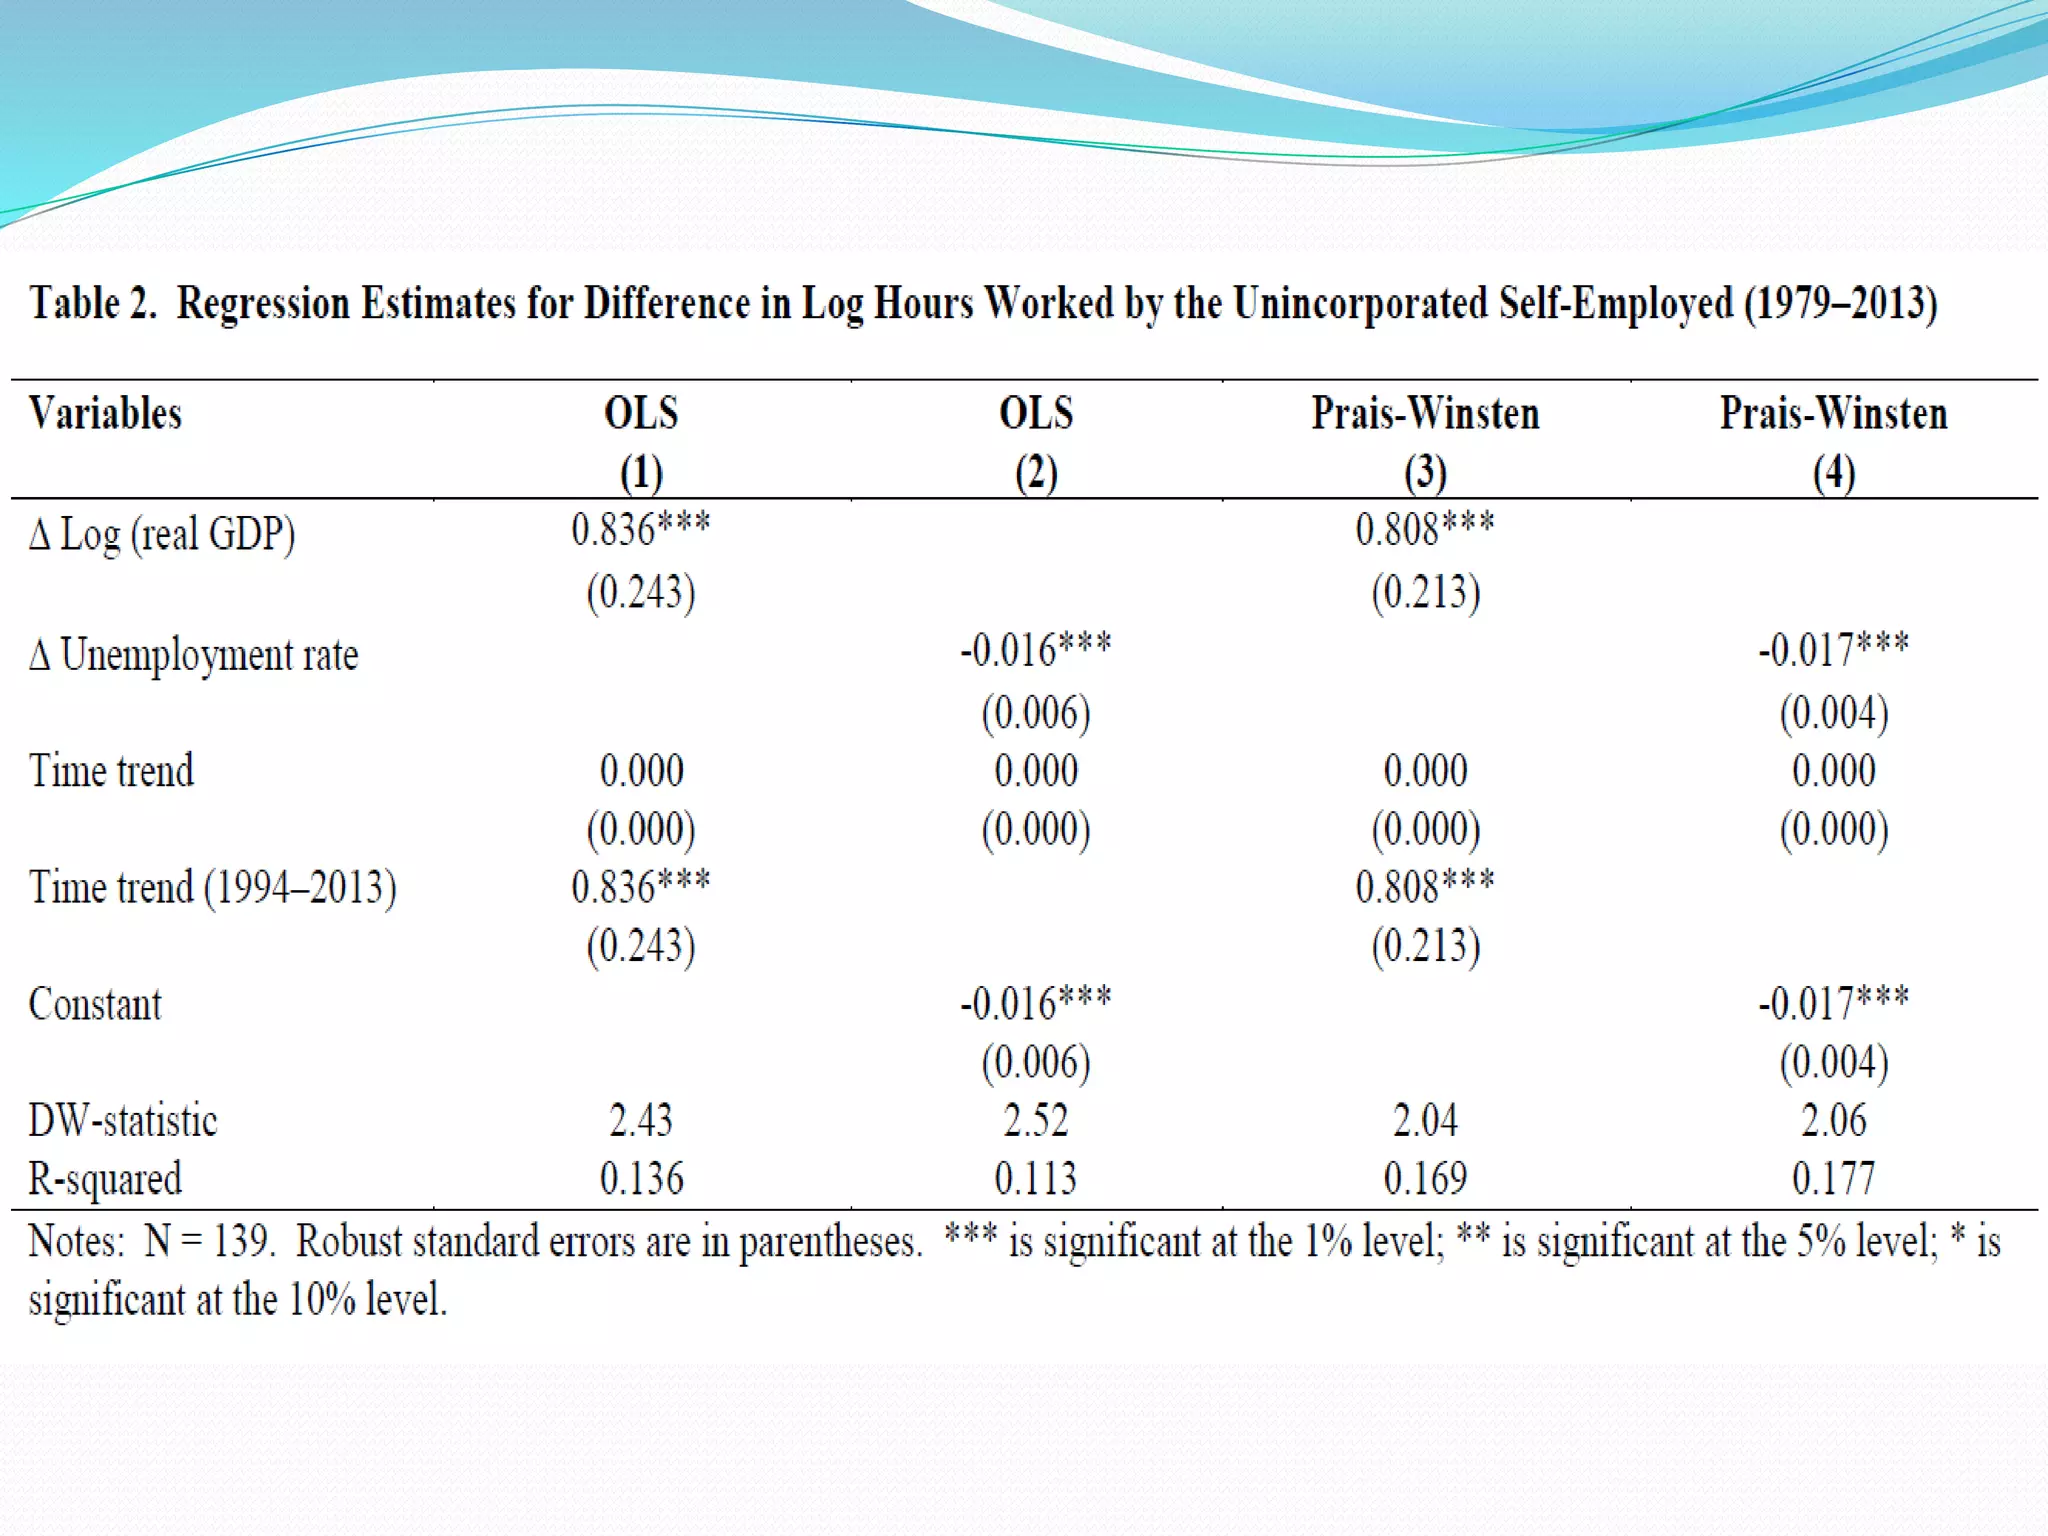
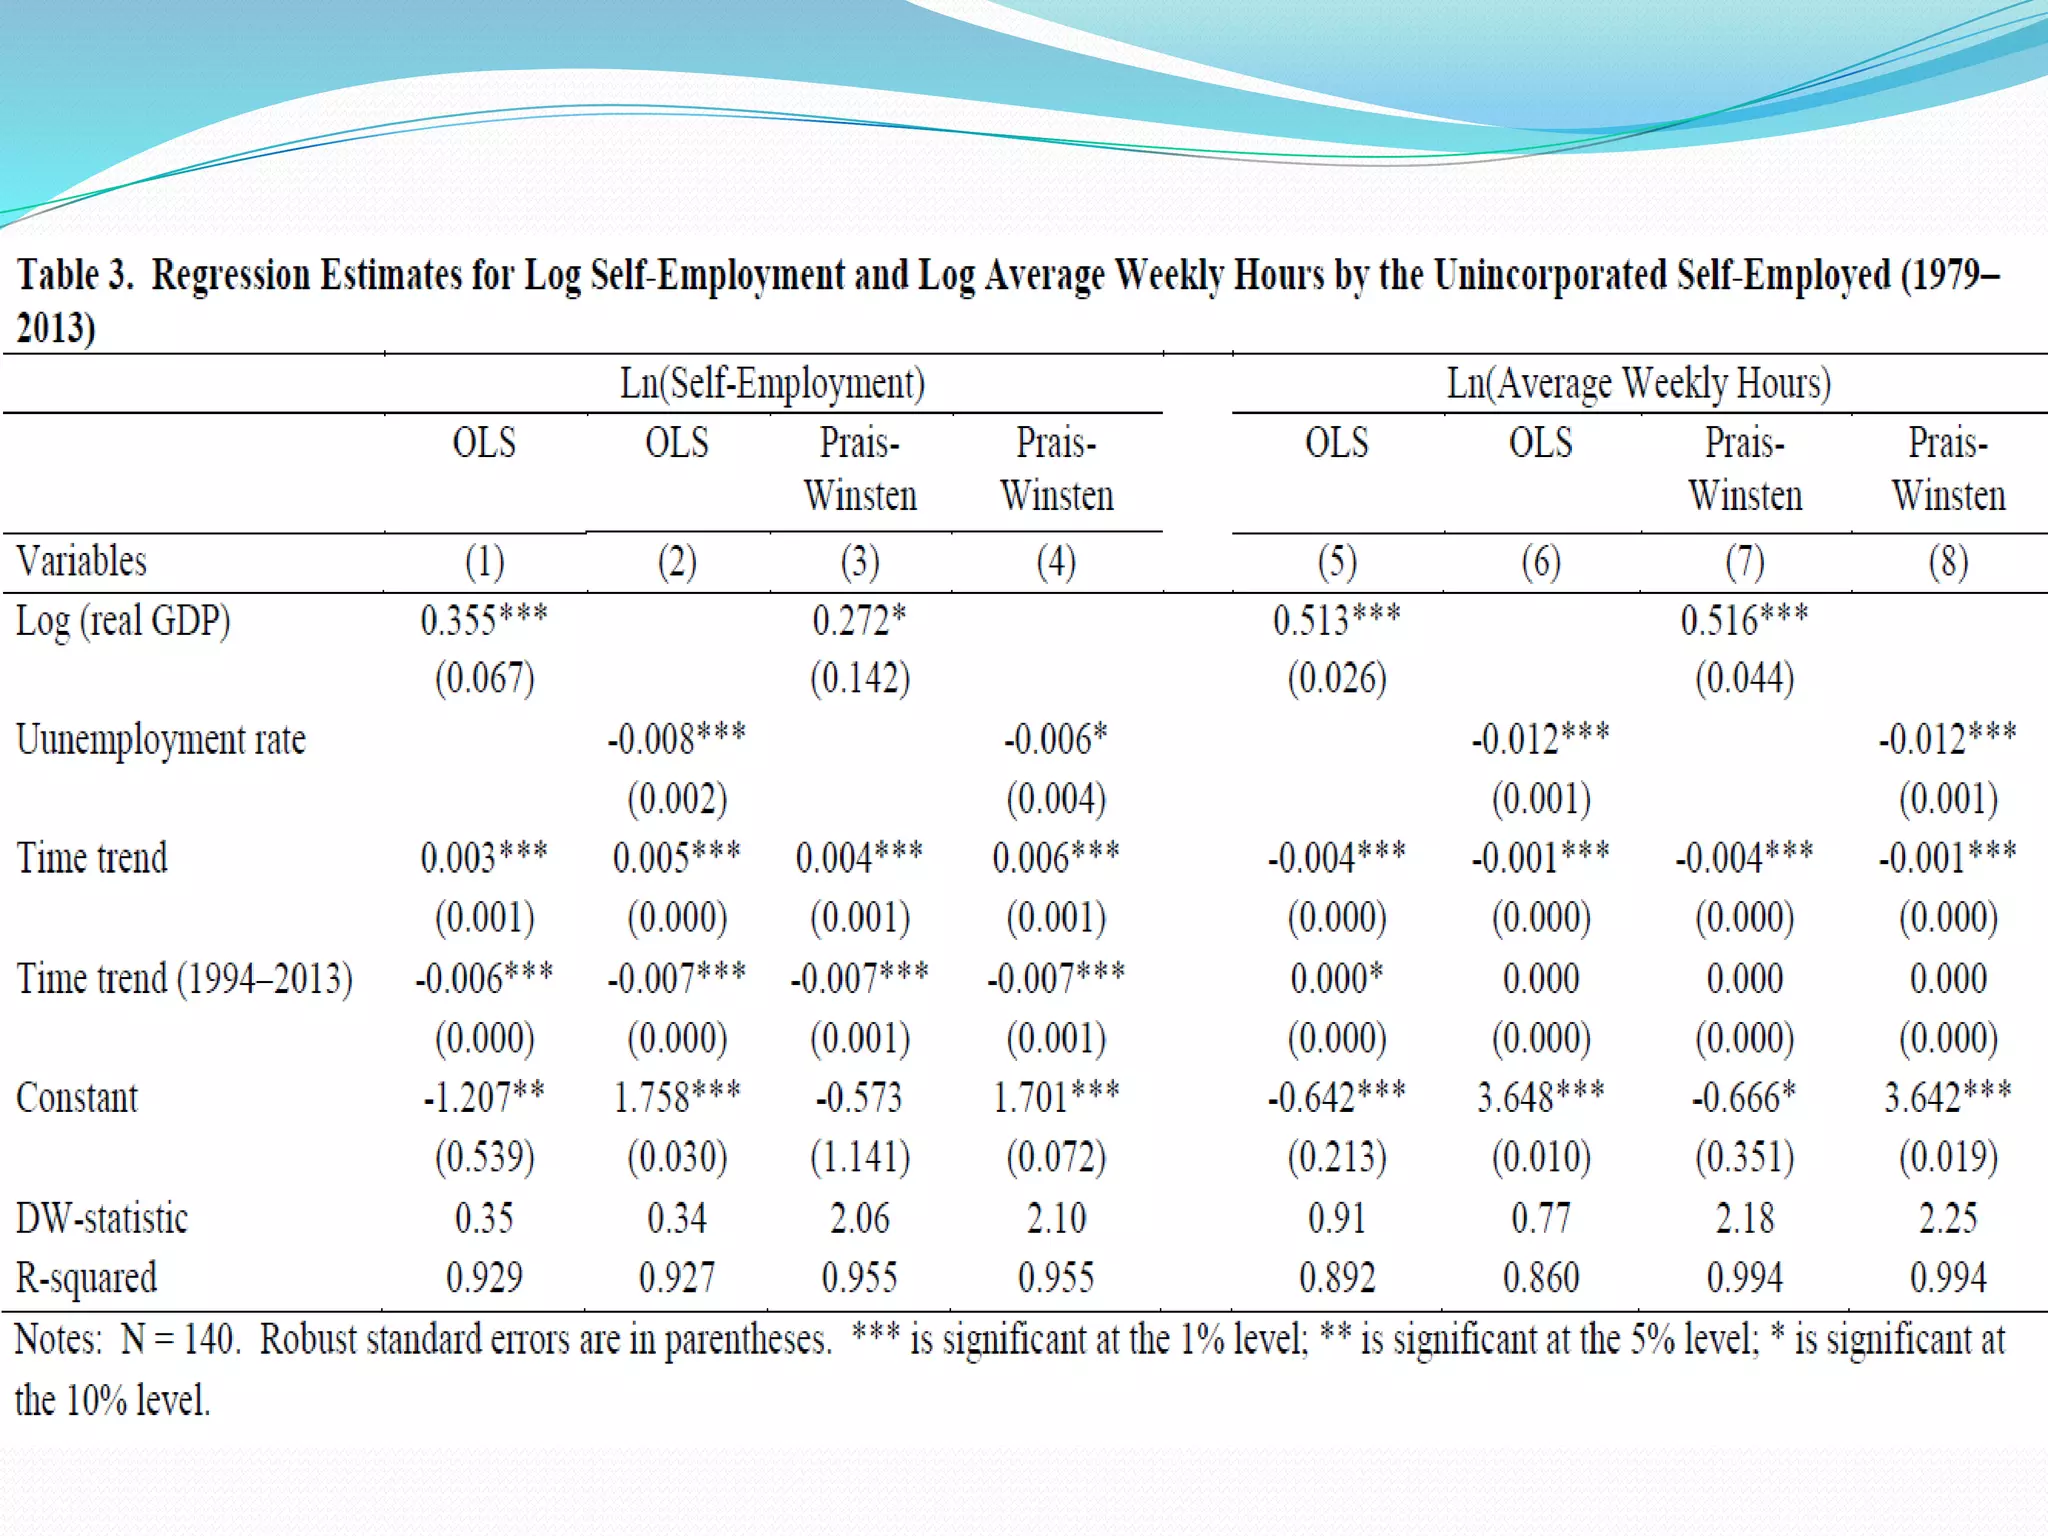
Sabrina Wulff Pabilonia 
U.S. Bureau of Labor Statistics 
Pabilonia.Sabrina@bls.gov 
Presented by: Qin Gao 
Fordham University 
aqigao@fordham.edu
Measuring work hours (and nonfarm 
business sector labor productivity) in the US 
 U.S. Bureau of Labor Statistics (BLS) 
 Hours worked by wage and salary employees – Current 
Employment Statistics (CES) program 
 Includes the incorporated self-employed 
 Hours worked by non-employees – Current Population 
Survey (CPS) 
 Unincorporated self-employed workers (the majority 
and focus of this paper) 
 Unpaid family workers 
 Workers at government enterprises (?)
Research Questions 
 Hours worked by the unincorporated self-employed have 
varied considerably each quarter, and this volatility is a 
source of much of the quarterly movement in overall labor 
productivity. 
 This paper: 
1) examines how closely the volatility in the unincorporated 
self-employment hours series correlates with the changes 
in macroeconomic conditions during 1979–2013. 
2) Compares weekly hours worked by the unincorporated 
self-employed from CPS with time diaries from 2003–2013 
American Time Use Survey (ATUS).
Findings 
1) Work hours of the unincorporated self-employed are 
procyclical 
 Associated with increases in GDP and decreases in 
unemployment rate 
 GDP or unemployment rate, along with a time trend can 
explain a great deal of the variation in work hours 
 Growth rate in work hours is also procyclical 
2) ATUS more accurate than CPS in capturing work hours of 
the unincorporated self-employed 
 Over report in CPS prior to Great Recession, and under 
report since (though statistically non-significant) 
 Less accurate reports than wage and salary workers
Business Cycles and Self-Employment: 
2 Competing Theories 
The “push” theory and countercyclical hypothesis: 
 Self-employment is chosen when it is difficult to find a job as 
an employee (i.e. unemployment high and GDP not 
growing). 
The “pull” theory and procyclical hypothesis: 
 Entrepreneurs have certain abilities that make them 
particularly suited for self-employment, but there is less 
incentive for them to start up a business when there is higher 
risk of failure. 
 Outcome depends on whether the “push” or “pull” is 
stronger.
Current Population Survey (CPS) Data 
 Monthly household survey 1979-2013 
 Respondents aged 15+ report hours worked on main job and 
secondary jobs. 
 “Last week, were you employed by government, by a private 
company, a nonprofit organization, or were you self-employed?” 
 If self-employed, “Is this business incorporated?” 
 Secondary job not asked about prior to 1994 redesign, but asked 
about in 1994-2003 
 BLS applied adjustment to pre-1994 hours to account for the lack of 
information from multiple jobholders. 
 OLS regressions 
 DV=log quarterly unincorporated self-employed hours (N=140) 
 IVs=macroeconomic condition (GDP or unemployment rate); time 
trend
American Time Use Survey (ATUS) 
 Sample drawn from households who have completed their final month-in- 
sample in CPS; representative of the U.S. civilian population. 
 Respondents interviewed 2-5 months following their final CPS interview 
 Interviews conducted every day throughout the year except for major 
holidays (12/23-1/2, day after Thanksgiving). 
 Survey weights adjusted for these missing days. 
 Respondents asked to report activities between 4am on diary day and 4am 
on interview day. 
 Also asked whether any non-wage/salary work activities were done as part 
of job or business  unincorporated self-employed 
 Comparison between ATUS and CPS: 2003-2013 
 Average weekly hours worked on the main job for nonfarm self-employed 
 Workers aged 15+ who likely had the same job and hours at the times of 
their ATUS and final CPS interviews, holidays excluded 
 N=1,442 unincorporated self-employed workers
Comments 
 Important topic addressing a knowledge gap 
 Little prior research: Only one study on question #1, 
using CPS and PSID data among male workers; supports 
the procyclical hypothesis 
 Any evidence from other countries? 
 Pre- vs. post-recessions analysis, DD? 
 Trends and effects among female workers, considering 
work-life balance debates
Other macroeconomic/policy factors? 
 State labor market indicators 
 Industry sector trends 
 Female labor force participation rate 
 Minimum wage 
 Welfare policy variations, esp. for low-income groups 
 State, industry, household fixed effects
Fuller use of data 
 CPS: possible to do individual level analysis? 
 ATUS: more nuanced analysis pre- vs. post-recession 
 Subgroup analysis could be revealing and policy-relevant 
 By gender, considering parenting roles 
 By marital/cohabiting status 
 By education/skill level 
 By age groups/cohorts 
 By industrial sector 
 A more detailed, dynamic picture and a more rigorous 
test of the hypotheses

Session 7 a pabilonia paper presented by gao

  • 1.
    Sabrina Wulff Pabilonia U.S. Bureau of Labor Statistics Pabilonia.Sabrina@bls.gov Presented by: Qin Gao Fordham University aqigao@fordham.edu
  • 2.
    Measuring work hours(and nonfarm business sector labor productivity) in the US  U.S. Bureau of Labor Statistics (BLS)  Hours worked by wage and salary employees – Current Employment Statistics (CES) program  Includes the incorporated self-employed  Hours worked by non-employees – Current Population Survey (CPS)  Unincorporated self-employed workers (the majority and focus of this paper)  Unpaid family workers  Workers at government enterprises (?)
  • 3.
    Research Questions Hours worked by the unincorporated self-employed have varied considerably each quarter, and this volatility is a source of much of the quarterly movement in overall labor productivity.  This paper: 1) examines how closely the volatility in the unincorporated self-employment hours series correlates with the changes in macroeconomic conditions during 1979–2013. 2) Compares weekly hours worked by the unincorporated self-employed from CPS with time diaries from 2003–2013 American Time Use Survey (ATUS).
  • 4.
    Findings 1) Workhours of the unincorporated self-employed are procyclical  Associated with increases in GDP and decreases in unemployment rate  GDP or unemployment rate, along with a time trend can explain a great deal of the variation in work hours  Growth rate in work hours is also procyclical 2) ATUS more accurate than CPS in capturing work hours of the unincorporated self-employed  Over report in CPS prior to Great Recession, and under report since (though statistically non-significant)  Less accurate reports than wage and salary workers
  • 5.
    Business Cycles andSelf-Employment: 2 Competing Theories The “push” theory and countercyclical hypothesis:  Self-employment is chosen when it is difficult to find a job as an employee (i.e. unemployment high and GDP not growing). The “pull” theory and procyclical hypothesis:  Entrepreneurs have certain abilities that make them particularly suited for self-employment, but there is less incentive for them to start up a business when there is higher risk of failure.  Outcome depends on whether the “push” or “pull” is stronger.
  • 6.
    Current Population Survey(CPS) Data  Monthly household survey 1979-2013  Respondents aged 15+ report hours worked on main job and secondary jobs.  “Last week, were you employed by government, by a private company, a nonprofit organization, or were you self-employed?”  If self-employed, “Is this business incorporated?”  Secondary job not asked about prior to 1994 redesign, but asked about in 1994-2003  BLS applied adjustment to pre-1994 hours to account for the lack of information from multiple jobholders.  OLS regressions  DV=log quarterly unincorporated self-employed hours (N=140)  IVs=macroeconomic condition (GDP or unemployment rate); time trend
  • 13.
    American Time UseSurvey (ATUS)  Sample drawn from households who have completed their final month-in- sample in CPS; representative of the U.S. civilian population.  Respondents interviewed 2-5 months following their final CPS interview  Interviews conducted every day throughout the year except for major holidays (12/23-1/2, day after Thanksgiving).  Survey weights adjusted for these missing days.  Respondents asked to report activities between 4am on diary day and 4am on interview day.  Also asked whether any non-wage/salary work activities were done as part of job or business  unincorporated self-employed  Comparison between ATUS and CPS: 2003-2013  Average weekly hours worked on the main job for nonfarm self-employed  Workers aged 15+ who likely had the same job and hours at the times of their ATUS and final CPS interviews, holidays excluded  N=1,442 unincorporated self-employed workers
  • 15.
    Comments  Importanttopic addressing a knowledge gap  Little prior research: Only one study on question #1, using CPS and PSID data among male workers; supports the procyclical hypothesis  Any evidence from other countries?  Pre- vs. post-recessions analysis, DD?  Trends and effects among female workers, considering work-life balance debates
  • 16.
    Other macroeconomic/policy factors?  State labor market indicators  Industry sector trends  Female labor force participation rate  Minimum wage  Welfare policy variations, esp. for low-income groups  State, industry, household fixed effects
  • 17.
    Fuller use ofdata  CPS: possible to do individual level analysis?  ATUS: more nuanced analysis pre- vs. post-recession  Subgroup analysis could be revealing and policy-relevant  By gender, considering parenting roles  By marital/cohabiting status  By education/skill level  By age groups/cohorts  By industrial sector  A more detailed, dynamic picture and a more rigorous test of the hypotheses

Editor's Notes

  • #8 Figure 1 shows the log level of hours of the nonfarm unincorporated self-employed from 1979 through the end of 2013, along with recessions. From 1979 to the early 1990s, hours trended upward, then remained relatively stable in the 1990’s and early 2000’s before falling sharply beginning in 2007 with the recession but continuing to trend downward in the subsequent weak recovery period.
  • #9 The stability in hours during the 1990’s and early 2000’s occurred simultaneously with a rapid increase in real GDP (Figure 2).
  • #10 Figure 3 shows the unincorporated self-employment rate for all jobs in the nonfarm business sector over the same period. Since the early 1990s, the self-employment rate has declined from a high of 11.7 percent in the third quarter of 1991 to about 8.5 percent in the fourth quarter of 2013. In the last two recessions, the self-employment rate declined sharply, whereas in previous recessions the self-employment rate rose.