
![Results (4):Total emissions of Dutch controlled enterprises in the Netherlands and abroad
10 © 2014 The Conference Board, Inc. | www.conferenceboard.org
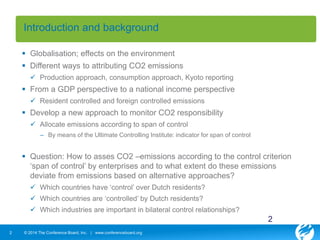
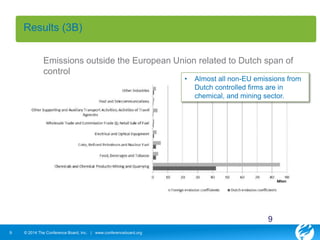
• 43% (104 Mton) of Dutch controlled
emissions (242 Mton) are emitted by
Dutch residents, and 57% (138 Mton) by
foreign residents abroad.
• Total emissions by Dutch controlled
firms (242 Mton) are higher by 44% than
production approach (168 Mton)
[excluding households].
10](https://image.slidesharecdn.com/8yqy0wmxqasbntag8ukq-signature-e52dfbe140e40d11dd453de2b4b6de6d9aa2d5bf46232c6c33d2729cf8f31e9e-poli-140830075958-phpapp02/85/Session-7-c-iariw-august14-erumban-10-320.jpg)
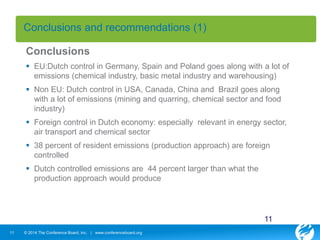
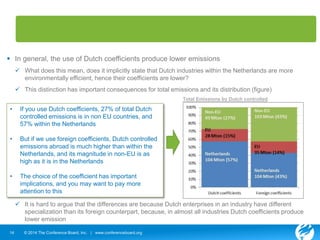

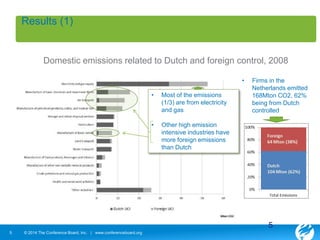
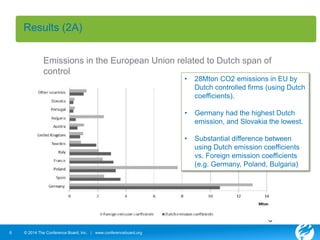
This document summarizes a study that quantifies CO2 emissions according to the control criterion of enterprises on a global scale. The study develops a new approach to allocate emissions based on the "span of control" or ultimate controlling institute of an enterprise. The results show that Dutch controlled emissions total 242 million tons, with 57% emitted abroad. Emissions in the EU are largely from Germany, Spain, and Poland in chemical, basic metals, and warehousing industries. Non-EU emissions are highest in the US, Canada, China, and Brazil in mining, chemicals, and food. Foreign control accounts for 38% of Dutch emissions, largely from energy and chemicals. The study is still developing but provides insight into allocating emissions according to


![Session 7 b commentson daneilkerpaperonukr&d servicelives2014iariw[1]](https://cdn.slidesharecdn.com/ss_thumbnails/pwfpecwntsmdld64j1xg-signature-6de5ee34a7e0a8be608105cfc95b1f55459403214875a488c94e063931d3b0c1-poli-140830080216-phpapp01-thumbnail.jpg?width=640&height=640&fit=bounds)


