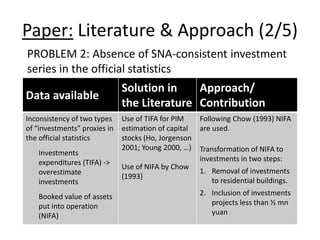
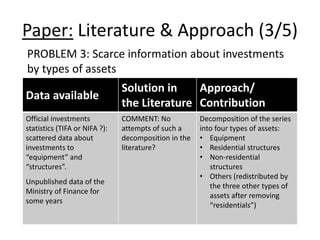
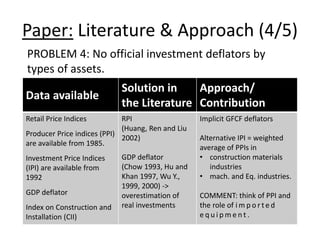
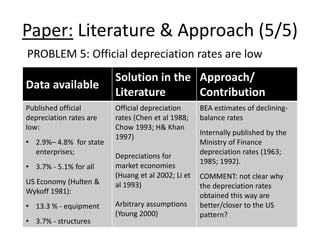
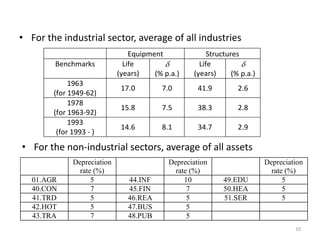
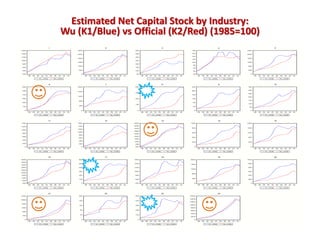
Call Girls In Yusuf Sarai Women Seeking Men 9654467111
Session 7 b 2014 08-29 voskob wu
1. Measuring Capital Stock and Capital
Services in China, 1949-2012
Author: Harry X. Wu
(Hitotsubashi University)
Discussant: Ilya B. Voskoboynikov
(Higher School of Economics and GGDC)
IARIW 33rd General Conference. Session 7B, August 29, 2014
2. Paper: Research Question (1/2)
• What has been happening with capital input in industries
of the Chinese economy in 1949-2012?
• The present study aims to
• extend the author’s earlier efforts in this on the
industrial sector and non-industrial sector
(Wu and Xu 2002; Wu 2008, 2013);
• integrate all sectors of the economy;
• reconcile the results with the System of National
Accounts for China.
3. Paper: Research Question (2/2)
• The priority of the study is building capital input series
with
• making the best use of all relevant data available;
• focusing on measurement issues rather than
developing theoretical or methodological aspects of
the problem.
• Motivation
• Appropriate industries-level capital series are
essential for the p r o d u c t i v i t y a n a l y s i s .
4. Paper: Literature & Approach (1/5)
PROBLEM 1: No unified indust r ial
c las s i f icat ion for the whole period in question
Data available
Solution in the
Literature
Approach/
Contribution
Data reported in the
official statistics before
1994 in different and
often inconsistent
classifications.
The China Industrial
Productivity (CIP)
Database Project cover
the entire economy at
the industry level in
1980-2010
Ignored by most
researchers, because of
the lack of information
for adjustments.
Some previous studies
of Wu (e.g. 2013)
From top to bottom, SNA-based:
Control of total sums.
Industry sectors:
The Chinese Standard Industrial
Classification (CSIC), v.2002.
CSIC, ver. 2012 for services.
COMMENT: more information is
expected about the approach
used.
5. Paper: Literature & Approach (2/5)
PROBLEM 2: Absence of SNA-consistent investment
series in the official statistics
Data available
Solution in
the Literature
Approach/
Contribution
Inconsistency of two types
of “investments” proxies in
the official statistics
Investments
expenditures (TIFA) ->
overestimate
investments
Booked value of assets
put into operation
(NIFA)
Use of TIFA for PIM
estimation of capital
stocks (Ho, Jorgenson
2001; Young 2000, …)
Use of NIFA by Chow
(1993)
Following Chow (1993) NIFA
are used.
Transformation of NIFA to
investments in two steps:
1. Removal of investments
to residential buildings.
2. Inclusion of investments
projects less than ½ mn
yuan
6. Paper: Literature & Approach (3/5)
PROBLEM 3: Scarce information about investments
by types of assets
Data available
Solution in
the Literature
Approach/
Contribution
Official investments
statistics (TIFA or NIFA ?):
scattered data about
investments to
“equipment” and
“structures”.
Unpublished data of the
Ministry of Finance for
some years
COMMENT: No
attempts of such a
decomposition in the
literature?
Decomposition of the series
into four types of assets:
• Equipment
• Residential structures
• Non-residential
structures
• Others (redistributed by
the three other types of
assets after removing
“residentials”)
7. Paper: Literature & Approach (4/5)
PROBLEM 4: No official investment deflators by
types of assets.
Data available
Solution in
the Literature
Approach/
Contribution
Retail Price Indices
Producer Price indices (PPI)
are available from 1985.
Investment Price Indices
(IPI) are available from
1992
GDP deflator
Index on Construction and
Installation (CII)
RPI
(Huang, Ren and Liu
2002)
GDP deflator
(Chow 1993, Hu and
Khan 1997, Wu Y.,
1999, 2000) ->
overestimation of
real investments
Implicit GFCF deflators
Alternative IPI = weighted
average of PPIs in
• construction materials
industries
• mach. and Eq. industries.
COMMENT: think of PPI and
the role of imp o r t e d
e q u i pme n t .
8. Price deflators for fixed asset investment
300
250
200
150
100
50
0
1952
1956
1960
1964
1968
1972
1976
1980
1984
1988
1992
1996
2000
2004
2008
2012
Incomplete, strictly no citation please
1990 = 100
NBS GFCF-IPI Alternative IPI
Bdng mat. PPI Machinery PPI
140
130
120
110
100
90
80
70
Last year = 100
1952
1956
1960
1964
1968
1972
1976
1980
1984
1988
1992
1996
2000
2004
2008
2012
NBS GFCF-IPI Alternative IPI
9. Paper: Literature & Approach (5/5)
PROBLEM 5: Official depreciation rates are low
Data available
Solution in the
Literature
Approach/
Contribution
Published official
depreciation rates are
low:
• 2.9%– 4.8% for state
enterprises;
• 3.7% - 5.1% for all
US Economy (Hulten &
Wykoff 1981):
• 13.3 % - equipment
• 3.7% - structures
Official depreciation
rates (Chen et al 1988;
Chow 1993; H& Khan
1997)
Depreciations for
market economies
(Huang et al 2002; Li et
al 1993)
Arbitrary assumptions
(Young 2000)
BEA estimates of declining-balance
rates
Internally published by the
Ministry of Finance
depreciation rates (1963;
1985; 1992).
COMMENT: not clear why
the depreciation rates
obtained this way are
better/closer to the US
pattern?
10. 10
• For the industrial sector, average of all industries
Equipment Structures
Benchmarks
Life
(years)
(% p.a.)
Life
(years)
(% p.a.)
1963
(for 1949-62)
17.0 7.0 41.9 2.6
1978
(for 1963-92)
15.8 7.5 38.3 2.8
1993
(for 1993 - )
14.6 8.1 34.7 2.9
• For the non-industrial sectors, average of all assets
Depreciation
rate (%)
Depreciation
rate (%)
Depreciation
rate (%)
01.AGR 5 44.INF 10 49.EDU 5
40.CON 7 45.FIN 7 50.HEA 5
41.TRD 5 46.REA 5 51.SER 5
42.HOT 5 47.BUS 5
43.TRA 7 48.PUB 5
12. Discussion: General Comments
• The following sections of the paper are expected:
• User Cost of Capital and Estimates of Capital services;
• Sources of data for the industrial sector;
• Estimating Investment Flows for the Nonindustrial
Sectors;
• Concluding remarks.
• The list of references has not been completed.
• Structure: Informal economy unexpectedly appears in
section 8.
13. Discussion: Choosing Perspective (1/2)
PROBLEM: Why are the new numbers better than the old ones?
Clear perspective: what is the data compiled for?
Empirical strategy
Priorities
Choices
“New numbers are better than the old ones, because…”
14. Discussion: Choosing Perspective (2/2)
• Aim of this estimation is not clear
• SNA/Consumption of fixed capital OR productivity
analysis?
• SNA: (Schreyer 2001;2009)
• PIM versus direct observations for capital stocks
(Bratanova 2003)
• Chinese economy in time OR in the comparative
perspective (e.g. World KLEMS framework)?
• China itself – specific depreciation rates;
• World KLEMS – comparative framework;
BEA/(Fraumeni 1997) depreciation rates
15. Discussion: Some Suggestions
• What is the aim of this capital series construction: growth accounting,
consumption of fixed capital for SNA or something else?
• Update terminology in line with Bratanova (2003) and
OECD (2001; 2009)
• Some discussion and further explanations are expected on the concept
of capital stocks and capital services in planned economy
• Literature on capital stocks in planned/transition economies in
comparison with the West (Bergson, Ofer, Maddison, Bratanova)
• Attention to investment deflators! Do we really gain using so detailed
industry level deflators? (signal-noise ratio)
• Quantitative analysis of importance of each adjustment -> update of
the structure of the paper