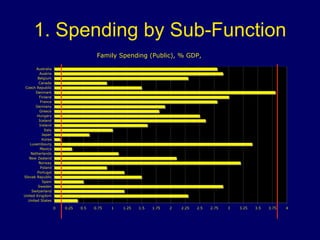
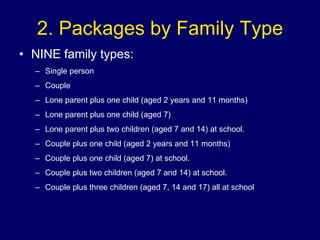
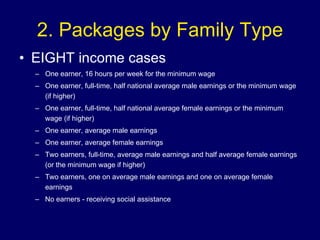
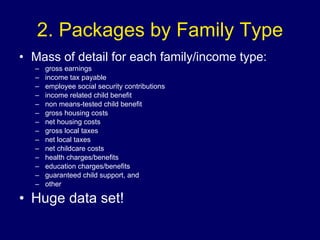
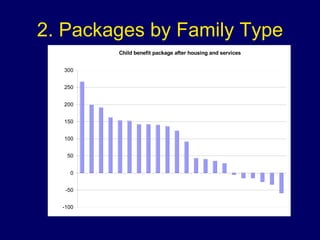
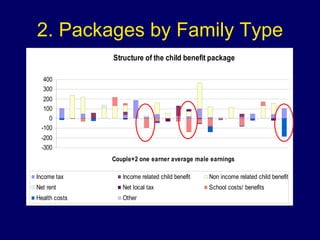
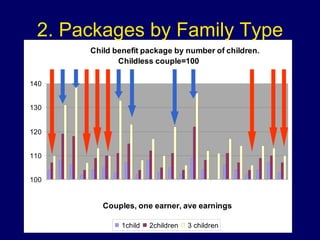
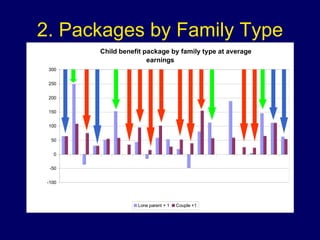
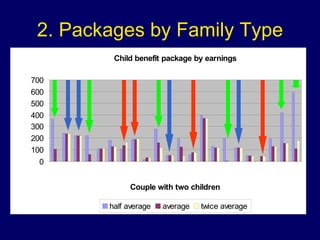
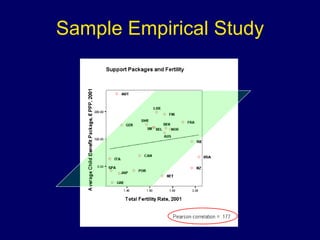
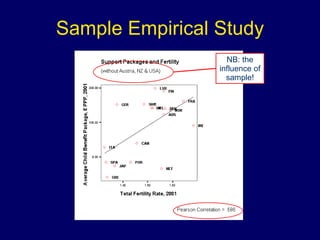
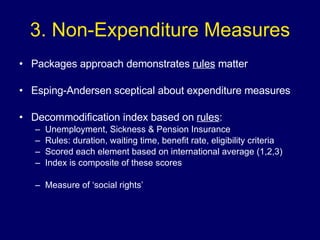
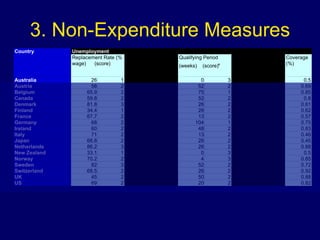
Comparative Social Structures and Welfare Week 8 Comparing Welfare Inputs -  Beyond Spending
Re-Cap Last Week: Began Empirical Comparisons Examined Macro-Inputs  What governments do Broad summary of national welfare state ‘effort’ cf: Outcomes (what happens) cf: Micro-level (lower level detail)
Re-Cap Different Measures of Spending NCU v US$ (PPP) Millions vs per capita % GDP Public v Public & Mandatory Private Spending Voluntary Private Spending Net Social Spending All measures have limitations
Session Objectives Examine Micro-Level Inputs Examine non-spending based input measures Explore some sample micro-input studies ALSO: module assessment!
Micro-Level Welfare-Inputs Measures of ‘Welfare State Effort’ But with more ground level detail Examine Three Examples: Spending by sub-function Packages by different family types Non-expenditure measures Less Common Focus for Studies data less widely available more complex measures less clear link with political debates? Q:  Who spends the most on families with children?
1. Spending by Sub-Function OECD Health Data  package Social Expenditure by sub-category
1. Spending by Sub-Function
1. Spending by Sub-Function What do the figures tell us? Problems: Demographic make-up of nations? Destination of spending? System rules? More detail would be helpful
2. Packages by Family Type Packages: range of supports is commonplace benefits, taxes, services, benefits-in-kind Family Types: family composition  household income levels Useful micro-level data… hard to find!
2. Packages by Family Type Bradshaw & Finch (2002): 22 rich countries Packages of support for families with children Many different family types Collected data from national experts Detailed picture of support arrangements
2. Packages by Family Type NINE family types: Single person Couple Lone parent plus one child (aged 2 years and 11 months)  Lone parent plus one child (aged 7) Lone parent plus two children (aged 7 and 14) at school. Couple plus one child (aged 2 years and 11 months)  Couple plus one child (aged 7) at school. Couple plus two children (aged 7 and 14) at school. Couple plus three children (aged 7, 14 and 17) all at school
2. Packages by Family Type EIGHT income cases One earner, 16 hours per week for the minimum wage One earner, full-time, half national average male earnings or the minimum wage (if higher) One earner, full-time, half national average female earnings or the minimum wage (if higher) One earner, average male earnings One earner, average female earnings Two earners, full-time, average male earnings and half average female earnings (or the minimum wage if higher) Two earners, one on average male earnings and one on average female earnings No earners - receiving social assistance
2. Packages by Family Type Mass of detail for each family/income type: gross earnings income tax payable  employee social security contributions income related child benefit  non means-tested child benefit gross housing costs net housing costs gross local taxes net local taxes  net childcare costs  health charges/benefits  education charges/benefits  guaranteed child support, and  other Huge data set!
2. Packages by Family Type
2. Packages by Family Type Bradshaw & Finch give us RICHER picture Micro-Level analysis Captures variations in treatment of key groups Clearer picture of how systems function Better picture of level of support Very expensive to conduct studies…
Sample Empirical Study Does the size of the child benefit package influence: Fertility rates? Child poverty rates? Indicators: Total Fertility Rate (TFR) % children in households with < 50% median income
negative and positive correlations -0.80  strong negative correlation 0.80  strong positive correlation Sample Empirical Study distribution of plots correlation coefficient very  crudely: < 0.25    no correlation 0.25-0.5   weak correlation 0.5-0.75   moderate correlation 0.75   strong correlation
Sample Empirical Study
Sample Empirical Study NB: the influence of sample!
3. Non-Expenditure Measures Packages approach demonstrates  rules  matter Esping-Andersen sceptical about expenditure measures Decommodification index based on  rules : Unemployment, Sickness & Pension Insurance Rules: duration, waiting time, benefit rate, eligibility criteria Scored each element based on international average (1,2,3) Index is composite of these scores  Measure of ‘social rights’
3. Non-Expenditure Measures
3. Non-Expenditure Measures Decommodification Index (DI) a micro-input measure Widely used in the literature BUT:  Difficult to calculate Data patchy (1980 only!) Complex to explain Some attempts to repeat and extend DI Scruggs & Allan Bambra ALSO: no good for family & children question…
Conclusion Micro-Inputs Richer picture than overall spending levels Pros Truer picture? Can capture variations in treatment of groups Reflect rules of systems better Cons best measures patchy? too narrow a picture? may only tell us about one aspect of welfare? Macro & Micro Inputs cannot tell us about outcomes…

Comparative Week 8

  • 1.
    Comparative Social Structuresand Welfare Week 8 Comparing Welfare Inputs - Beyond Spending
  • 2.
    Re-Cap Last Week:Began Empirical Comparisons Examined Macro-Inputs What governments do Broad summary of national welfare state ‘effort’ cf: Outcomes (what happens) cf: Micro-level (lower level detail)
  • 3.
    Re-Cap Different Measuresof Spending NCU v US$ (PPP) Millions vs per capita % GDP Public v Public & Mandatory Private Spending Voluntary Private Spending Net Social Spending All measures have limitations
  • 4.
    Session Objectives ExamineMicro-Level Inputs Examine non-spending based input measures Explore some sample micro-input studies ALSO: module assessment!
  • 5.
    Micro-Level Welfare-Inputs Measuresof ‘Welfare State Effort’ But with more ground level detail Examine Three Examples: Spending by sub-function Packages by different family types Non-expenditure measures Less Common Focus for Studies data less widely available more complex measures less clear link with political debates? Q: Who spends the most on families with children?
  • 6.
    1. Spending bySub-Function OECD Health Data package Social Expenditure by sub-category
  • 7.
    1. Spending bySub-Function
  • 8.
    1. Spending bySub-Function
  • 9.
    1. Spending bySub-Function What do the figures tell us? Problems: Demographic make-up of nations? Destination of spending? System rules? More detail would be helpful
  • 10.
    2. Packages byFamily Type Packages: range of supports is commonplace benefits, taxes, services, benefits-in-kind Family Types: family composition household income levels Useful micro-level data… hard to find!
  • 11.
    2. Packages byFamily Type Bradshaw & Finch (2002): 22 rich countries Packages of support for families with children Many different family types Collected data from national experts Detailed picture of support arrangements
  • 12.
    2. Packages byFamily Type NINE family types: Single person Couple Lone parent plus one child (aged 2 years and 11 months) Lone parent plus one child (aged 7) Lone parent plus two children (aged 7 and 14) at school. Couple plus one child (aged 2 years and 11 months) Couple plus one child (aged 7) at school. Couple plus two children (aged 7 and 14) at school. Couple plus three children (aged 7, 14 and 17) all at school
  • 13.
    2. Packages byFamily Type EIGHT income cases One earner, 16 hours per week for the minimum wage One earner, full-time, half national average male earnings or the minimum wage (if higher) One earner, full-time, half national average female earnings or the minimum wage (if higher) One earner, average male earnings One earner, average female earnings Two earners, full-time, average male earnings and half average female earnings (or the minimum wage if higher) Two earners, one on average male earnings and one on average female earnings No earners - receiving social assistance
  • 14.
    2. Packages byFamily Type Mass of detail for each family/income type: gross earnings income tax payable employee social security contributions income related child benefit non means-tested child benefit gross housing costs net housing costs gross local taxes net local taxes net childcare costs health charges/benefits education charges/benefits guaranteed child support, and other Huge data set!
  • 15.
    2. Packages byFamily Type
  • 16.
    2. Packages byFamily Type
  • 17.
    2. Packages byFamily Type
  • 18.
    2. Packages byFamily Type
  • 19.
    2. Packages byFamily Type
  • 20.
    2. Packages byFamily Type Bradshaw & Finch give us RICHER picture Micro-Level analysis Captures variations in treatment of key groups Clearer picture of how systems function Better picture of level of support Very expensive to conduct studies…
  • 21.
    Sample Empirical StudyDoes the size of the child benefit package influence: Fertility rates? Child poverty rates? Indicators: Total Fertility Rate (TFR) % children in households with < 50% median income
  • 22.
    negative and positivecorrelations -0.80 strong negative correlation 0.80 strong positive correlation Sample Empirical Study distribution of plots correlation coefficient very crudely: < 0.25 no correlation 0.25-0.5 weak correlation 0.5-0.75 moderate correlation 0.75 strong correlation
  • 23.
  • 24.
  • 25.
    Sample Empirical StudyNB: the influence of sample!
  • 26.
    3. Non-Expenditure MeasuresPackages approach demonstrates rules matter Esping-Andersen sceptical about expenditure measures Decommodification index based on rules : Unemployment, Sickness & Pension Insurance Rules: duration, waiting time, benefit rate, eligibility criteria Scored each element based on international average (1,2,3) Index is composite of these scores Measure of ‘social rights’
  • 27.
  • 28.
    3. Non-Expenditure MeasuresDecommodification Index (DI) a micro-input measure Widely used in the literature BUT: Difficult to calculate Data patchy (1980 only!) Complex to explain Some attempts to repeat and extend DI Scruggs & Allan Bambra ALSO: no good for family & children question…
  • 29.
    Conclusion Micro-Inputs Richerpicture than overall spending levels Pros Truer picture? Can capture variations in treatment of groups Reflect rules of systems better Cons best measures patchy? too narrow a picture? may only tell us about one aspect of welfare? Macro & Micro Inputs cannot tell us about outcomes…