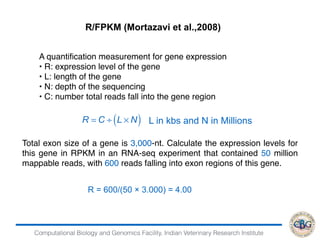
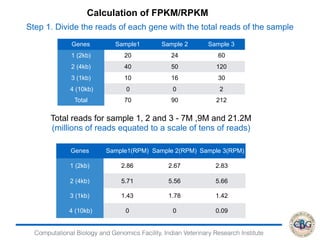
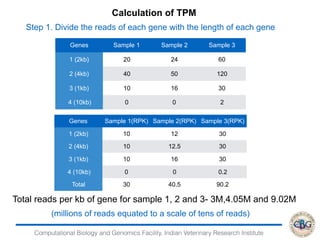
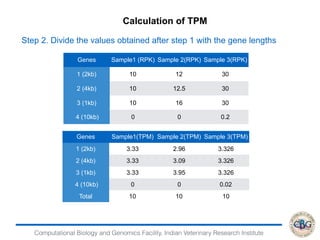
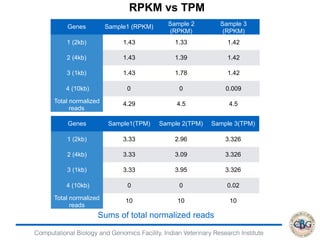
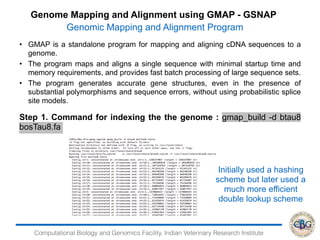
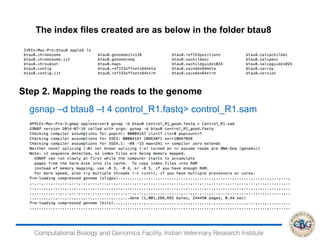
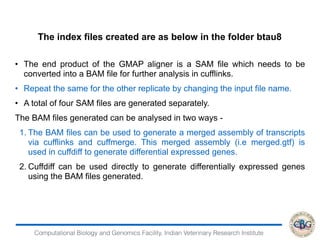
This document discusses various methods for normalization of RNA-seq read count data, including RPKM/FPKM, TMM, Limma voom, and TPM. It provides explanations of each method and how they aim to correct for differences in sequencing depth, transcript length, and transcript pool composition between samples. The document also provides examples of calculating RPKM, TPM, and comparing the two methods. Lastly, it discusses using tools like RSEM, Bowtie, and EBSeq for determining differentially expressed genes from RNA-seq data through a count-based strategy.
Genotyping by Sequencing is a robust,fast and cheap approach for high throughput marker discovery.It has applications in crop improvement programs by enhancing identification of superior genotypes.
Abstract: The focus in this session will be put on the differences between standard DNA mapping and RNAseq-specific transcript mapping: identifying splice variants and isoforms. The issue of transcript quantification and genomic variants that can be identified from RNAseq data will be discussed.
The quality of data is very important for various downstream analyses, such as sequence assembly, single nucleotide polymorphisms identification this ppt show parameters for
NGS Data quality check and Dataformat of top sequencing machine
Strategies for mapping of genes for agronomic traits in plantstusharamodugu
The genomic regions associated with the expression of a quantitative trait is referred to as quantitative trait loci (QTL).
A QTL may contain one or more genes affecting the concerned quantitative trait.
Sax(1923) reported linkage between seed coat colour and seed size, which are qualitative and quantitative traits in common bean and the work highlighted the basic principles for mapping of polygenes based on the detection of association between a quantitative trait phenotype and a genetic marker.
Thoday (1961) explored this QTL concept further by combining elaborate cytogenetic techniques with genetic analysis to map QTLs for several quantitative traits in Drosophila
RNA Sequence data analysis,Transcriptome sequencing, Sequencing steady state RNA in a sample is known as RNA-Seq. It is free of limitations such as prior knowledge about the organism is not required.
RNA-Seq is useful to unravel inaccessible complexities of transcriptomics such as finding novel transcripts and isoforms.
Data set produced is large and complex; interpretation is not straight forward.
Microsatellite are powerful DNA markers for quantifying genetic variations within & between populations of a species, also called as STR, SSR, VNTR. Tandemly repeated DNA sequences with the repeat/size of 1 – 6 bases repeated several times
Presentation to cover the data and file formats commonly used in next generation sequencing (high throughput sequencing) analyses. From nucleotide ambiguity codes, FASTA and FASTQ, quality scores to SAM and BAM, CIGAR strings and variant calling format. This was given as part of the EPIZONE Workshop on Next Generation Sequencing applications and Bioinformatics in Brussels, Belgium in April 2016.
Presentation delivered by Dr. Jesse Poland (Kansas State University, USA) at Borlaug Summit on Wheat for Food Security. March 25 - 28, 2014, Ciudad Obregon, Mexico.
http://www.borlaug100.org
Forensic Sciences (DNA Fingerprinting) STR Typing - Case Reportnarmeenarshad
Identification of Human Remains by DNA Analysis of the gastrointestinal contents of Fly Larvae
A case Report that has been explained in form of presentation.
Genetic algorithm guided key generation in wireless communication (gakg)IJCI JOURNAL
In this paper, the proposed technique use high speed stream cipher approach because this approach is useful where less memory and maximum speed is required for encryption process. In this proposed approach Self Acclimatize Genetic Algorithm based approach is exploits to generate the key stream for encrypt / decrypt the plaintext with the help of key stream. A widely practiced approach to identify a good set of parameters for a problem is through experimentation. For these reasons, proposed enhanced Self Acclimatize Genetic Algorithm (GAKG) offering the most appropriate exploration and exploitation behavior. Parametric tests are done and results are compared with some existing classical techniques, which shows comparable results for the proposed system.
Welcome to the June 25-26, 2018 Workshop on – 2 Day Workshop on Transcriptomic Data Analysis….
Below you should see an embedded video stream. You can open the stream to fill the full screen to observe or join the workshop as a participant with the link that was emailed to you. If you did not get the link, use the chat box on the bottom right to request the link with your registered email ID.
While Phosphorous (31P) MRS (I) has been promising in experimental and clinical settings since the early 70s, it has been beset by prohibitively lower sensitivity, limited spectral-spatial resolution, and prolonged acquisition. This manuscript and proceedings of the annual scientific meeting of ISMRM in 2022 (REF1) and 2023 (REF2) demonstrate that our novel acquisition strategy, the novel Rosette Trajectory for fast and flexible MR(S)I contrast (Shen et al. 2023 (REF3), later we renamed it as PETALUTE after the translation to the preclinical scanners of 7T and 9.4T), enables operator-independent (1) rapid acquisition (~7 minutes), (2) reconstruction, and (3) processing pipeline, resulting in phosphorous metabolite ratio maps (10 x 10 x 10 mm3) of the whole brain.
In response to the “Repeat it with Me” challenge organized by the Reproducible Research study group of ISMRM, we demonstrated the power of this technique in 5 healthy volunteers at three different institutions with different experimental setups (2nd Place: UTE 31P 3D Rosette MRSI Reproducibility Team, REF4). Since the proposed acquisition/reconstruction/processing pipeline was operator/scanner/coil-independent, the Reproducer sub-teams successfully replicated the findings of the original proceeding in 2022 (REF1). As part of this challenge, we provided some MATLAB scripts and k-space data to reproduce some of the results described in this manuscript. The software and data can be downloaded from https://purr.purdue.edu/projects/ismrm31pmrsi.
These results will likely be of broad interest across clinical settings since the proposed acquisition strategy is not specific to any region, nuclei, or magnetic field and is operator-independent. This study's resolution and signal-to-noise ratios permit the metabolite maps in an experimentally and clinically feasible timeframe at 3 Tesla and 7T.
REF1 Bozymski B, Shen X, Ozen AC, Ibey S, Chiew M, Thomas A, Dydak U, Emir UE. Ultra-Short Echo Time 31P 3D MRSI at 3T with Novel Rosette k-space Trajectory. Proceedings 30th Scientific Meeting, International Society for Magnetic Resonance in Medicine, 2022.
REF2 Farley N, Bozymski B, Dydak U, Emir UE*. Fast 3D 31P MRSI Using Novel Rosette Petal Trajectory at 3T with x4 Accelerated Compressed Sensing. Proceedings 31st Scientific Meeting, International Society for Magnetic Resonance in Medicine, 2023.
REF3 Shen X, Özen AC, Sunjar A, Ilbey S, Sawiak S, Shi R, Chiew M, Emir UE. Ultrashort T2 components imaging of the whole brain using 3D dual-echo UTE MRI with rosette k-space pattern. Magnetic Resonance in Medicine. 2023;89(2):508–521.
REF4 https://challenge.ismrm.org/2023-24-reproducibility-challenge/results-22-23/
Basics of Primer designing.
Steps involved in designing primers for Prokaryotic expression
Steps involved in designing primers for Eukaryotic expression
Embracing GenAI - A Strategic ImperativePeter Windle
Artificial Intelligence (AI) technologies such as Generative AI, Image Generators and Large Language Models have had a dramatic impact on teaching, learning and assessment over the past 18 months. The most immediate threat AI posed was to Academic Integrity with Higher Education Institutes (HEIs) focusing their efforts on combating the use of GenAI in assessment. Guidelines were developed for staff and students, policies put in place too. Innovative educators have forged paths in the use of Generative AI for teaching, learning and assessments leading to pockets of transformation springing up across HEIs, often with little or no top-down guidance, support or direction.
This Gasta posits a strategic approach to integrating AI into HEIs to prepare staff, students and the curriculum for an evolving world and workplace. We will highlight the advantages of working with these technologies beyond the realm of teaching, learning and assessment by considering prompt engineering skills, industry impact, curriculum changes, and the need for staff upskilling. In contrast, not engaging strategically with Generative AI poses risks, including falling behind peers, missed opportunities and failing to ensure our graduates remain employable. The rapid evolution of AI technologies necessitates a proactive and strategic approach if we are to remain relevant.
A Strategic Approach: GenAI in EducationPeter Windle
Artificial Intelligence (AI) technologies such as Generative AI, Image Generators and Large Language Models have had a dramatic impact on teaching, learning and assessment over the past 18 months. The most immediate threat AI posed was to Academic Integrity with Higher Education Institutes (HEIs) focusing their efforts on combating the use of GenAI in assessment. Guidelines were developed for staff and students, policies put in place too. Innovative educators have forged paths in the use of Generative AI for teaching, learning and assessments leading to pockets of transformation springing up across HEIs, often with little or no top-down guidance, support or direction.
This Gasta posits a strategic approach to integrating AI into HEIs to prepare staff, students and the curriculum for an evolving world and workplace. We will highlight the advantages of working with these technologies beyond the realm of teaching, learning and assessment by considering prompt engineering skills, industry impact, curriculum changes, and the need for staff upskilling. In contrast, not engaging strategically with Generative AI poses risks, including falling behind peers, missed opportunities and failing to ensure our graduates remain employable. The rapid evolution of AI technologies necessitates a proactive and strategic approach if we are to remain relevant.
June 3, 2024 Anti-Semitism Letter Sent to MIT President Kornbluth and MIT Cor...Levi Shapiro
Letter from the Congress of the United States regarding Anti-Semitism sent June 3rd to MIT President Sally Kornbluth, MIT Corp Chair, Mark Gorenberg
Dear Dr. Kornbluth and Mr. Gorenberg,
The US House of Representatives is deeply concerned by ongoing and pervasive acts of antisemitic
harassment and intimidation at the Massachusetts Institute of Technology (MIT). Failing to act decisively to ensure a safe learning environment for all students would be a grave dereliction of your responsibilities as President of MIT and Chair of the MIT Corporation.
This Congress will not stand idly by and allow an environment hostile to Jewish students to persist. The House believes that your institution is in violation of Title VI of the Civil Rights Act, and the inability or
unwillingness to rectify this violation through action requires accountability.
Postsecondary education is a unique opportunity for students to learn and have their ideas and beliefs challenged. However, universities receiving hundreds of millions of federal funds annually have denied
students that opportunity and have been hijacked to become venues for the promotion of terrorism, antisemitic harassment and intimidation, unlawful encampments, and in some cases, assaults and riots.
The House of Representatives will not countenance the use of federal funds to indoctrinate students into hateful, antisemitic, anti-American supporters of terrorism. Investigations into campus antisemitism by the Committee on Education and the Workforce and the Committee on Ways and Means have been expanded into a Congress-wide probe across all relevant jurisdictions to address this national crisis. The undersigned Committees will conduct oversight into the use of federal funds at MIT and its learning environment under authorities granted to each Committee.
• The Committee on Education and the Workforce has been investigating your institution since December 7, 2023. The Committee has broad jurisdiction over postsecondary education, including its compliance with Title VI of the Civil Rights Act, campus safety concerns over disruptions to the learning environment, and the awarding of federal student aid under the Higher Education Act.
• The Committee on Oversight and Accountability is investigating the sources of funding and other support flowing to groups espousing pro-Hamas propaganda and engaged in antisemitic harassment and intimidation of students. The Committee on Oversight and Accountability is the principal oversight committee of the US House of Representatives and has broad authority to investigate “any matter” at “any time” under House Rule X.
• The Committee on Ways and Means has been investigating several universities since November 15, 2023, when the Committee held a hearing entitled From Ivory Towers to Dark Corners: Investigating the Nexus Between Antisemitism, Tax-Exempt Universities, and Terror Financing. The Committee followed the hearing with letters to those institutions on January 10, 202
Honest Reviews of Tim Han LMA Course Program.pptxtimhan337
Personal development courses are widely available today, with each one promising life-changing outcomes. Tim Han’s Life Mastery Achievers (LMA) Course has drawn a lot of interest. In addition to offering my frank assessment of Success Insider’s LMA Course, this piece examines the course’s effects via a variety of Tim Han LMA course reviews and Success Insider comments.
Normal Labour/ Stages of Labour/ Mechanism of LabourWasim Ak
Normal labor is also termed spontaneous labor, defined as the natural physiological process through which the fetus, placenta, and membranes are expelled from the uterus through the birth canal at term (37 to 42 weeks
Operation “Blue Star” is the only event in the history of Independent India where the state went into war with its own people. Even after about 40 years it is not clear if it was culmination of states anger over people of the region, a political game of power or start of dictatorial chapter in the democratic setup.
The people of Punjab felt alienated from main stream due to denial of their just demands during a long democratic struggle since independence. As it happen all over the word, it led to militant struggle with great loss of lives of military, police and civilian personnel. Killing of Indira Gandhi and massacre of innocent Sikhs in Delhi and other India cities was also associated with this movement.
Introduction to AI for Nonprofits with Tapp NetworkTechSoup
Dive into the world of AI! Experts Jon Hill and Tareq Monaur will guide you through AI's role in enhancing nonprofit websites and basic marketing strategies, making it easy to understand and apply.
The French Revolution, which began in 1789, was a period of radical social and political upheaval in France. It marked the decline of absolute monarchies, the rise of secular and democratic republics, and the eventual rise of Napoleon Bonaparte. This revolutionary period is crucial in understanding the transition from feudalism to modernity in Europe.
For more information, visit-www.vavaclasses.com
The French Revolution Class 9 Study Material pdf free download
RSEM and DE packages
1. Computational Biology and Genomics Facility, Indian Veterinary Research Institute
Revision
Normalization and cufflinks
2. Computational Biology and Genomics Facility, Indian Veterinary Research Institute
Normalization of read count
R/FPKM (Mortazavi et al.,2008) - Reads/Fragment per kilobase of exon
per million mappable reads
• Corrects for: differences in sequencing depth and transcript length
• Aiming to: compare a gene across samples and different genes within
samples
TMM (Robinson and Oshlack., 2010) - Trimmed mean of M values
• Corrects for: differences in transcript pool composition; extreme outliers
• Aiming to: provide better across-sample comparability
3. Computational Biology and Genomics Facility, Indian Veterinary Research Institute
Normalization of read count
Limma voom (LogCPM) (Law et al.,2013) - Counts per million
• Aiming to: Stabilize variance, removes dependence of variance on the
mean
TPM (Li etal 2010, Wagner et al 2012) - Transcripts per million
• Corrects for: transcript length distribution in RNA pool
• Aiming to: provide better across-sample comparability
4. Computational Biology and Genomics Facility, Indian Veterinary Research Institute
• FPKM for paired end reads and RPKM for single end reads
• Fragment means fragment of DNA, so the two reads that
comprise a paired-end read count as one.
• Per kilobase of exon means the counts of fragments are then
normalized by dividing by the total length of all exons in the gene.
• This bit of magic makes it possible to compare Gene A to Gene B
even if they are of different lengths.
• Per million reads means this value is then normalized against the
library size.
• This bit of magic makes it possible to compare Gene A in Sample
1 to Sample 2
R/FPKM (Mortazavi et al.,2008)
5. Computational Biology and Genomics Facility, Indian Veterinary Research Institute
A quantification measurement for gene expression
• R: expression level of the gene
• L: length of the gene
• N: depth of the sequencing
• C: number total reads fall into the gene region
R/FPKM (Mortazavi et al.,2008)
Total exon size of a gene is 3,000-nt. Calculate the expression levels for
this gene in RPKM in an RNA-seq experiment that contained 50 million
mappable reads, with 600 reads falling into exon regions of this gene.
R = 600/(50 × 3.000) = 4.00
R = C ÷ L × N( ) L in kbs and N in Millions
6. Computational Biology and Genomics Facility, Indian Veterinary Research Institute
Calculation of FPKM/RPKM
Genes Sample1 Sample 2 Sample 3
1 (2kb) 20 24 60
2 (4kb) 40 50 120
3 (1kb) 10 16 30
4 (10kb) 0 0 2
Total 70 90 212
Total reads for sample 1, 2 and 3 - 7M ,9M and 21.2M
(millions of reads equated to a scale of tens of reads)
Step 1. Divide the reads of each gene with the total reads of the sample
Genes Sample1(RPM) Sample 2(RPM) Sample 3(RPM)
1 (2kb) 2.86 2.67 2.83
2 (4kb) 5.71 5.56 5.66
3 (1kb) 1.43 1.78 1.42
4 (10kb) 0 0 0.09
7. Computational Biology and Genomics Facility, Indian Veterinary Research Institute
Fragments/Reads per kilobase per million of reads
Reads are scaled for both depth and length
Step 2. Divide the values obtained after step 1 with the gene lengths
Genes Sample1 (RPKM) Sample 2
(RPKM)
Sample 3
(RPKM)
1 (2kb) 1.43 1.33 1.42
2 (4kb) 1.43 1.39 1.42
3 (1kb) 1.43 1.78 1.42
4 (10kb) 0 0 0.009
Total normalized
reads
4.29 4.5 4.5
8. Computational Biology and Genomics Facility, Indian Veterinary Research Institute
Calculation of TPM
Step 1. Divide the reads of each gene with the length of each gene
Genes Sample 1 Sample 2 Sample 3
1 (2kb) 20 24 60
2 (4kb) 40 50 120
3 (1kb) 10 16 30
4 (10kb) 0 0 2
Total reads per kb of gene for sample 1, 2 and 3- 3M,4.05M and 9.02M
Genes Sample 1(RPK) Sample 2(RPK) Sample 3(RPK)
1 (2kb) 10 12 30
2 (4kb) 10 12.5 30
3 (1kb) 10 16 30
4 (10kb) 0 0 0.2
Total 30 40.5 90.2
(millions of reads equated to a scale of tens of reads)
9. Computational Biology and Genomics Facility, Indian Veterinary Research Institute
Step 2. Divide the values obtained after step 1 with the gene lengths
Genes Sample1(TPM) Sample 2(TPM) Sample 3(TPM)
1 (2kb) 3.33 2.96 3.326
2 (4kb) 3.33 3.09 3.326
3 (1kb) 3.33 3.95 3.326
4 (10kb) 0 0 0.02
Total 10 10 10
Genes Sample1 (RPK) Sample 2(RPK) Sample 3(RPK)
1 (2kb) 10 12 30
2 (4kb) 10 12.5 30
3 (1kb) 10 16 30
4 (10kb) 0 0 0.2
Calculation of TPM
10. Computational Biology and Genomics Facility, Indian Veterinary Research Institute
RPKM vs TPM
Genes Sample1 (RPKM) Sample 2
(RPKM)
Sample 3
(RPKM)
1 (2kb) 1.43 1.33 1.42
2 (4kb) 1.43 1.39 1.42
3 (1kb) 1.43 1.78 1.42
4 (10kb) 0 0 0.009
Total normalized
reads
4.29 4.5 4.5
Genes Sample1(TPM) Sample 2(TPM) Sample 3(TPM)
1 (2kb) 3.33 2.96 3.326
2 (4kb) 3.33 3.09 3.326
3 (1kb) 3.33 3.95 3.326
4 (10kb) 0 0 0.02
Total normalized
reads
10 10 10
Sums of total normalized reads
11. Computational Biology and Genomics Facility, Indian Veterinary Research Institute
Eg : if certain genes are very highly expressed in one tissue but not another,
there will be less ‘’sequencing real estate’’ left for the less expressed genes in
that tissue and RPKM normalization (or similar) will give biased expression
values for them compared to the other sample
Equal sequencing depth -> Yellow and green will get lower RPKM in RNA population
1 although the expression levels are actually the same in populations 1 and 2
Robinson and Oshlack Genome Biology 2010, 11: R25, http://genomebiology.com /
2010/11/3/R25
RNA population 1 RNA population 2
TMM – Trimmed Mean of M Value
Attempts to correct for differences in RNA
composition between samples
12. Computational Biology and Genomics Facility, Indian Veterinary Research Institute
Identification of differentially expressed genes
Quality filtered/trimmed RNA-Seq Short reads
FPKM based
strategy
Calculate transcript
abundances
(Cufflinks)
Reference Genome
(Y/N)
Mapping to the reference
(GMAP-GSNAP, Tophat,Bowtie,etc.)
Y
N De novo Transcriptome
assembly (Trinity)
Mapping and detection of
DEGs (RSEM)
Count based
strategy
Generate count data
(RSEM)
Detection of DEGs
(cuffdiff2)
Detection of DEGs
(DESeq, edgeR, EBSeq)
13. Computational Biology and Genomics Facility, Indian Veterinary Research Institute
Genome Mapping and Alignment using GMAP - GSNAP
Genomic Mapping and Alignment Program
• GMAP is a standalone program for mapping and aligning cDNA sequences to a
genome.
• The program maps and aligns a single sequence with minimal startup time and
memory requirements, and provides fast batch processing of large sequence sets.
• The program generates accurate gene structures, even in the presence of
substantial polymorphisms and sequence errors, without using probabilistic splice
site models.
Step 1. Command for indexing the the genome : gmap_build -d btau8
bosTau8.fa
Initially used a hashing
scheme but later used a
much more efficient
double lookup scheme
14. Computational Biology and Genomics Facility, Indian Veterinary Research Institute
The index files created are as below in the folder btau8
gsnap –d btau8 –t 4 control_R1.fastq> control_R1.sam
Step 2. Mapping the reads to the genome
15. Computational Biology and Genomics Facility, Indian Veterinary Research Institute
• The end product of the GMAP aligner is a SAM file which needs to be
converted into a BAM file for further analysis in cufflinks.
• Repeat the same for the other replicate by changing the input file name.
• A total of four SAM files are generated separately.
The BAM files generated can be analysed in two ways -
1. The BAM files can be used to generate a merged assembly of transcripts
via cufflinks and cuffmerge. This merged assembly (i.e merged.gtf) is
used in cuffdiff to generate differential expressed genes.
2. Cuffdiff can be used directly to generate differentially expressed genes
using the BAM files generated.
The index files created are as below in the folder btau8
16. Computational Biology and Genomics Facility, Indian Veterinary Research Institute
./samtools view –bsh aln.sam >aln.bam
-b: Output in the BAM format. -s: Input in the SAM format. –h: Include
header in the output
For the Control sample:
./samtools view –bsh control_R1.sam >control_R1.bam
For the Infected sample:
./samtools view –bsh infected_R1.sam >infected_R1.bam
Step 3. Converting SAM to BAM using samtools
17. Computational Biology and Genomics Facility, Indian Veterinary Research Institute
Command for sorting:./samtools sort aln.bam aln.sorted
Example:
For the Control sample:
./samtools sort control_R1.bam control_R1_sorted
For the Infected sample:
./samtools sort infected_R1.bam infected_R1_sorted
Step 4. Sorting BAM using samtools
18. Computational Biology and Genomics Facility, Indian Veterinary Research Institute
Command for running cufflinks on a BAM file
For the Control sample:
cufflinks -G btau8refflat.gtf -g btau8refflat.gtf -b bosTau8.fa -u -L CN
control_R1_sorted.bam
Step 5. (Option 1) Differential expression using cufflinks,
cuffmerge and cuffdiff.
19. Computational Biology and Genomics Facility, Indian Veterinary Research Institute
For the infected sample:
cufflinks -G btau8refflat.gtf -g btau8refflat.gtf -b bosTau8.fa -u -L CN
infected_R1_sorted.bam
These commands generate transcript.gtf files for each replicate, which are
further used in cuffmerge to generate a merged assembly. This merged
assembly is then used in cuffdiff to generate differentially expressed genes.
20. Computational Biology and Genomics Facility, Indian Veterinary Research Institute
Command for running cuffmerge
cuffmerge -g btau8refflat.gtf -s bosTau8.fa -p 8 assemblies.txt
assemblies.txt is the file with the list of all the GTFs.
This generates a merged.gtf in the merged_asm folder. This file is
used in the next cuffdiff command.
Command for running cuffdiff
cuffdiff merged.gtf control_R1_sorted.bam control_R2_sorted.bam
infected_R1_sorted.bam infected_R2_sorted.bam
This command generates many files, out of which gene_exp.diff is the file
of our concern.
21. Computational Biology and Genomics Facility, Indian Veterinary Research Institute
CuffDiff computes differentially expressed genes in the set. For computing
differential expression at least two samples -infected and control are required.
CuffDiff should always be run on replicates - i.e., N infected vs N control.
Command:
Cuffdiff –p –N transcripts.gtf
-p: num-threads <int>. -N
Running cuffdiff for our BAM files
cuffdiff –p 3 –N bostau8reflat.gtf control_R1_sorted.bam,control_R2_sorted.bam
infected_R1_sorted.bam,infected_R2_sorted.bam –o cuffdiff_out
Step 5. (Option 2) Differential expression using CuffDiff directly
22. Computational Biology and Genomics Facility, Indian Veterinary Research Institute
A unique identifier
describing the object
(gene, transcript, CDS,
primary transcript)
Gene ID
Gene Name
Infected
OK (test successful), NOTEST (not enough alignments
for testing), LOWDATA (too complex or shallowly
sequenced), HIDATA (too many fragments in locus), or
FAIL, when an ill-conditioned covariance matrix or
other numerical exception prevents testing
FPKM in
Sample 1
FPKM in
Sample 2
The (base 2) log
of the fold
change y/x
Genomic coordinates for easy
browsing to the genes or
transcripts being tested.
Control
The value of the test statistic
used to compute significance
of the observed change in
FPKM
The uncorrected
p-value of the test
statistic
gene_exp.diff
Log2fold change = Log2(FPKM infected/FPKM of control)
= Log2(0.576748/3.92513) = -2.76673
23. Computational Biology and Genomics Facility, Indian Veterinary Research Institute
Identification of Differentially expressed genes - I
(using RSEM - EBSeq)
24. Computational Biology and Genomics Facility, Indian Veterinary Research Institute
Quality filtered/trimmed RNA-Seq Short reads
Calculate transcript
abundances
(RSEM)
Reference Genome
Mapping to the reference
(Bowtie)
Detection of DEGs
(DESeq, edgeR,EBSeq)
Downloading the reference
genome and GTF from Ensembl
genome browser
Count based
strategy
25. Computational Biology and Genomics Facility, Indian Veterinary Research Institute
RSEM is a cutting-edge RNASeq analysis package that is an end-to-end
solution for differential expression, and simplifies the whole process. It also
introduces a new more robust unit of RNASeq measurement called TPM.
RSEM (RNA-Seq by Expectation-Maximization)
(Li1 and Dewey., 2011)
Step 1. Downloading RSEM and installing
wget http://deweylab.biostat.wisc.edu/rsem/src/rsem-1.2.19.tar.gz
tar –xvzf rsem-1.2.19.tar.gz
cd rsem-1.2.19/make
Step 2. Prerequisites required for running RSEM : Perl, R and Bowtie are
required to be installed. Perl and R are normally present in most of the
computers.
26. Computational Biology and Genomics Facility, Indian Veterinary Research Institute
Step 3. Downloading Bowtie and installing
Download Bowtie from http://sourceforge.net/projects/bowtie-bio/files/
bowtie/1.1.1/
Step 4. Copy bowtie in your path or add bowtie path in bash
profile
Copying bowtie in your path
sudo cp -R /Users/appleserver/Desktop/bowtie2 /usr/local/bin
add bowtie path in bash profile (preferred)
export PATH="/Users/ravikumar/Desktop/bowtie2:$PATH"
run source ~/.bash_profile
RSEM (RNA-Seq by Expectation-Maximization)
Indicates that the path has been added
echo $PATH - to check whether the path has been added
27. Computational Biology and Genomics Facility, Indian Veterinary Research Institute
Step 5. Downloading the reference,gunzipping and concatenating
Download Bos taurus genome from Ensembl genome browser. An easier
alternative is to use wget command for a direct download on HPC:
wget -m ftp://ftp.ensembl.org/pub/release-81/fasta/bos_taurus/dna/ &or f
in $(find . -name "*.gz")
28. Computational Biology and Genomics Facility, Indian Veterinary Research Institute
The folder that is created is as below
29. Computational Biology and Genomics Facility, Indian Veterinary Research Institute
Direct download of each individual chromosome and gtf from the
ftp site can be done
30. Computational Biology and Genomics Facility, Indian Veterinary Research Institute
The files downloaded are gunzipped using -
gunzip Bos_taurus.UMD3.1.dna.chromosome.*.fa.gz
Concatenating/combining all the fasta file into a combined fasta file
(reference):
cat Bos_taurus.UMD3.1.dna.chromosome.*.fa > combined.fa
Step 6. Download annotation file in gtf format.
Command for downloading : wget –m ftp://ftp.ensembl.org/pub/
release-81/gtf/bos_taurus
The gtf file downloaded needs to be modifies to extract only the exon
annotations.
awk command to extract the exon annotations from gtf:
awk ‘$3 == “exon”’ Bos_taurus.UMD3.1.8.1.gtf> filtered.gtf
31. Computational Biology and Genomics Facility, Indian Veterinary Research Institute
filtered.gtf
original gtf
32. Computational Biology and Genomics Facility, Indian Veterinary Research Institute
Step 7. Prepare reference using RSEM
To prepare the reference sequence, run the ‘rsem-prepare-reference’ program.
The command for preparing the reference running:
./rsem-prepare-reference --gtf filtered.gtf --bowtie2 combined.fa BT
This creates 12 file as index files with the name of BT and extension bt2
33. Computational Biology and Genomics Facility, Indian Veterinary Research Institute
Step 8. Calculating expression values in counts, TPM and FPKM:
To calculate expression values, ‘rsem-calculate-expression’ program.
Command for running rsem-calculate-expression :
For running the control sample:
. /rsem-calculate-expression --bowtie2 control_R1.fastq BT ControlR1
There will be six files generated as shown above. genes.results is the most
important file among the six
For running the Infected sample:
. /rsem-calculate-expression --bowtie2 infected_R1.fastq BT infectedR1
34. Computational Biology and Genomics Facility, Indian Veterinary Research Institute
Step 9. Combining RSEM genes.results of all the files:
RSEM produces “expected counts” or “gene counts” values. After rounding
these expected counts values to the nearest integer - EBSeq, DESeq, or
edgeR to identify differentially expressed genes.
./rsem-generate-data-matrix *.genes.results > genes.results
35. Computational Biology and Genomics Facility, Indian Veterinary Research Institute
EBSeq is an R package for identifying genes and isoforms differentially
expressed (DE) across two or more biological conditions in an RNA-seq
experiment. EBSEq uses RSEM counts as input to identify differentially
expressed genes
Step 1. Installing EBSeq:
To install, type the following commands in R:
source("https://bioconductor.org/biocLite.R")
biocLite("EBSeq")
Step 2. Command for Loading the package EBSeq
>library(EBSeq)
Step 3.Command for getting the working directory
>getwd()
Differentially expression using EBSeq (Leng et al., 2013):
Empirical Bayesian approach for RNA-Seq data analysis
36. Computational Biology and Genomics Facility, Indian Veterinary Research Institute
Step 4. Command for setting the working library
> setwd()
Step 5. Input requirement for Gene level DE analysis:
The input file formats supported by EBSeq are .csv, .xls, or .xlsx, .txt (tab
delimited). In the input file, rows should be the genes and the columns
should be the samples.
Example of the data set in .txt format (genesresult.txt) that is used
here
37. Computational Biology and Genomics Facility, Indian Veterinary Research Institute
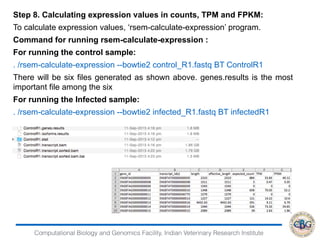
Step 6. Commands to Run EBSeq:
> x=data.matrix(read.table("genesresults.txt"))
> dim(x)
[1] 24596 4
> str(x)
num [1:24596, 1:4] 615 3 0 473 1 286 832 362 103 17 ...
- attr(*, "dimnames")=List of 2
..$ : chr [1:24596] "ENSBTAG00000000005" "ENSBTAG00000000008"
"ENSBTAG00000000009" "ENSBTAG00000000010" ...
..$ : chr [1:4] "infectedR1.genes.results" "infectedR2.genes.results"
"ControlR1.genes.results" "ControlR2.genes.results"
> Sizes=MedianNorm(x)
> EBOut=EBTest(Data=x,
+ Conditions=as.factor(rep(c("C1","C2"),each=2)),sizeFactors=Sizes,
+ maxround=5)
38. Computational Biology and Genomics Facility, Indian Veterinary Research Institute
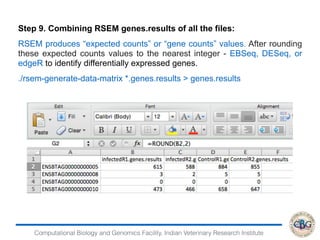
Removing transcripts with 75 th quantile < = 10
12071 transcripts will be tested
iteration 1 done
time 0.12
iteration 2 done
time 0.13
iteration 3 done
time 0.08
iteration 4 done
> PP=GetPPMat(EBOut)
> str(PP)
num [1:12071, 1:2] 1 1 0 0 1 ...
- attr(*, "dimnames")=List of 2
..$ : chr [1:12071] "ENSBTAG00000000005"
"ENSBTAG00000000010" "ENSBTAG00000000012"
"ENSBTAG00000000013" ...
..$ : chr [1:2] "PPEE" "PPDE"
39. Computational Biology and Genomics Facility, Indian Veterinary Research Institute
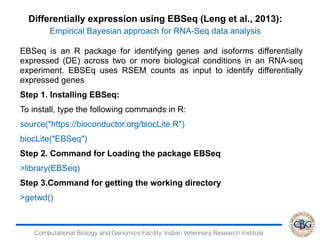
> DEfound=rownames(PP)[which(PP[,"PPDE"]>=.95)]
> str(DEfound)
chr [1:6528] "ENSBTAG00000000012" "ENSBTAG00000000013"
"ENSBTAG00000000015" "ENSBTAG00000000019"
"ENSBTAG00000000021" "ENSBTAG00000000025"
"ENSBTAG00000000026" "ENSBTAG00000000032" ...
> write.table(DEfound,"DE.txt",sep = "t",quote = F,col.names=F)
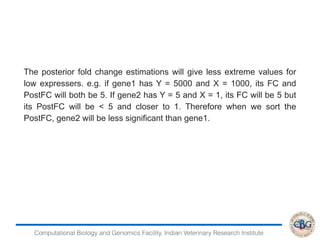
> GeneFC=PostFC(EBOut)
> write.table(GeneFC,"FC.txt",sep = "t",quote = F,col.names=F)
Output
GeneID PostFC Real FC comparison
40. Computational Biology and Genomics Facility, Indian Veterinary Research Institute
The posterior fold change estimations will give less extreme values for
low expressers. e.g. if gene1 has Y = 5000 and X = 1000, its FC and
PostFC will both be 5. If gene2 has Y = 5 and X = 1, its FC will be 5 but
its PostFC will be < 5 and closer to 1. Therefore when we sort the
PostFC, gene2 will be less significant than gene1.