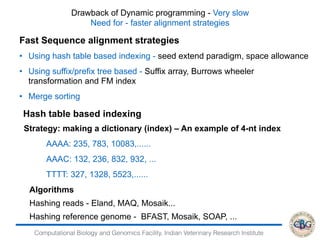
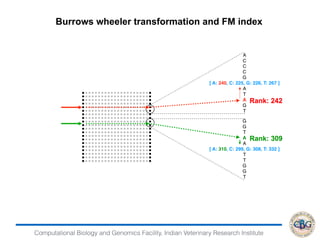
1. The document discusses various strategies for RNA-seq data analysis including fast sequence alignment strategies using hash tables and suffix trees.
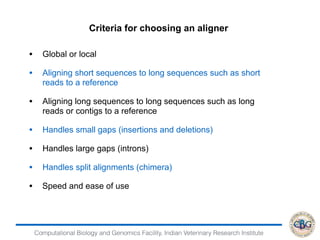
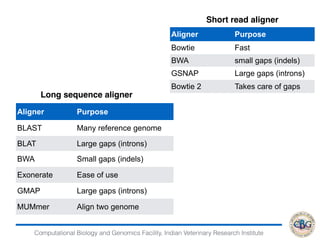
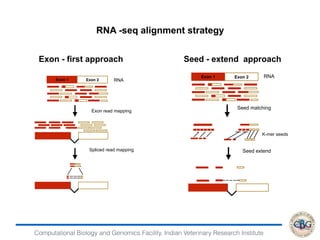
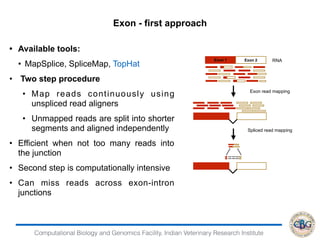
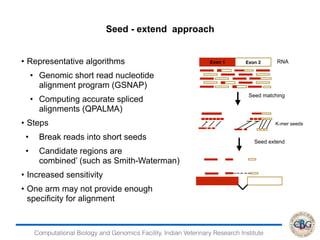
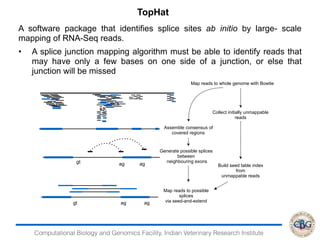
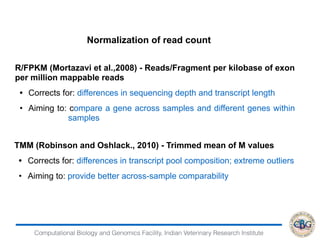
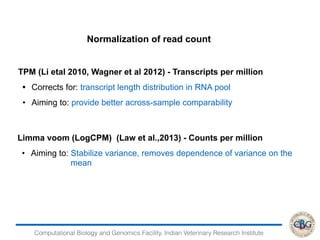
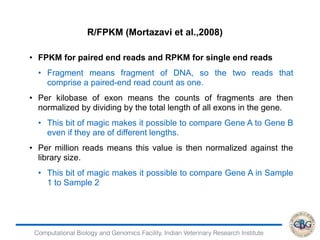
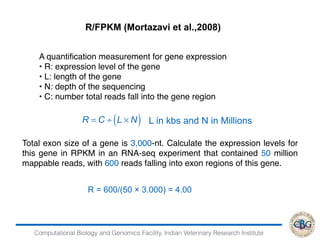
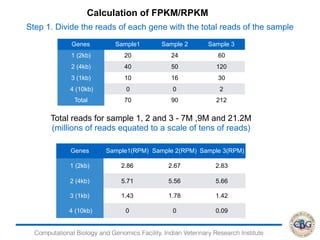
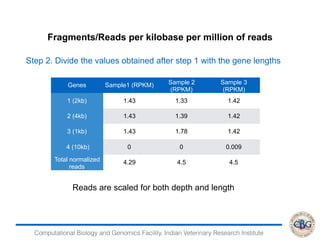
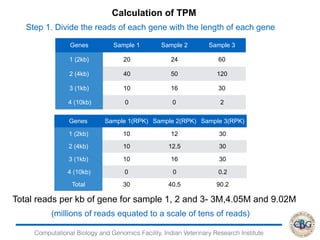
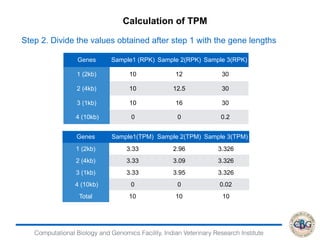
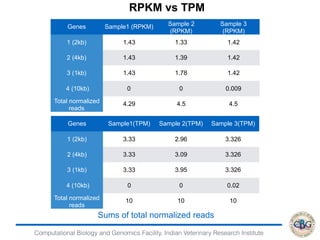
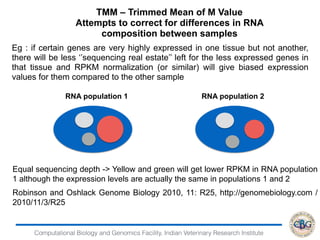
2. It also covers criteria for choosing aligners for different types of sequences, tools for mapping reads across splice junctions, and normalization methods like RPKM and TPM.
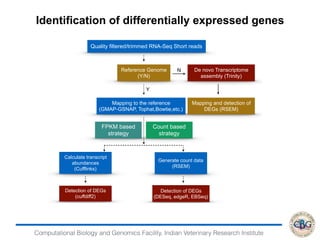
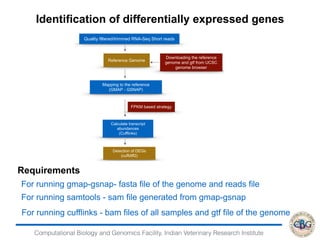
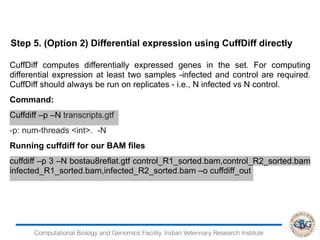
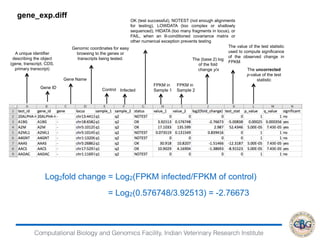
3. The key steps involved in the identification of differentially expressed genes from RNA-seq data using count-based and FPKM-based strategies are described. This includes mapping, quantifying transcripts, and using tools like Cufflinks, RSEM, DESeq and edgeR for detection of differentially expressed genes.
Identifying the Coding and Non Coding Regions of DNA Using Spectral AnalysisIJMER
This paper presents a new method for exon detection in DNA sequences based on multi-scale parametric spectral analysis Identification and analysis of hidden features of coding and non-coding regions of DNA sequence is a challenging problem in the area of genomics. The objective of this paper is to estimate and compare spectral content of coding and non-coding segments of DNA sequence both by Parametric and Non-parametric methods. In this context protein coding region (exon) identification in the DNA sequence has been attaining a great interest in few decades. These coding regions can be identified by exploiting the period-3 property present in it. The discrete Fourier transform has been commonly used as a spectral estimation technique to extract the period-3 patterns present in DNA sequence. Consequently an attempt has been made so that some hidden internal properties of the DNA sequence can be brought into light in order to identify coding regions from non-coding ones. In this approach the DNA sequence from various Homo Sapiens genes have been identified for sample test and assigned numerical values based on weak-strong hydrogen bonding (WSHB) before application of digital signal analysis techniques.
The field of next-generation sequencing (NGS) has been experiencing explosive growth over the past several years and shows little sign of slowing down. The increasing capabilities and dramatically lowered costs have expanded NGS's reach beyond that of the human genome into nearly every corner of biological research. An overview of the platforms on the market today, including an assessment of their relative strengths and weaknesses, will be presented. The presentation will conclude with a peek into where the technology is going and what will be available in the future.
This presentation gives an introduction to analysing ChIP-seq data and is part of a bioinformatics workshop. The accompanying websites are available at http://sschmeier.github.io/bioinf-workshop/#!galaxy-chipseq/
Exploring Spark for Scalable Metagenomics Analysis: Spark Summit East talk by...Spark Summit
Whole genome based metagenomics analyses hold the key to discover novel species from microbial communities, reveal their full metabolic potentials, and understand their interactions with each other. Metagenomics projects based on next generation sequencing typically produce 100GB to 1000GB unstructured data. Unlike many other big data problems, analysis of metagenomics data often generates temporary files with 100 to 1000 times of the original size, posing a significant challenge in both hardware infrastructure and software algorithms. Here we report our experience with evaluating Apache Spark in metagenomics data analysis for its speed, scalability, robustness, and most importantly, ease of programming. We developed a Spark-based scalable metagenomics application to deconvolute individual genomes from a complex microbial community with thousands of species. We then systematically tested its performance on synthetic and real world datasets using the Elastic MapReduce framework provided by Amazon Web Services. Our preliminary results suggest Spark provides a cost-effective solution with rapid development/deployment cycles for metagenomics data analysis. These experience likely extends to other big genomics data analyses, in both research and production settings.
Polymerase Chain Reaction
History of PCR
Instrumentation of PCR
Principle of PCR
Components of PCR
Steps of PCR
Optimal PCR Factors
Applications of PCR
Higher Order Low Pass FIR Filter Design using IPSO Algorithmijtsrd
This paper presents an optimal design of digital low pass finite impulse response FIR filter using Improved Particle Swarm Optimization IPSO . The design target of FIR filter is to approximate the ideal filters on the request of a given designing specifications. The traditional based optimization techniques are not efficient for digital filter design. The filter specification to be realized IPSO algorithm generates the best coefficients and try to meet the ideal frequency response. Improved Particle swarm optimization PSO proposes a new equation for the velocity vector and updating the particle vectors and hence the solution quality is improved. The IPSO technique enhances its search capability that leads to a higher probability of obtaining the optimal solution. In this paper for the given problem the realization of the FIR filter has been performed. The simulation results have been performed by using the improved particle swarm optimization IPSO method. M. Santhanaraj | Rishikesh. S. S | Subramanian. A. N | Vijai Sooriya. Su ""Higher Order Low Pass FIR Filter Design using IPSO Algorithm"" Published in International Journal of Trend in Scientific Research and Development (ijtsrd), ISSN: 2456-6470, Volume-3 | Issue-3 , April 2019, URL: https://www.ijtsrd.com/papers/ijtsrd22899.pdf
Paper URL: https://www.ijtsrd.com/engineering/electronics-and-communication-engineering/22899/higher-order-low-pass-fir-filter-design-using-ipso-algorithm/m-santhanaraj
IJERA (International journal of Engineering Research and Applications) is International online, ... peer reviewed journal. For more detail or submit your article, please visit www.ijera.com
Ion torrent semiconductor sequencing technologyCD Genomics
Ion Torrent is the latest generation sequencing technology. Its core technology is the use of semiconductor technology in chemical and digital information to establish a direct link.
A Gaussian Clustering Based Voice Activity Detector for Noisy Environments Us...CSCJournals
In this paper, a voice activity detector is proposed on the basis of Gaussian modeling of noise in the spectro-temporal space. Spectro-temporal space is obtained from auditory cortical processing. The auditory model that offers a multi-dimensional picture of the sound includes two stages: the initial stage is a model of inner ear and the second stage is the auditory central cortical modeling in the brain. In this paper, the speech noise in this picture has been modeled by a 3-D mono Gaussian cluster. At the start of suggested VAD process, the noise is modeled by a Gaussian shaped cluster. The average noise behavior is obtained in different spectrotemporal space in various points for each frame. In the stage of separation of speech from noise, the criterion is the difference between the average noise behavior and the speech signal amplitude in spectrotemporal domain. This was measured for each frame and was used as the criterion of classification. Using Noisex92, this method is tested in different noise models such as White, exhibition, Street, Office and Train noises. The results are compared to both auditory model and multifeature method. It is observed that the performance of this method in low signal-to-noise ratios (SNRs) conditions is better than other current methods.
International Journal of Engineering Research and Applications (IJERA) is an open access online peer reviewed international journal that publishes research and review articles in the fields of Computer Science, Neural Networks, Electrical Engineering, Software Engineering, Information Technology, Mechanical Engineering, Chemical Engineering, Plastic Engineering, Food Technology, Textile Engineering, Nano Technology & science, Power Electronics, Electronics & Communication Engineering, Computational mathematics, Image processing, Civil Engineering, Structural Engineering, Environmental Engineering, VLSI Testing & Low Power VLSI Design etc.
Sequencing is one of the major technological advancement that has taken shape in the last two or three decade. Starting from Sanger and Maxam-Gilbert sequencing methods to the latest high-throughput methods, sequencing technologies has changed the the landscape of biological sciences.
This slide takes a look a the major sequencing methods over time.
Note: Several images included here have been sourced from GOOGLE IMAGES. The content has been extracted from several SCIENTIFIC PAPERS and WEBSITES.
PLEASE DO CONTACT THE AUTHOR DIRECTLY IF ANY COPYRIGHT ISSUE ARISES.
Open pacbiomodelorgpaper j_landolin_20150121Jane Landolin
Jane Ladolin's slides on Open Data Paper (http://www.nature.com/articles/sdata201445) presented at Balti and Bioinformatics virtual meeting on Jan. 21st 2015. (http://bit.ly/1KYGxr4)
In most of the communication systems speech is transmittes in narrowband, containing frequencies from 300 Hz to 3400 Hz. Compared with normal speech which is generally contains a perceptually significant amount of energy up to 8 kHz, this speech has a muffled quality and reduced intelligibility, particularly noticeable in sounds such as /s/ and /f/ . Speech which has been bandlimited to 8 kHz is often coded for this reason, but this requires an increase in the bit rate.
Wideband reconstruction is a scheme that adds a synthesized highband signal to narrowband speech to produce a higher quality wideband speech signal. The synthesized highband signal is based entirely on information contained in the narrowband speech, and is thus achieved at zero increase in the bit rate from a coding perspective. Wideband reconstruction can function as a post-processor to any narrowband telephone receiver, or alternatively it can be combined with any narrowband speech coder to produce a very low bit rate wideband speech coder. Applications include higher quality mobile, teleconferencing, and internet telephony.
This final project aims to simulate the bandwidth extension system using spectral shifting method for highband excitation, which is used codebook and linear mapping to estimate the envelope of highband. The algorithm for wide band expansion proved to work, though certain unwanted artefacts were introduced in the reconstructed signal. Listening tests confirmed the presence of these unwanted artefacts. Objective and subjective tests demonstrate that wideband speech synthesized using these techniques have presentage in (numerical) 50 % of the respondences with SNR 5,13 dB. Optimum parameter used in this system goes to Euclidean distance with K=1 for KNN classification and correlation distance with 256 clusters for Kmean clustering. Computational time for spectral shifting 0.144 s, for spectral folding 0.138 s and codebook needs 164,2 s. Subjective measurement using DMOS for spectral shifting about 3.65 and for spectral folding 2. However further research and improvement to reach higher quality from this system for implementation are still needed.
Course: Bioinformatics for Biomedical Research (2014).
Session: 4.1- Introduction to RNA-seq and RNA-seq Data Analysis.
Statistics and Bioinformatisc Unit (UEB) & High Technology Unit (UAT) from Vall d'Hebron Research Institute (www.vhir.org), Barcelona.
[2017-05-29] DNASmartTagger : Development of DNA sequence tagging tools based on machine learning using public sequence annotation data, NIG International Symposium 2017.
Learn from influencers. Influencers play a crucial role when it comes to marketing brands. ...
Use social media tools for research. ...
Use hashtag aggregators and analytics tools. ...
Know your hashtags. ...
Find a unique hashtag. ...
Use clear hashtags. ...
Keep It short and simple. ...
Make sure the hashtag is relevant.
Basics of Primer designing.
Steps involved in designing primers for Prokaryotic expression
Steps involved in designing primers for Eukaryotic expression
Read| The latest issue of The Challenger is here! We are thrilled to announce that our school paper has qualified for the NATIONAL SCHOOLS PRESS CONFERENCE (NSPC) 2024. Thank you for your unwavering support and trust. Dive into the stories that made us stand out!
Macroeconomics- Movie Location
This will be used as part of your Personal Professional Portfolio once graded.
Objective:
Prepare a presentation or a paper using research, basic comparative analysis, data organization and application of economic information. You will make an informed assessment of an economic climate outside of the United States to accomplish an entertainment industry objective.
Biological screening of herbal drugs: Introduction and Need for
Phyto-Pharmacological Screening, New Strategies for evaluating
Natural Products, In vitro evaluation techniques for Antioxidants, Antimicrobial and Anticancer drugs. In vivo evaluation techniques
for Anti-inflammatory, Antiulcer, Anticancer, Wound healing, Antidiabetic, Hepatoprotective, Cardio protective, Diuretics and
Antifertility, Toxicity studies as per OECD guidelines
Safalta Digital marketing institute in Noida, provide complete applications that encompass a huge range of virtual advertising and marketing additives, which includes search engine optimization, virtual communication advertising, pay-per-click on marketing, content material advertising, internet analytics, and greater. These university courses are designed for students who possess a comprehensive understanding of virtual marketing strategies and attributes.Safalta Digital Marketing Institute in Noida is a first choice for young individuals or students who are looking to start their careers in the field of digital advertising. The institute gives specialized courses designed and certification.
for beginners, providing thorough training in areas such as SEO, digital communication marketing, and PPC training in Noida. After finishing the program, students receive the certifications recognised by top different universitie, setting a strong foundation for a successful career in digital marketing.
Normal Labour/ Stages of Labour/ Mechanism of LabourWasim Ak
Normal labor is also termed spontaneous labor, defined as the natural physiological process through which the fetus, placenta, and membranes are expelled from the uterus through the birth canal at term (37 to 42 weeks
The French Revolution, which began in 1789, was a period of radical social and political upheaval in France. It marked the decline of absolute monarchies, the rise of secular and democratic republics, and the eventual rise of Napoleon Bonaparte. This revolutionary period is crucial in understanding the transition from feudalism to modernity in Europe.
For more information, visit-www.vavaclasses.com
Welcome to TechSoup New Member Orientation and Q&A (May 2024).pdfTechSoup
In this webinar you will learn how your organization can access TechSoup's wide variety of product discount and donation programs. From hardware to software, we'll give you a tour of the tools available to help your nonprofit with productivity, collaboration, financial management, donor tracking, security, and more.
Operation “Blue Star” is the only event in the history of Independent India where the state went into war with its own people. Even after about 40 years it is not clear if it was culmination of states anger over people of the region, a political game of power or start of dictatorial chapter in the democratic setup.
The people of Punjab felt alienated from main stream due to denial of their just demands during a long democratic struggle since independence. As it happen all over the word, it led to militant struggle with great loss of lives of military, police and civilian personnel. Killing of Indira Gandhi and massacre of innocent Sikhs in Delhi and other India cities was also associated with this movement.
1. Computational Biology and Genomics Facility, Indian Veterinary Research Institute
Basics of RNA - seq data analysis
Revision
2. Computational Biology and Genomics Facility, Indian Veterinary Research Institute
Drawback of Dynamic programming - Very slow
Need for - faster alignment strategies
Fast Sequence alignment strategies
• Using hash table based indexing - seed extend paradigm, space allowance
• Using suffix/prefix tree based - Suffix array, Burrows wheeler
transformation and FM index
• Merge sorting
Strategy: making a dictionary (index) – An example of 4-nt index
AAAA: 235, 783, 10083,......
AAAC: 132, 236, 832, 932, ...
TTTT: 327, 1328, 5523,......
Algorithms
Hashing reads - Eland, MAQ, Mosaik...
Hashing reference genome - BFAST, Mosaik, SOAP, ...
Hash table based indexing
3. Computational Biology and Genomics Facility, Indian Veterinary Research Institute
Burrows wheeler transformation and FM index
4. Computational Biology and Genomics Facility, Indian Veterinary Research Institute
Criteria for choosing an aligner
• Global or local
• Aligning short sequences to long sequences such as short
reads to a reference
• Aligning long sequences to long sequences such as long
reads or contigs to a reference
• Handles small gaps (insertions and deletions)
• Handles large gaps (introns)
• Handles split alignments (chimera)
• Speed and ease of use
5. Computational Biology and Genomics Facility, Indian Veterinary Research Institute
Short read aligner
Aligner Purpose
Bowtie Fast
BWA small gaps (indels)
GSNAP Large gaps (introns)
Bowtie 2 Takes care of gaps
Long sequence aligner
Aligner Purpose
BLAST Many reference genome
BLAT Large gaps (introns)
BWA Small gaps (indels)
Exonerate Ease of use
GMAP Large gaps (introns)
MUMmer Align two genome
7. Computational Biology and Genomics Facility, Indian Veterinary Research Institute
• Available tools:
• MapSplice, SpliceMap, TopHat
• Two step procedure
• Map reads continuously using
unspliced read aligners
• Unmapped reads are split into shorter
segments and aligned independently
• Efficient when not too many reads into
the junction
• Second step is computationally intensive
• Can miss reads across exon-intron
junctions
RNA
Exon read mapping
Spliced read mapping
Exon 1 Exon 2
Exon - first approach
8. Computational Biology and Genomics Facility, Indian Veterinary Research Institute
• Representative algorithms
• Genomic short read nucleotide
alignment program (GSNAP)
• Computing accurate spliced
alignments (QPALMA)
• Steps
• Break reads into short seeds
• Candidate regions are
combined’ (such as Smith-Waterman)
• Increased sensitivity
• One arm may not provide enough
specificity for alignment
RNA
Exon 1 Exon 2
Exon read mapping
Spliced read mapping
Exon 1 Exon 2
RNA
Seed matching
K-mer seeds
Seed extend
Seed - extend approach
9. Computational Biology and Genomics Facility, Indian Veterinary Research Institute
A software package that identifies splice sites ab initio by large- scale
mapping of RNA-Seq reads.
• A splice junction mapping algorithm must be able to identify reads that
may have only a few bases on one side of a junction, or else that
junction will be missed
TopHat
Map reads to whole genome with Bowtie
Collect initially unmappable
reads
Build seed table index
from
unmappable reads
Generate possible splices
between
neighbouring exons
Map reads to possible
splices
via seed-and-extend
Assemble consensus of
covered regions
gt ag ag
gt ag ag
10. Computational Biology and Genomics Facility, Indian Veterinary Research Institute
Normalization of read count
R/FPKM (Mortazavi et al.,2008) - Reads/Fragment per kilobase of exon
per million mappable reads
• Corrects for: differences in sequencing depth and transcript length
• Aiming to: compare a gene across samples and different genes within
samples
TMM (Robinson and Oshlack., 2010) - Trimmed mean of M values
• Corrects for: differences in transcript pool composition; extreme outliers
• Aiming to: provide better across-sample comparability
11. Computational Biology and Genomics Facility, Indian Veterinary Research Institute
Normalization of read count
Limma voom (LogCPM) (Law et al.,2013) - Counts per million
• Aiming to: Stabilize variance, removes dependence of variance on the
mean
TPM (Li etal 2010, Wagner et al 2012) - Transcripts per million
• Corrects for: transcript length distribution in RNA pool
• Aiming to: provide better across-sample comparability
12. Computational Biology and Genomics Facility, Indian Veterinary Research Institute
• FPKM for paired end reads and RPKM for single end reads
• Fragment means fragment of DNA, so the two reads that
comprise a paired-end read count as one.
• Per kilobase of exon means the counts of fragments are then
normalized by dividing by the total length of all exons in the gene.
• This bit of magic makes it possible to compare Gene A to Gene B
even if they are of different lengths.
• Per million reads means this value is then normalized against the
library size.
• This bit of magic makes it possible to compare Gene A in Sample
1 to Sample 2
R/FPKM (Mortazavi et al.,2008)
13. Computational Biology and Genomics Facility, Indian Veterinary Research Institute
A quantification measurement for gene expression
• R: expression level of the gene
• L: length of the gene
• N: depth of the sequencing
• C: number total reads fall into the gene region
R/FPKM (Mortazavi et al.,2008)
Total exon size of a gene is 3,000-nt. Calculate the expression levels for
this gene in RPKM in an RNA-seq experiment that contained 50 million
mappable reads, with 600 reads falling into exon regions of this gene.
R = 600/(50 × 3.000) = 4.00
R = C ÷ L × N( ) L in kbs and N in Millions
14. Computational Biology and Genomics Facility, Indian Veterinary Research Institute
Calculation of FPKM/RPKM
Genes Sample1 Sample 2 Sample 3
1 (2kb) 20 24 60
2 (4kb) 40 50 120
3 (1kb) 10 16 30
4 (10kb) 0 0 2
Total 70 90 212
Total reads for sample 1, 2 and 3 - 7M ,9M and 21.2M
(millions of reads equated to a scale of tens of reads)
Step 1. Divide the reads of each gene with the total reads of the sample
Genes Sample1(RPM) Sample 2(RPM) Sample 3(RPM)
1 (2kb) 2.86 2.67 2.83
2 (4kb) 5.71 5.56 5.66
3 (1kb) 1.43 1.78 1.42
4 (10kb) 0 0 0.09
15. Computational Biology and Genomics Facility, Indian Veterinary Research Institute
Fragments/Reads per kilobase per million of reads
Reads are scaled for both depth and length
Step 2. Divide the values obtained after step 1 with the gene lengths
Genes Sample1 (RPKM) Sample 2
(RPKM)
Sample 3
(RPKM)
1 (2kb) 1.43 1.33 1.42
2 (4kb) 1.43 1.39 1.42
3 (1kb) 1.43 1.78 1.42
4 (10kb) 0 0 0.009
Total normalized
reads
4.29 4.5 4.5
16. Computational Biology and Genomics Facility, Indian Veterinary Research Institute
Calculation of TPM
Step 1. Divide the reads of each gene with the length of each gene
Genes Sample 1 Sample 2 Sample 3
1 (2kb) 20 24 60
2 (4kb) 40 50 120
3 (1kb) 10 16 30
4 (10kb) 0 0 2
Total reads per kb of gene for sample 1, 2 and 3- 3M,4.05M and 9.02M
Genes Sample 1(RPK) Sample 2(RPK) Sample 3(RPK)
1 (2kb) 10 12 30
2 (4kb) 10 12.5 30
3 (1kb) 10 16 30
4 (10kb) 0 0 0.2
Total 30 40.5 90.2
(millions of reads equated to a scale of tens of reads)
17. Computational Biology and Genomics Facility, Indian Veterinary Research Institute
Step 2. Divide the values obtained after step 1 with the gene lengths
Genes Sample1(TPM) Sample 2(TPM) Sample 3(TPM)
1 (2kb) 3.33 2.96 3.326
2 (4kb) 3.33 3.09 3.326
3 (1kb) 3.33 3.95 3.326
4 (10kb) 0 0 0.02
Total 10 10 10
Genes Sample1 (RPK) Sample 2(RPK) Sample 3(RPK)
1 (2kb) 10 12 30
2 (4kb) 10 12.5 30
3 (1kb) 10 16 30
4 (10kb) 0 0 0.2
Calculation of TPM
18. Computational Biology and Genomics Facility, Indian Veterinary Research Institute
RPKM vs TPM
Genes Sample1 (RPKM) Sample 2
(RPKM)
Sample 3
(RPKM)
1 (2kb) 1.43 1.33 1.42
2 (4kb) 1.43 1.39 1.42
3 (1kb) 1.43 1.78 1.42
4 (10kb) 0 0 0.009
Total normalized
reads
4.29 4.5 4.5
Genes Sample1(TPM) Sample 2(TPM) Sample 3(TPM)
1 (2kb) 3.33 2.96 3.326
2 (4kb) 3.33 3.09 3.326
3 (1kb) 3.33 3.95 3.326
4 (10kb) 0 0 0.02
Total normalized
reads
10 10 10
Sums of total normalized reads
19. Computational Biology and Genomics Facility, Indian Veterinary Research Institute
Eg : if certain genes are very highly expressed in one tissue but not another,
there will be less ‘’sequencing real estate’’ left for the less expressed genes in
that tissue and RPKM normalization (or similar) will give biased expression
values for them compared to the other sample
Equal sequencing depth -> Yellow and green will get lower RPKM in RNA population
1 although the expression levels are actually the same in populations 1 and 2
Robinson and Oshlack Genome Biology 2010, 11: R25, http://genomebiology.com /
2010/11/3/R25
RNA population 1 RNA population 2
TMM – Trimmed Mean of M Value
Attempts to correct for differences in RNA
composition between samples
20. Computational Biology and Genomics Facility, Indian Veterinary Research Institute
Identification of Differentially expressed genes - I
(using Cufflinks)
21. Computational Biology and Genomics Facility, Indian Veterinary Research Institute
Identification of differentially expressed genes
Quality filtered/trimmed RNA-Seq Short reads
FPKM based
strategy
Calculate transcript
abundances
(Cufflinks)
Reference Genome
(Y/N)
Mapping to the reference
(GMAP-GSNAP, Tophat,Bowtie,etc.)
Y
N De novo Transcriptome
assembly (Trinity)
Mapping and detection of
DEGs (RSEM)
Count based
strategy
Generate count data
(RSEM)
Detection of DEGs
(cuffdiff2)
Detection of DEGs
(DESeq, edgeR, EBSeq)
22. Computational Biology and Genomics Facility, Indian Veterinary Research Institute
Identification of differentially expressed genes
Quality filtered/trimmed RNA-Seq Short reads
FPKM based strategy
Calculate transcript
abundances
(Cufflinks)
Reference Genome
Mapping to the reference
(GMAP - GSNAP)
Detection of DEGs
(cuffdiff2)
Downloading the reference
genome and gtf from UCSC
genome browser
Requirements
For running gmap-gsnap- fasta file of the genome and reads file
For running cufflinks - bam files of all samples and gtf file of the genome
For running samtools - sam file generated from gmap-gsnap
23. Computational Biology and Genomics Facility, Indian Veterinary Research Institute
Downloading the FASTA file and GTF from the UCSC genome
browser (https://genome.ucsc.edu)
26. Computational Biology and Genomics Facility, Indian Veterinary Research Institute
When you click on the bosTau8.fa.gz, you will be able to download a file of
866.1MB,which on clicking would give a file of 2.72 GB
29. Computational Biology and Genomics Facility, Indian Veterinary Research Institute
Genome Mapping and Alignment using GMAP - GSNAP
Genomic Mapping and Alignment Program
• GMAP is a standalone program for mapping and aligning cDNA sequences to a
genome.
• The program maps and aligns a single sequence with minimal startup time and
memory requirements, and provides fast batch processing of large sequence sets.
• The program generates accurate gene structures, even in the presence of
substantial polymorphisms and sequence errors, without using probabilistic splice
site models.
Step 1. Command for indexing the the genome : gmap_build -d btau8
bosTau8.fa
Initially used a hashing
scheme but later used a
much more efficient
double lookup scheme
30. Computational Biology and Genomics Facility, Indian Veterinary Research Institute
The index files created are as below in the folder btau8
gsnap –d btau8 –t 4 control_R1.fastq> control_R1.sam
Step 2. Mapping the reads to the genome
31. Computational Biology and Genomics Facility, Indian Veterinary Research Institute
• The end product of the GMAP aligner is a SAM file which needs to be
converted into a BAM file for further analysis in cufflinks.
• Repeat the same for the other replicate by changing the input file name.
• A total of four SAM files are generated separately.
The BAM files generated can be analysed in two ways -
1. The BAM files can be used to generate a merged assembly of transcripts
via cufflinks and cuffmerge. This merged assembly (i.e merged.gtf) is
used in cuffdiff to generate differential expressed genes.
2. Cuffdiff can be used directly to generate differentially expressed genes
using the BAM files generated.
The index files created are as below in the folder btau8
32. Computational Biology and Genomics Facility, Indian Veterinary Research Institute
./samtools view –bsh aln.sam >aln.bam
-b: Output in the BAM format. -s: Input in the SAM format. –h: Include
header in the output
For the Control sample:
./samtools view –bsh control_R1.sam >control_R1.bam
For the Infected sample:
./samtools view –bsh infected_R1.sam >infected_R1.bam
Step 3. Converting SAM to BAM using samtools
33. Computational Biology and Genomics Facility, Indian Veterinary Research Institute
Command for sorting:./samtools sort aln.bam aln.sorted
Example:
For the Control sample:
./samtools sort control_R1.bam control_R1_sorted
For the Infected sample:
./samtools sort infected_R1.bam infected_R1_sorted
Step 4. Sorting BAM using samtools
34. Computational Biology and Genomics Facility, Indian Veterinary Research Institute
Command for running cufflinks on a BAM file
For the Control sample:
cufflinks -G btau8refflat.gtf -g btau8refflat.gtf -b bosTau8.fa -u -L CN
control_R1_sorted.bam
Step 5. (Option 1) Differential expression using cufflinks,
cuffmerge and cuffdiff.
35. Computational Biology and Genomics Facility, Indian Veterinary Research Institute
For the infected sample:
cufflinks -G btau8refflat.gtf -g btau8refflat.gtf -b bosTau8.fa -u -L CN
infected_R1_sorted.bam
These commands generate transcript.gtf files for each replicate, which are
further used in cuffmerge to generate a merged assembly. This merged
assembly is then used in cuffdiff to generate differentially expressed genes.
36. Computational Biology and Genomics Facility, Indian Veterinary Research Institute
Command for running cuffmerge
cuffmerge -g btau8refflat.gtf -s bosTau8.fa -p 8 assemblies.txt
assemblies.txt is the file with the list of all the GTFs.
This generates a merged.gtf in the merged_asm folder. This file is
used in the next cuffdiff command.
Command for running cuffdiff
cuffdiff merged.gtf control_R1_sorted.bam control_R2_sorted.bam
infected_R1_sorted.bam infected_R2_sorted.bam
This command generates many files, out of which gene_exp.diff is the file
of our concern.
37. Computational Biology and Genomics Facility, Indian Veterinary Research Institute
CuffDiff computes differentially expressed genes in the set. For computing
differential expression at least two samples -infected and control are required.
CuffDiff should always be run on replicates - i.e., N infected vs N control.
Command:
Cuffdiff –p –N transcripts.gtf
-p: num-threads <int>. -N
Running cuffdiff for our BAM files
cuffdiff –p 3 –N bostau8reflat.gtf control_R1_sorted.bam,control_R2_sorted.bam
infected_R1_sorted.bam,infected_R2_sorted.bam –o cuffdiff_out
Step 5. (Option 2) Differential expression using CuffDiff directly
38. Computational Biology and Genomics Facility, Indian Veterinary Research Institute
A unique identifier
describing the object
(gene, transcript, CDS,
primary transcript)
Gene ID
Gene Name
Infected
OK (test successful), NOTEST (not enough alignments
for testing), LOWDATA (too complex or shallowly
sequenced), HIDATA (too many fragments in locus), or
FAIL, when an ill-conditioned covariance matrix or
other numerical exception prevents testing
FPKM in
Sample 1
FPKM in
Sample 2
The (base 2) log
of the fold
change y/x
Genomic coordinates for easy
browsing to the genes or
transcripts being tested.
Control
The value of the test statistic
used to compute significance
of the observed change in
FPKM
The uncorrected
p-value of the test
statistic
gene_exp.diff
Log2fold change = Log2(FPKM infected/FPKM of control)
= Log2(0.576748/3.92513) = -2.76673