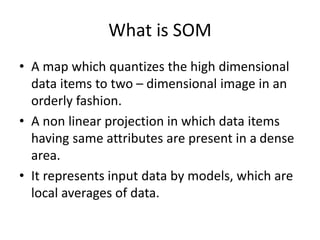
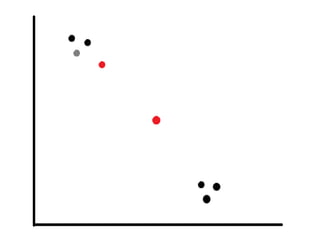
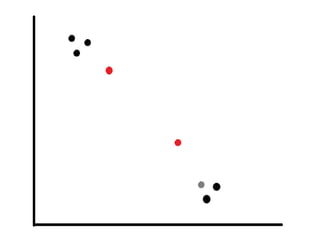
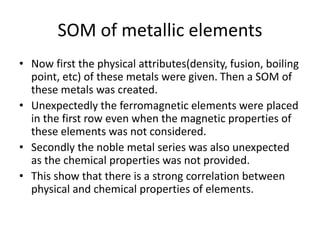
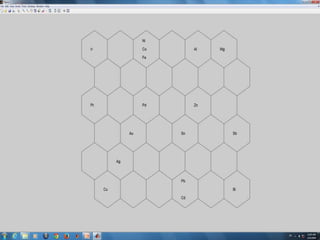
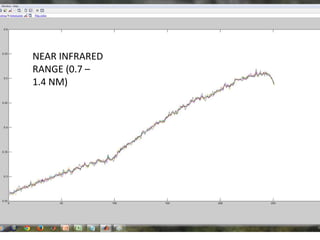
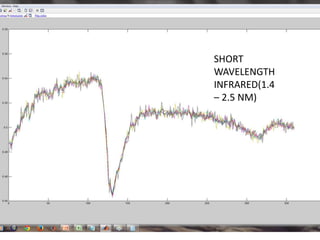
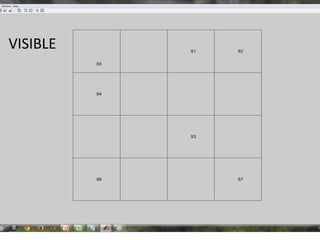
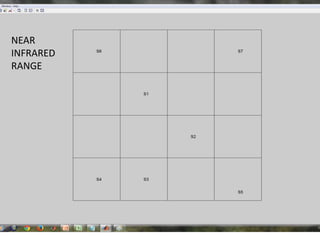
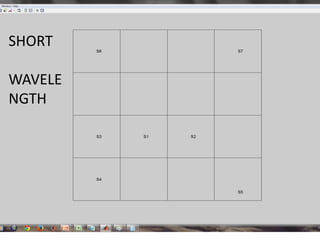
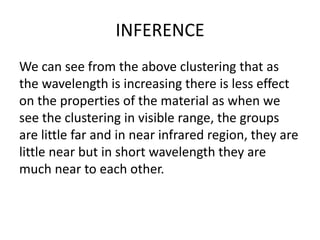
Self Organizing Maps
Made By
Daksh Raj Chopra
(Trainee – Defence Research and
Development Organization(DRDO), Delhi)
What is SOM
• A map which quantizes the high dimensional
data items to two – dimensional image in an
orderly fashion.
• A non linear projection in which data items
having same attributes are present in a dense
area.
• It represents input data by models, which are
local averages of data.
Why do we need SOM
There existed a projection known as Sammon
Projection which showed image of data items
having same attributes closer to each other
and different one having more distance. But it
could not convert high dimensional to low
dimensional image. For that we needed SOM
which work on machine learning process from
the neurons(attributes) provided at the input.
What does SOM do
• SOM is a neural model. In this models are
developed that is the final value of model or
weighted vectors are developed by learning.
• Similar models have nodes closer in the array
and different models have farther nodes in the
array.
SOM as DATA MINE
SOM used a data mining technique, that it
works on the principle of pattern recognize. It
uses the idea of adaptive networks that
started the Artificial Intelligence research. This
further helps in the data analysis. For example
while studying 17 different elements, we used
to differentiate of the basis of physical
properties but SOM learned the values and
made a pattern. After that it did a clustering of
that 17 elements
Applications of SOM
• Statistical methods at large
• Industrial analysis
• Biomedical analysis
• Financial application
Size selection of array
• This is the first question that comes to our mind
that what should be the size of structure of data
items. There is no particular size for the structure.
It is purely a hit-and-trial error method and final
answer can be obtained. Typical size of nodes can
be from few dozens to hundreds.
• Also there are different shapes for the array
having topology like cylinder, torus or sphere.
Problem arises at the boundaries where there are
distortion and discontinuities. Toroidal topology
have solved the issue as it has no boundaries.
Batch computation of SOM
• This algorithm is usually preferred in practice
because of 2 reasons. First is that it does not
require time learning rate parameter which
was needed in stepwise model making this
algorithm faster.
• Secondly the algorithm gets over in fixed
number of iterations if the training points are
same at every iteration and neighborhood
function is held constant.
Pictorial illustration of
Self organizing map
Illustrations done using self organizing
map technique
SOM of metallic elements
• Now first the physical attributes(density, fusion, boiling
point, etc) of these metals were given. Then a SOM of
these metals was created.
• Unexpectedly the ferromagnetic elements were placed
in the first row even when the magnetic properties of
these elements was not considered.
• Secondly the noble metal series was also unexpected
as the chemical properties was not provided.
• This show that there is a strong correlation between
physical and chemical properties of elements.
SOM of color vectors
• Another example in which a color matrix was
given for the creation of SOM. Then again an
unexpected result came in the SOM.
• An output of two dimensional color matrix
came in which a three dimensional matrix was
given. There was no black color in the matrix
but only bright colors. Again the experiment
was done and more bright colors were
obtained.
Feature of SOM
U – Matrix
U matrix helps in better visualization of map.
Data items present close to each other are
lightly colored and items at a far distance are
darker in color.
Commands Used in MATLAB
• min- this finds the minimum value in the vector/matrix.
• max- this finds the minimum value in the vector/matrix.
• som_lininit- this initializes the map after calculating the
eigen vectors
• som_batchtrain- trains the given som with the given
training data.
• som_cplane- this visualizes a 2D plane or u matrix
• sum- adds all the array elements.
• mod- gives the remainder.
• floor- rounds off the number to the lower value.
• text- creates text object at the axes.
Clustering of Data
Objective
• A spectral data of 25 soils is given.
• Adding some amount of noise to the
spectrum(0.4-2.5 nm) and see any change in
the properties.
• Finally clustering the data with the help of
SOM formed.
Experiment
Procedure
• A range of spectral values was taken of any
one soil type(say Very dark grayish brown silty
loam) at a time.
• A small amount of noise was added to the
spectrum starting with the SNR 60 and further
decreasing the SNR by 2(increasing the noise).
• A spectral table of 7 different spectrum having
different noise level was clustered.
TOTAL PLOT
VISIBLE RANGE
SPECTRUM (0.4-
0.7 NM)
NEAR INFRARED
RANGE (0.7 –
1.4 NM)
SHORT
WAVELENGTH
INFRARED(1.4
– 2.5 NM)
VISIBLE
NEAR
INFRARED
RANGE
SHORT
WAVELE
NGTH
INFERENCE
We can see from the above clustering that as
the wavelength is increasing there is less effect
on the properties of the material as when we
see the clustering in visible range, the groups
are little far and in near infrared region, they are
little near but in short wavelength they are
much near to each other.
THANK YOU

Self Organizing Maps

  • 1.
    Self Organizing Maps MadeBy Daksh Raj Chopra (Trainee – Defence Research and Development Organization(DRDO), Delhi)
  • 2.
    What is SOM •A map which quantizes the high dimensional data items to two – dimensional image in an orderly fashion. • A non linear projection in which data items having same attributes are present in a dense area. • It represents input data by models, which are local averages of data.
  • 3.
    Why do weneed SOM There existed a projection known as Sammon Projection which showed image of data items having same attributes closer to each other and different one having more distance. But it could not convert high dimensional to low dimensional image. For that we needed SOM which work on machine learning process from the neurons(attributes) provided at the input.
  • 4.
    What does SOMdo • SOM is a neural model. In this models are developed that is the final value of model or weighted vectors are developed by learning. • Similar models have nodes closer in the array and different models have farther nodes in the array.
  • 5.
    SOM as DATAMINE SOM used a data mining technique, that it works on the principle of pattern recognize. It uses the idea of adaptive networks that started the Artificial Intelligence research. This further helps in the data analysis. For example while studying 17 different elements, we used to differentiate of the basis of physical properties but SOM learned the values and made a pattern. After that it did a clustering of that 17 elements
  • 6.
    Applications of SOM •Statistical methods at large • Industrial analysis • Biomedical analysis • Financial application
  • 7.
    Size selection ofarray • This is the first question that comes to our mind that what should be the size of structure of data items. There is no particular size for the structure. It is purely a hit-and-trial error method and final answer can be obtained. Typical size of nodes can be from few dozens to hundreds. • Also there are different shapes for the array having topology like cylinder, torus or sphere. Problem arises at the boundaries where there are distortion and discontinuities. Toroidal topology have solved the issue as it has no boundaries.
  • 8.
    Batch computation ofSOM • This algorithm is usually preferred in practice because of 2 reasons. First is that it does not require time learning rate parameter which was needed in stepwise model making this algorithm faster. • Secondly the algorithm gets over in fixed number of iterations if the training points are same at every iteration and neighborhood function is held constant.
  • 9.
  • 13.
    Illustrations done usingself organizing map technique
  • 14.
    SOM of metallicelements • Now first the physical attributes(density, fusion, boiling point, etc) of these metals were given. Then a SOM of these metals was created. • Unexpectedly the ferromagnetic elements were placed in the first row even when the magnetic properties of these elements was not considered. • Secondly the noble metal series was also unexpected as the chemical properties was not provided. • This show that there is a strong correlation between physical and chemical properties of elements.
  • 16.
    SOM of colorvectors • Another example in which a color matrix was given for the creation of SOM. Then again an unexpected result came in the SOM. • An output of two dimensional color matrix came in which a three dimensional matrix was given. There was no black color in the matrix but only bright colors. Again the experiment was done and more bright colors were obtained.
  • 18.
    Feature of SOM U– Matrix U matrix helps in better visualization of map. Data items present close to each other are lightly colored and items at a far distance are darker in color.
  • 19.
    Commands Used inMATLAB • min- this finds the minimum value in the vector/matrix. • max- this finds the minimum value in the vector/matrix. • som_lininit- this initializes the map after calculating the eigen vectors • som_batchtrain- trains the given som with the given training data. • som_cplane- this visualizes a 2D plane or u matrix • sum- adds all the array elements. • mod- gives the remainder. • floor- rounds off the number to the lower value. • text- creates text object at the axes.
  • 20.
    Clustering of Data Objective •A spectral data of 25 soils is given. • Adding some amount of noise to the spectrum(0.4-2.5 nm) and see any change in the properties. • Finally clustering the data with the help of SOM formed.
  • 21.
    Experiment Procedure • A rangeof spectral values was taken of any one soil type(say Very dark grayish brown silty loam) at a time. • A small amount of noise was added to the spectrum starting with the SNR 60 and further decreasing the SNR by 2(increasing the noise). • A spectral table of 7 different spectrum having different noise level was clustered.
  • 22.
  • 23.
  • 24.
  • 25.
  • 26.
  • 27.
  • 28.
  • 29.
    INFERENCE We can seefrom the above clustering that as the wavelength is increasing there is less effect on the properties of the material as when we see the clustering in visible range, the groups are little far and in near infrared region, they are little near but in short wavelength they are much near to each other.
  • 30.